Murrells Inlet, SC (South Carolina) Houses and Residents
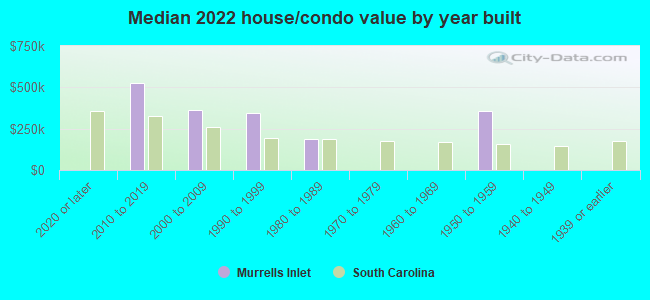
Estimated median house or condo value in 2022: $396,267 (it was $100,700 in 2000 )
Murrells Inlet:
$396,267South Carolina:
$254,600
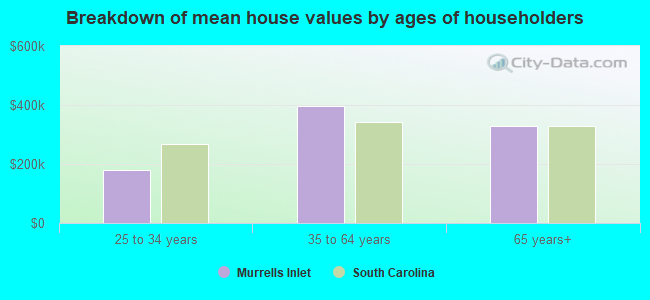
Lower value quartile - upper value quartile: $182,678 - $541,762Mean price in 2022: Detached houses: $501,651 Here:
$501,651State:
$368,255
Townhouses or other attached units: $190,523 Here:
$190,523State:
$292,023
In 3-to-4-unit structures: $115,200 Here:
$115,200State:
$230,702
In 5-or-more-unit structures: $219,329 Here:
$219,329State:
$326,361
Mobile homes: $103,005 Here:
$103,005State:
$102,531
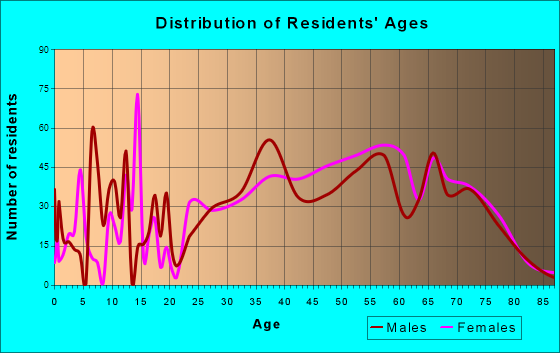
Total population: 7,547 (Urban population: 4,951, Rural population: 541 (all nonfarm) )
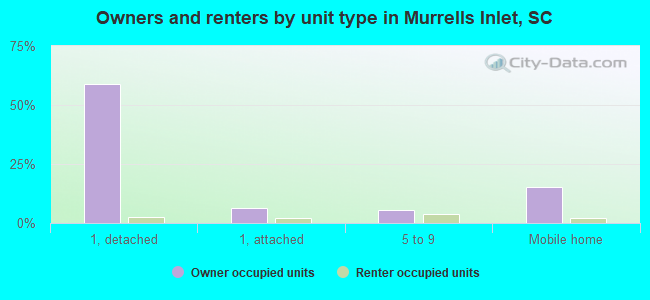
Houses: 5,693 (4,739 occupied: 4,118 owner occupied, 712 renter occupied )
% of renters here:
15%State:
28%
Housing density: 776 houses/condos per square mile
Median price asked for vacant for-sale houses and condos in 2022: $3,275,733.
Median contract rent in 2022: $1,348 (lower quartile is $1,013, upper quartile is $1,514)
Median rent asked for vacant for-rent units in 2022: $1,175
Median gross rent in Murrells Inlet, SC in 2022: $1,429
Housing units in Murrells Inlet with a mortgage: 2,427 (239 second mortgage, 2 home equity loan, 231 both second mortgage and home equity loan )Houses without a mortgage: 14
Median household income for houses/condos with a mortgage: $94,449
Median household income for apartments without a mortgage: $61,623
Median monthly housing costs: $1,119
Data:
Median house or condo value ($)
Median house or condo value ($ change since 2000)
Median house or condo value ($) - White
Median house or condo value ($) - Black or African American
Median house or condo value ($) - Asian
Median house or condo value ($) - Hispanic or Latino
Median house or condo value ($) - American Indian and Alaska Native
Median house or condo value ($) - Multirace
Median house or condo value ($) - Other Race
Median price asked for mobile homes ($)
Household density (households per square mile)
Mean house or condo value by units in structure - 1, detached ($)
Mean house or condo value by units in structure - 1, attached ($)
Mean house or condo value by units in structure - 2 ($)
Mean house or condo value by units in structure by units in structure - 3 or 4 ($)
Mean house or condo value by units in structure - 5 or more ($)
Mean house or condo value by units in structure - Boat, RV, van, etc. ($)
Mean house or condo value by units in structure - Mobile home ($)
Median contract rent ($)
Median contract rent - Lower quartile ($)
Median contract rent - Upper quartile ($)
Median gross rent ($)
Urban houses (%)
Rural houses (%)
Houses occupied (%)
Houses occupied (% change since 2000)
Houses owner occupied (%)
Houses owner occupied (% change since 2000)
Houses renter occupied (%)
Houses renter occupied (% change since 2000)
Vacant housing units - For rent (%)
Vacant housing units - For rent (% change since 2000)
Vacant housing units - For sale only (%)
Vacant housing units - For sale only (% change since 2000)
Vacant housing units - Rented or sold, not occupied (%)
Vacant housing units - Rented or sold, not occupied (% change since 2000)
Vacant housing units - For seasonal, recreational, or occasional use (%)
Vacant housing units - For seasonal, recreational, or occasional use (% change since 2000)
Vacant housing units - For migrant workers (%)
Vacant housing units - For migrant workers (% change since 2000)
Vacant housing units - Other vacant (%)
Vacant housing units - Other vacant (% change since 2000)
Median monthly housing costs ($)
Median household income for houses/condos with a mortgage ($)
Median household income for houses/condos without a mortgage ($)
Median household income ($)
Median household income ($) - White
Median household income ($) - Black or African American
Median household income ($) - Asian
Median household income ($) - Hispanic or Latino
Median household income ($) - American Indian and Alaska Native
Median household income ($) - Multirace
Median household income ($) - Other Race
Mortgage status - with mortgage (%)
Mortgage status - with second mortgage (%)
Mortgage status - with home equity loan (%)
Mortgage status - with both second mortgage and home equity loan (%)
Mortgage status - without a mortgage (%)
Median year house/condo built
Median year apartment built
Household type by relationship - Male householder living alone (%)
Household type by relationship - Male householder not living alone (%)
Household type by relationship - Female householder living alone (%)
Household type by relationship - Female householder not living alone (%)
Household type by relationship - Opposite-Sex spouse (%)
Household type by relationship - Same-Sex spouse (%)
Household type by relationship - Opposite-Sex unmarried partner (%)
Household type by relationship - Same-Sex unmarried partner (%)
Household type by relationship - In group quarters (%)
Size of family households - 2-person household (%)
Size of family households - 3-person household (%)
Size of family households - 4-person household (%)
Size of family households - 5-person household (%)
Size of family households - 6-person household (%)
Size of family households - 7-or-more-person household (%)
Size of nonfamily households - 1-person household (%)
Size of nonfamily households - 2-person household (%)
Size of nonfamily households - 3-person household (%)
Size of nonfamily households - 4-person household (%)
Size of nonfamily households - 5-person household (%)
Size of nonfamily households - 6-person household (%)
Size of nonfamily households - 7-or-moreperson household (%)
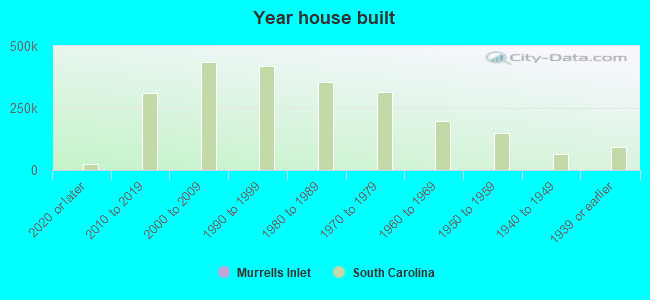
Year house built - Built 2010 or later (%)
Year house built - Built 2000 to 2009 (%)
Year house built - Built 1990 to 1999 (%)
Year house built - Built 1980 to 1989 (%)
Year house built - Built 1970 to 1979 (%)
Year house built - Built 1960 to 1969 (%)
Year house built - Built 1950 to 1959 (%)
Year house built - Built 1940 to 1949 (%)
Year house built - Built 1939 or earlier (%)
Median number of rooms in houses and condos
Median number of rooms in apartments
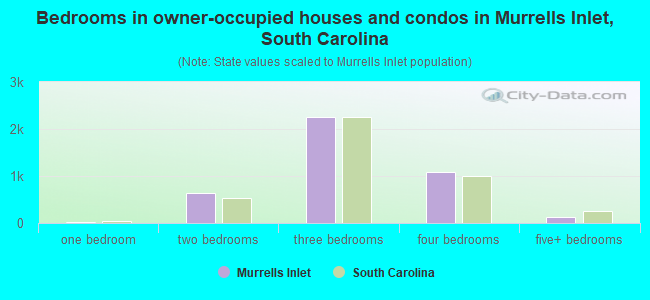
Median number of bedrooms in owner occupied houses
Mean number of bedrooms in owner occupied houses
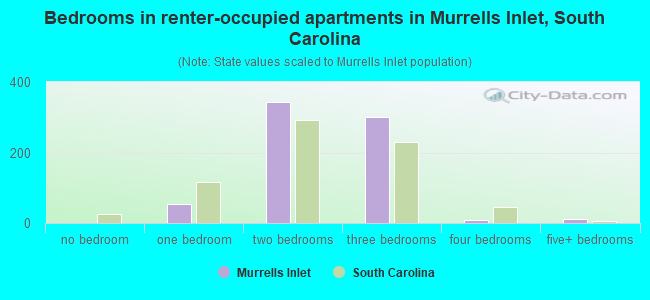
Median number of bedrooms in renter occupied houses
Mean number of bedrooms in renter occupied houses
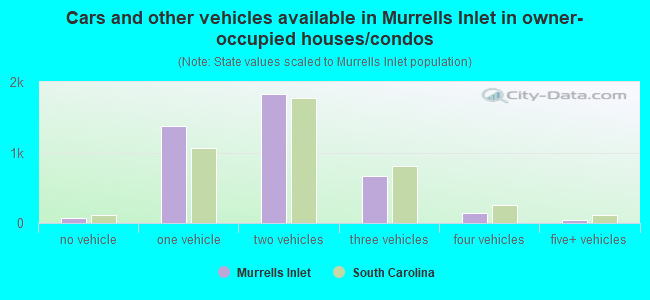
Median number of vehichles in owner occupied houses
Mean number of vehichles in owner occupied houses
Median number of vehichles in renter occupied houses
Mean number of vehichles in renter occupied houses
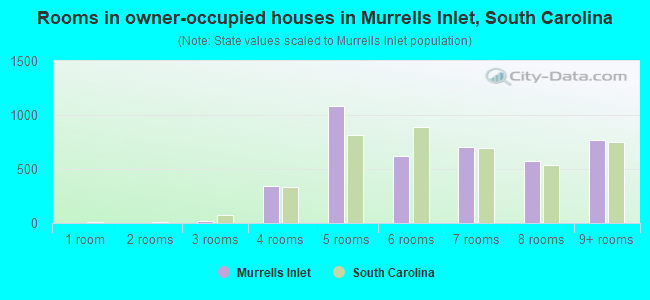
Rooms in owner-occupied houses - 1 room (%)
Rooms in owner-occupied houses - 2 rooms (%)
Rooms in owner-occupied houses - 3 rooms (%)
Rooms in owner-occupied houses - 4 rooms (%)
Rooms in owner-occupied houses - 5 rooms (%)
Rooms in owner-occupied houses - 6 rooms (%)
Rooms in owner-occupied houses - 7 rooms (%)
Rooms in owner-occupied houses - 8 rooms (%)
Rooms in owner-occupied houses - 9+ rooms (%)
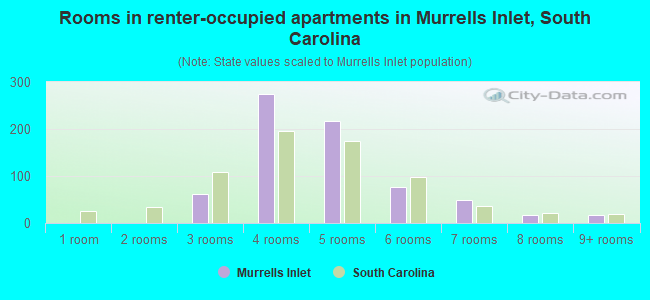
Rooms in renter-occupied houses - 1 room (%)
Rooms in renter-occupied houses - 2 rooms (%)
Rooms in renter-occupied houses - 3 rooms (%)
Rooms in renter-occupied houses - 4 rooms (%)
Rooms in renter-occupied houses - 5 rooms (%)
Rooms in renter-occupied houses - 6 rooms (%)
Rooms in renter-occupied houses - 7 rooms (%)
Rooms in renter-occupied houses - 8 rooms (%)
Rooms in renter-occupied houses - 9+ rooms (%)
Bedrooms in owner-occupied houses - no bedrooms (%)
Bedrooms in owner-occupied houses - 1 bedroom (%)
Bedrooms in owner-occupied houses - 2 bedrooms (%)
Bedrooms in owner-occupied houses - 3 bedrooms (%)
Bedrooms in owner-occupied houses - 4 bedrooms (%)
Bedrooms in owner-occupied houses - 5+ bedrooms (%)
Bedrooms in renter-occupied houses - no bedrooms (%)
Bedrooms in renter-occupied houses - 1 bedroom (%)
Bedrooms in renter-occupied houses - 2 bedrooms (%)
Bedrooms in renter-occupied houses - 3 bedrooms (%)
Bedrooms in renter-occupied houses - 4 bedrooms (%)
Bedrooms in renter-occupied houses - 5+ bedrooms (%)
Vehicles available in owner-occupied houses - no vehicle available (%)
Vehicles available in owner-occupied houses - 1 vehicle available(%)
Vehicles available in owner-occupied houses - 2 Vehicles available (%)
Vehicles available in owner-occupied houses - 3 Vehicles available (%)
Vehicles available in owner-occupied houses - 4 Vehicles available (%)
Vehicles available in owner-occupied houses - 5+ Vehicles available (%)
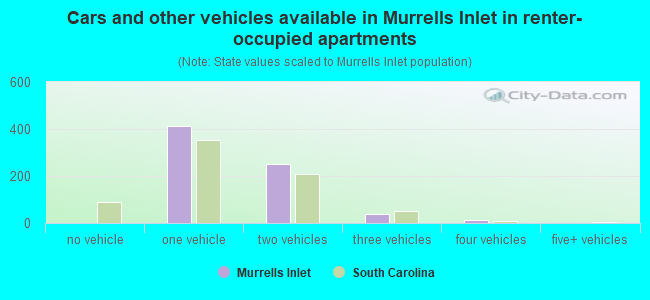
Vehicles available in renter-occupied houses - no vehicle available (%)
Vehicles available in renter-occupied houses - 1 vehicle available (%)
Vehicles available in renter-occupied houses - 2 Vehicles available (%)
Vehicles available in renter-occupied houses - 3 Vehicles available (%)
Vehicles available in renter-occupied houses - 4 Vehicles available (%)
Vehicles available in renter-occupied houses - 5+ Vehicles available (%)
Housing units in structures - 1, detached (%)
Housing units in structures - 1, attached (%)
Housing units in structures - 2 (%)
Housing units in structures - 3 or 4 (%)
Housing units in structures - 5 to 9 (%)
Housing units in structures - 10 to 19 (%)
Housing units in structures - 20 to 49 (%)
Housing units in structures - 50 or more (%)
Housing units in structures - Mobile home (%)
Housing units in structures - Boat, RV, van, etc. (%)
Housing units in structures - Owners - 1, detached (%)
Housing units in structures - Owners - 1, attached (%)
Housing units in structures - Owners - 2 (%)
Housing units in structures - Owners - 3 or 4 (%)
Housing units in structures - Owners - 5 to 9 (%)
Housing units in structures - Owners - 10 to 19 (%)
Housing units in structures - Owners - 20 to 49 (%)
Housing units in structures - Owners - 50 or more (%)
Housing units in structures - Owners - Mobile home (%)
Housing units in structures - Owners - Boat, RV, van, etc. (%)
Housing units in structures - Renters - 1, detached (%)
Housing units in structures - Renters - 1, attached (%)
Housing units in structures - Renters - 2 (%)
Housing units in structures - Renters - 3 or 4 (%)
Housing units in structures - Renters - 5 to 9 (%)
Housing units in structures - Renters - 10 to 19 (%)
Housing units in structures - Renters - 20 to 49 (%)
Housing units in structures - Renters - 50 or more (%)
Housing units in structures - Renters - Mobile home (%)
Housing units in structures - Renters - Boat, RV, van, etc. (%)
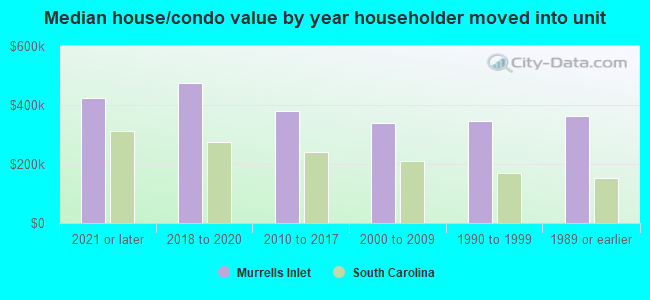
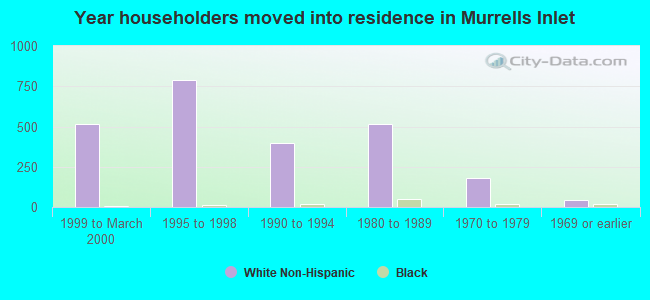
House/condo owner moved in on average (years ago)
Renter moved in on average (years ago)
Year householder moved into unit - Moved in 1999 to March 2000 (%)
Year householder moved into unit - Moved in 1999 to March 2000 (%) - White
Year householder moved into unit - Moved in 1999 to March 2000 (%) - Black or African American
Year householder moved into unit - Moved in 1999 to March 2000 (%) - Asian
Year householder moved into unit - Moved in 1999 to March 2000 (%) - Hispanic or Latino
Year householder moved into unit - Moved in 1999 to March 2000 (%) - American Indian and Alaska Native
Year householder moved into unit - Moved in 1999 to March 2000 (%) - Multirace
Year householder moved into unit - Moved in 1999 to March 2000 (%) - Other Race
Year householder moved into unit - Moved in 1995 to 1998 (%)
Year householder moved into unit - Moved in 1995 to 1998 (%) - White
Year householder moved into unit - Moved in 1995 to 1998 (%) - Black or African American
Year householder moved into unit - Moved in 1995 to 1998 (%) - Asian
Year householder moved into unit - Moved in 1995 to 1998 (%) - Hispanic or Latino
Year householder moved into unit - Moved in 1995 to 1998 (%) - American Indian and Alaska Native
Year householder moved into unit - Moved in 1995 to 1998 (%) - Multirace
Year householder moved into unit - Moved in 1995 to 1998 (%) - Other Race
Year householder moved into unit - Moved in 1990 to 1994 (%)
Year householder moved into unit - Moved in 1990 to 1994 (%) - White
Year householder moved into unit - Moved in 1990 to 1994 (%) - Black or African American
Year householder moved into unit - Moved in 1990 to 1994 (%) - Asian
Year householder moved into unit - Moved in 1990 to 1994 (%) - Hispanic or Latino
Year householder moved into unit - Moved in 1990 to 1994 (%) - American Indian and Alaska Native
Year householder moved into unit - Moved in 1990 to 1994 (%) - Multirace
Year householder moved into unit - Moved in 1990 to 1994 (%) - Other Race
Year householder moved into unit - Moved in 1980 to 1989 (%)
Year householder moved into unit - Moved in 1980 to 1989 (%) - White
Year householder moved into unit - Moved in 1980 to 1989 (%) - Black or African American
Year householder moved into unit - Moved in 1980 to 1989 (%) - Asian
Year householder moved into unit - Moved in 1980 to 1989 (%) - Hispanic or Latino
Year householder moved into unit - Moved in 1980 to 1989 (%) - American Indian and Alaska Native
Year householder moved into unit - Moved in 1980 to 1989 (%) - Multirace
Year householder moved into unit - Moved in 1980 to 1989 (%) - Other Race
Year householder moved into unit - Moved in 1970 to 1979 (%)
Year householder moved into unit - Moved in 1970 to 1979 (%) - White
Year householder moved into unit - Moved in 1970 to 1979 (%) - Black or African American
Year householder moved into unit - Moved in 1970 to 1979 (%) - Asian
Year householder moved into unit - Moved in 1970 to 1979 (%) - Hispanic or Latino
Year householder moved into unit - Moved in 1970 to 1979 (%) - American Indian and Alaska Native
Year householder moved into unit - Moved in 1970 to 1979 (%) - Multirace
Year householder moved into unit - Moved in 1970 to 1979 (%) - Other Race
Year householder moved into unit - Moved in 1969 or earlier (%)
Year householder moved into unit - Moved in 1969 or earlier (%) - White
Year householder moved into unit - Moved in 1969 or earlier (%) - Black or African American
Year householder moved into unit - Moved in 1969 or earlier (%) - Asian
Year householder moved into unit - Moved in 1969 or earlier (%) - Hispanic or Latino
Year householder moved into unit - Moved in 1969 or earlier (%) - American Indian and Alaska Native
Year householder moved into unit - Moved in 1969 or earlier (%) - Multirace
Year householder moved into unit - Moved in 1969 or earlier (%) - Other Race
Housing units lacking complete plumbing facilities (%)
Housing units lacking complete kitchen facilities (%)
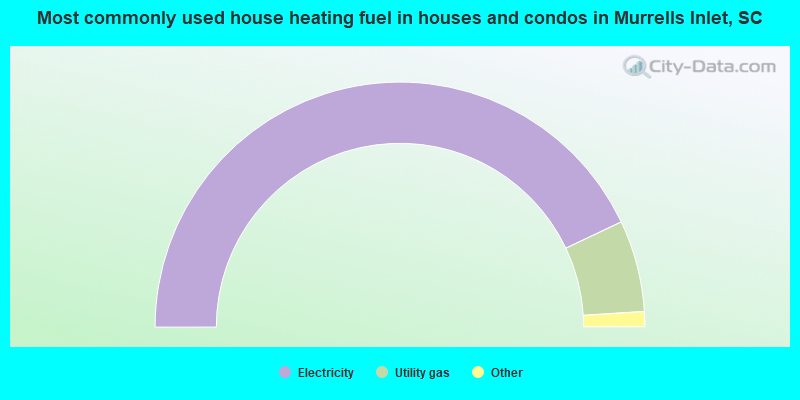
House heating fuel used in houses and condos - Utility gas (%)
House heating fuel used in houses and condos - Bottled, tank, or LP gas (%)
House heating fuel used in houses and condos - Electricity (%)
House heating fuel used in houses and condos - Fuel oil, kerosene, etc. (%)
House heating fuel used in houses and condos - Coal or coke (%)
House heating fuel used in houses and condos - Wood (%)
House heating fuel used in houses and condos - Solar energy (%)
House heating fuel used in houses and condos - Other fuel (%)
House heating fuel used in houses and condos - No fuel used (%)
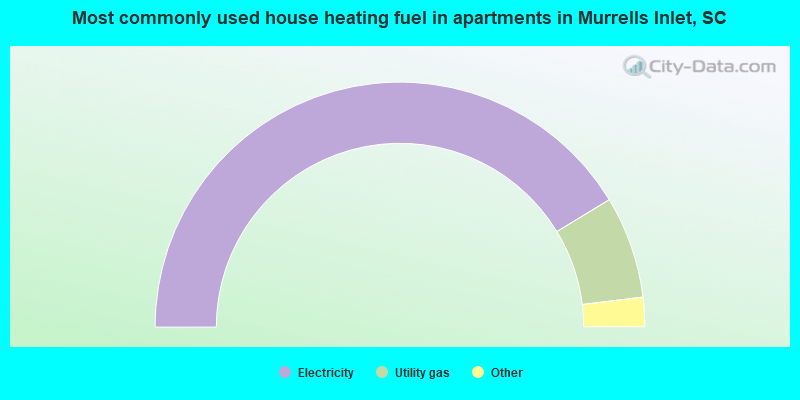
House heating fuel used in apartments - Utility gas (%)
House heating fuel used in apartments - Bottled, tank, or LP gas (%)
House heating fuel used in apartments - Electricity (%)
House heating fuel used in apartments - Fuel oil, kerosene, etc. (%)
House heating fuel used in apartments - Coal or coke (%)
House heating fuel used in apartments - Wood (%)
House heating fuel used in apartments - Solar energy (%)
House heating fuel used in apartments - Other fuel (%)
House heating fuel used in apartments - No fuel used (%)
Median year house/condo built: 2004Median year apartment built: 1999Household type by relationship:
Households: 10,577
Male householders: 2,426 (519 living alone ), Female householders: 2,274 (657 living alone )2,827 spouses (2,811 opposite-sex spouses ), 258 unmarried partners , (243 opposite-sex unmarried partners ), 1,980 children (1,769 natural , 34 adopted , 175 stepchildren ), 163 grandchildren , 245 brothers or sisters , 93 parents , 0 foster children , 51 other relatives , 247 non-relatives In group quarters: 8
Size of family households: 2,440 2-persons , 563 3-persons , 370 4-persons , 28 5-persons , 21 6-persons .
Size of nonfamily households: 1,196 1-person , 244 2-persons , 11 3-persons .
699 married couples with children. single-parent households (0 men , 223 women ).
95.8% of residents of Murrells Inlet speak English at home. of residents speak Spanish at home (94% speak English very well , 6% speak English well ).of residents speak other Indo-European language at home (83% speak English very well , 17% speak English well ).of residents speak Asian or Pacific Island language at home (91% speak English very well , 9% speak English well ).
Foreign born population: 588 (5.6%)of them are naturalized citizens )
Median number of rooms in houses and condos:
Median number of rooms in apartments
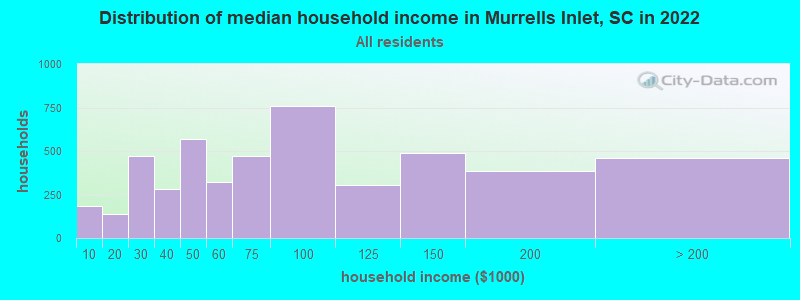
Murrells Inlet, SC household income distribution 184 Less than $10,000140 $10,000 to $19,999470 $20,000 to $29,999281 $30,000 to $39,999568 $40,000 to $49,999323 $50,000 to $59,999474 $60,000 to $74,999758 $75,000 to $99,999302 $100,000 to $124,999489 $125,000 to $149,999383 $150,000 to $199,999457 $200,000 or more
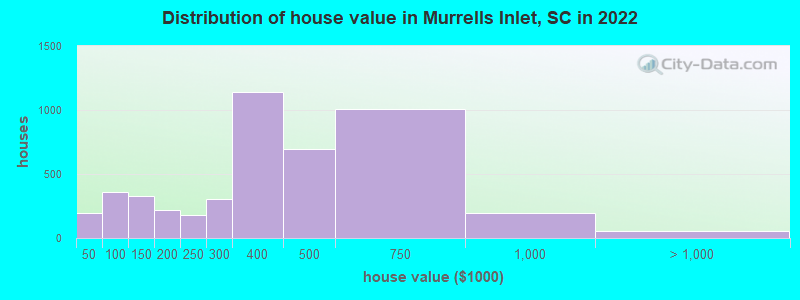
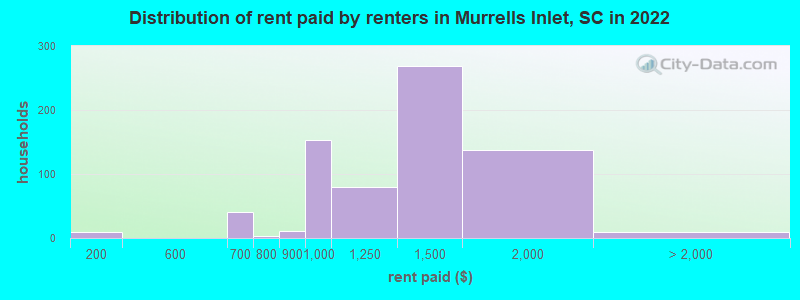
Home value of owner - occupied houses in 2022 in Murrells Inlet, SC 33 Less than $10,00028 $10,000 to $14,99961 $15,000 to $19,9999 $25,000 to $29,99918 $30,000 to $34,99947 $40,000 to $49,99960 $50,000 to $59,99960 $60,000 to $69,999136 $70,000 to $79,99951 $80,000 to $89,999134 $100,000 to $124,999196 $125,000 to $149,999173 $150,000 to $174,99944 $175,000 to $199,999177 $200,000 to $249,999301 $250,000 to $299,9991,142 $300,000 to $399,999696 $400,000 to $499,9991,005 $500,000 to $749,999192 $750,000 to $999,99941 $1,000,000 to $1,499,9999 $2,000,000 or moreRent paid by renters in 2022 in Murrells Inlet, SC 10 $150 to $19930 $600 to $6499 $650 to $6992 $700 to $74911 $800 to $899152 $900 to $99978 $1,000 to $1,249268 $1,250 to $1,499136 $1,500 to $1,9998 No cash rent
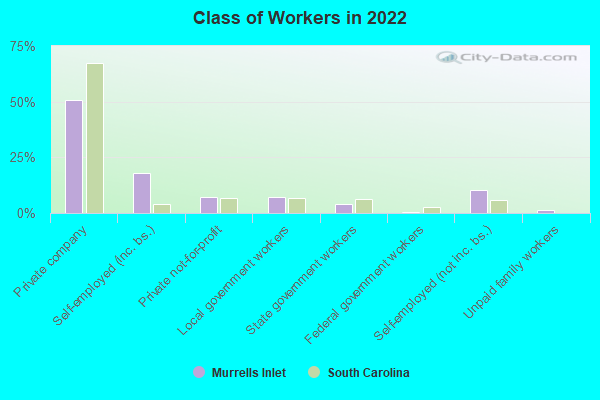
Percentage of workers working in this county: 64.8%Number of people working at home: 714 (15.6% of all workers )
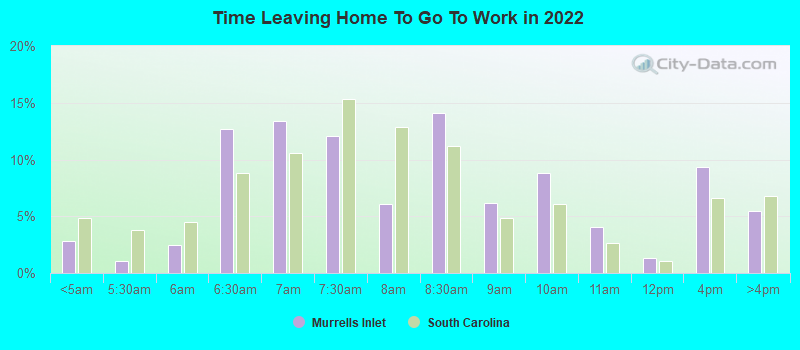
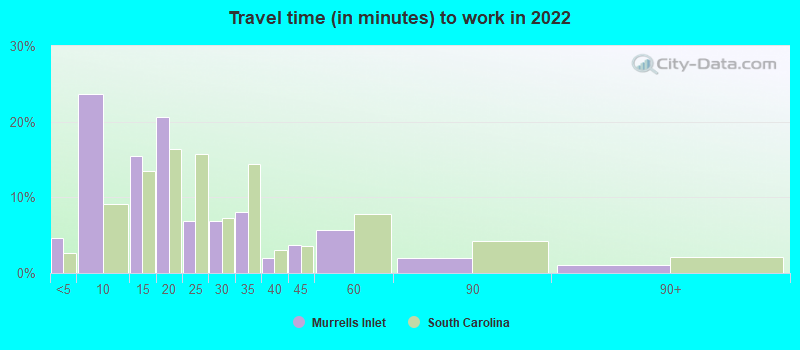
Travel time to work (commute)
Less than 5 minutes: 2585 to 9 minutes: 73410 to 14 minutes: 40615 to 19 minutes: 79820 to 24 minutes: 60825 to 29 minutes: 18530 to 34 minutes: 27335 to 39 minutes: 17740 to 44 minutes: 23145 to 59 minutes: 15860 to 89 minutes: 2590 or more minutes: 51
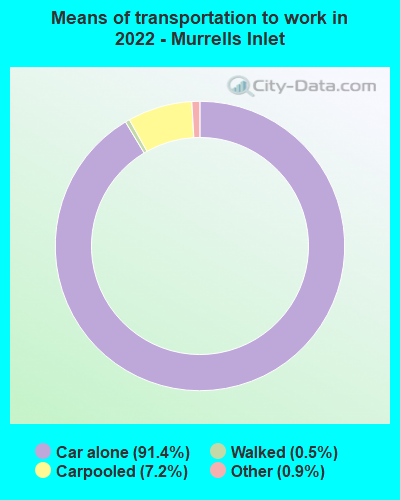
Means of transportation to work:
Drove a car alone: 4,182 (79.2%)Carpooled: 345 (6.5%)Taxi: 43 (0.8%)Walked: 21 (0.4%)Worked at home: 714 (13.5%)
Unemployment by race in 2022
Unemployment rate for White non-Hispanic residents 2.4% Males1.8% FemalesUnemployment rate for Black residents 2.9% MalesUnemployment rate for other race residents 20.5% MalesUnemployment rate for Hispanic or Latino residents 5.7% Males
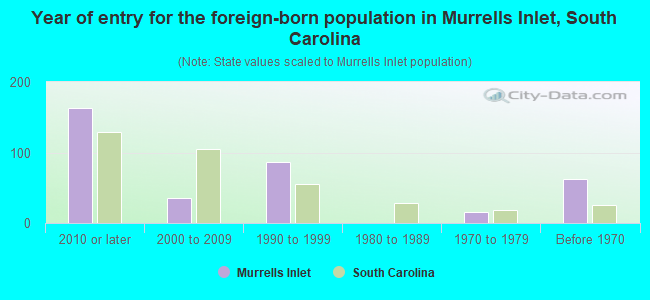
Year of entry for the foreign-born population in Murrells Inlet, South Carolina
163 2010 or later 35 2000 to 2009 86 1990 to 1999 0 1980 to 1989 15 1970 to 1979 62 Before 1970
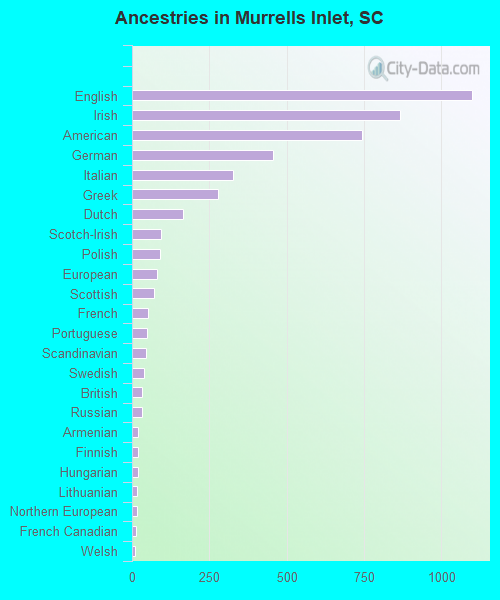
First ancestries reported:
English: 1,099 (20.3%)
Irish: 866 (16.0%)
American: 744 (13.8%)
German: 457 (8.5%)
Italian: 327 (6.1%)
Greek: 279 (5.2%)
Dutch: 166 (3.1%)
Scotch-Irish: 93 (1.7%)
Polish: 89 (1.6%)
European: 82 (1.5%)
Scottish: 70 (1.3%)
French: 53 (1.0%)
Portuguese: 47 (0.9%)
Scandinavian: 45 (0.8%)
Swedish: 40 (0.7%)
British: 32 (0.6%)
Russian: 31 (0.6%)
Armenian: 21 (0.4%)
Finnish: 20 (0.4%)
Hungarian: 19 (0.4%)
Lithuanian: 17 (0.3%)
Northern European: 16 (0.3%)
French Canadian: 12 (0.2%)
Welsh: 11 (0.2%)
Canadian: 9 (0.2%)
Austrian: 7 (0.1%)
Czechoslovakian: 7 (0.1%)
African: 5 (0.09%)
Danish: 4 (0.07%) Most common places of birth for foreign-born residents (%): Cuba Murrells Inlet:
31.1% (183)South Carolina:
1.5% (3,987)
Greece Murrells Inlet:
11.4% (67)South Carolina:
0.5% (1,296)
Korea Murrells Inlet:
9.7% (57)South Carolina:
1.7% (4,513)
China, excluding Hong Kong and Taiwan Murrells Inlet:
9.4% (55)South Carolina:
3.2% (8,721)
Germany Murrells Inlet:
8.7% (51)South Carolina:
3.7% (9,982)
England Murrells Inlet:
7.5% (44)South Carolina:
1.9% (5,117)
Canada Murrells Inlet:
5.1% (30)South Carolina:
3.0% (8,193)
Mexico Murrells Inlet:
3.1% (18)South Carolina:
22.5% (60,774)
United Kingdom, excluding England and Scotland Murrells Inlet:
2.9% (17)South Carolina:
1.2% (3,296)
Poland Murrells Inlet:
2.2% (13)South Carolina:
0.6% (1,691)
Costa Rica Murrells Inlet:
2.2% (13)South Carolina:
0.5% (1,395)
Lithuania Murrells Inlet:
1.5% (9)South Carolina:
0.0% (92)
Place of birth for U.S.-born residents:
This state: 3,418Other state: 6,565Northeast: 3,519Midwest: 701South: 2,020West: 347 84.6% of Murrells Inlet residents lived in the same house 1 years ago.
Out of people who lived in different houses, 16.6% lived in this county.
Out of people who lived in different counties, 35.7% lived in South Carolina.
Murrells Inlet:
84.6%State average:
86.5%
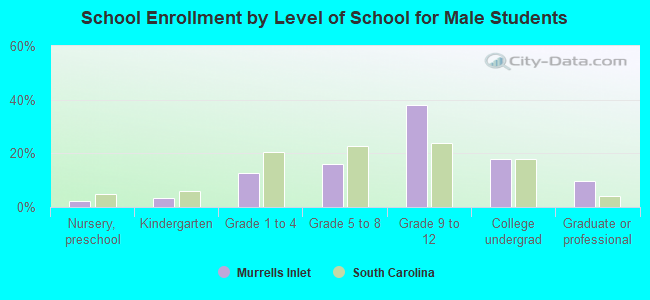
Education attainment for males 25 years and older:
No schooling: 0Nursery to 4th grade: 05th and 6th grade: 07th and 8th grade: 159th grade: 1210th grade: 2411th grade: 11012th grade, no diploma: 35High school graduate (or equivalency): 1,075Less than 1 year of college: 204Some college more than 1 year, no degree: 543Associate degree: 351Bachelor's degree: 1,267Master's degree: 352Professional school degree: 341Doctorate degree: 78
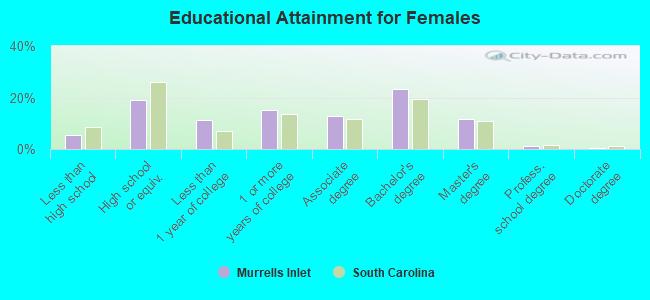
Education attainment for females 25 years and older:
No schooling: 5Nursery to 4th grade: 05th and 6th grade: 07th and 8th grade: 09th grade: 010th grade: 12511th grade: 2412th grade, no diploma: 105High school graduate (or equivalency): 895Less than 1 year of college: 531Some college more than 1 year, no degree: 716Associate degree: 601Bachelor's degree: 1,093Master's degree: 548Professional school degree: 55Doctorate degree: 12
Housing units in structures:
One, detached: 3,151One, attached: 460Two: 213 or 4: 1185 to 9: 67410 to 19: 8720 to 49: 3950 or more: 20Mobile homes: 1,119Median worth of mobile homes: $83,652
Housing units lacking complete plumbing facilities in 2022: 1.3%Housing units lacking complete kitchen facilities in 2022: 1.3%House/condo owner moved in on average 7 years ago
Renter moved in on average 0 years ago
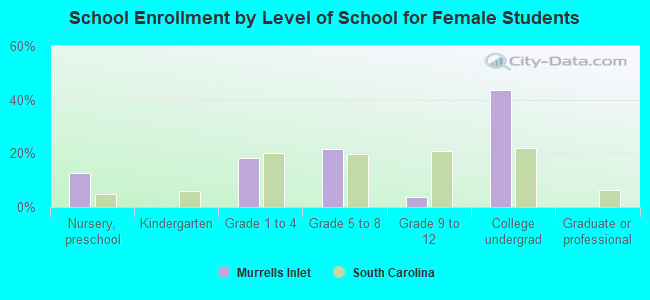
Private vs. public school enrollment:
Students in private schools in grades 1 to 8 (elementary and middle school): 85 Here:
16.1%South Carolina:
14.4%
Students in private schools in grades 9 to 12 (high school): 154 Here:
32.9%South Carolina:
11.1%
Students in private undergraduate colleges: 0 Here:
0.0%South Carolina:
21.9%