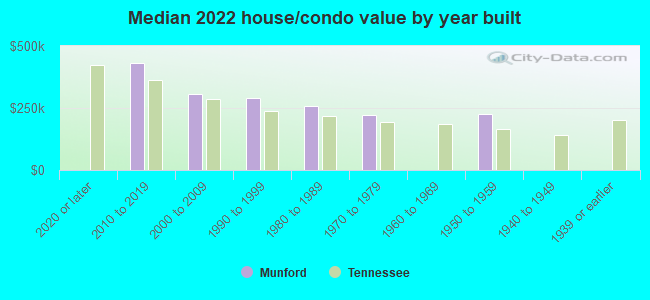
Munford, TN (Tennessee) Houses and Residents
| Munford: | $263,695 |
| Tennessee: | $284,800 |
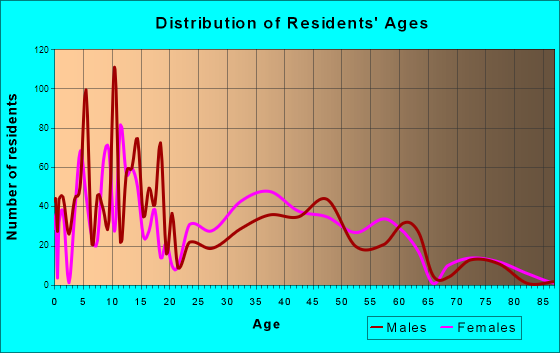
Total population: 6,055 (Urban population: 3,037 (all inside urban clusters), Rural population: 1,748 (all nonfarm))
Houses: 2,464 (2,176 occupied: 1,717 owner occupied, 498 renter occupied)
| % of renters here: | 22% |
| State: | 33% |
Housing density: 306 houses/condos per square mile
Median price asked for vacant for-sale houses and condos in 2022 in this county: $135,704.
Median contract rent in 2022: $1,028 (lower quartile is $766, upper quartile is $1,182)
Median rent asked for vacant for-rent units in 2022: $2,223
Median gross rent in Munford, TN in 2022: $1,169
Housing units in Munford with a mortgage: 1,328 (33 second mortgage, 0 home equity loan, 33 both second mortgage and home equity loan)
Houses without a mortgage: 0
Median household income for houses/condos with a mortgage: $110,785
Median household income for apartments without a mortgage: $101,166
Median monthly housing costs: $1,308
Compare current foreclosures in Munford, TN:
| Photo | Address | Area | Beds / Baths | Price | Details |
|---|---|---|---|---|---|

|
#1
Elsberry St
Munford, TN 38058
|
2,174 sq. feet
|
2 baths - beds |
show details | |

|
#2
N Gretna Green Dr
Munford, TN 38058
|
2,423 sq. feet
|
2 baths - beds |
show details | |

|
#3
Kathleen Dr
Munford, TN 38058
|
1,510 sq. feet
|
2 baths - beds |
show details | |

|
#4
Ruth Shankle Dr
Munford, TN 38058
|
2,279 sq. feet
|
2 baths - beds |
show details | |

|
#5
Fleming Dr
Munford, TN 38058
|
1,354 sq. feet
|
2 baths - beds |
show details | |

|
#6
Campground Rd
Munford, TN 38058
|
2,280 sq. feet
|
2 baths - beds |
show details | |

|
#7
Beaver Rd
Munford, TN 38058
|
1,193 sq. feet
|
2 baths - beds |
show details | |

|
#8
Walker Field Rd
Munford, TN 38058
|
1,456 sq. feet
|
2 baths - beds |
show details | |

|
#9
Egypt Rd
Munford, TN 38058
|
2,387 sq. feet
|
2 baths - beds |
show details | |

|
#10
Laurel Ln
Munford, TN 38058
|
1,284 sq. feet
|
2 baths - beds |
show details |
| Photo | Address | Area | Beds / Baths | Price | Details |
|---|---|---|---|---|---|

|
#11
Parkwood Ln
Munford, TN 38058
|
1,286 sq. feet
|
2 baths - beds |
show details | |

|
#12
Kathleen Dr
Munford, TN 38058
|
1,546 sq. feet
|
2 baths - beds |
show details | |

|
#13
Buford Rd W
Munford, TN 38058
|
1,346 sq. feet
|
2 baths - beds |
show details | |

|
#14
Plantation Ln
Munford, TN 38058
|
1,534 sq. feet
|
2 baths - beds |
show details | |

|
#15
Karen St
Munford, TN 38058
|
1,438 sq. feet
|
2 baths - beds |
show details | |

|
#16
Munford Giltedge Rd
Munford, TN 38058
|
1,123 sq. feet
|
2 baths - beds |
show details | |

|
#17
Maple Hill Dr
Munford, TN 38058
|
1,435 sq. feet
|
2 baths - beds |
show details | |

|
#18
Fite Rd
Munford, TN 38058
|
1,836 sq. feet
|
2 baths - beds |
show details | |

|
#19
Boardwalk St
Munford, TN 38058
|
1,407 sq. feet
|
2 baths - beds |
show details | |

|
#20
Charles Ave
Munford, TN 38058
|
1,957 sq. feet
|
2 baths - beds |
show details |
| Photo | Address | Area | Beds / Baths | Price | Details |
|---|---|---|---|---|---|

|
#21
Education Ave
Munford, TN 38058
|
2,171 sq. feet
|
2 baths - beds |
show details | |

|
#22
Mattie Ann Ln
Munford, TN 38058
|
896 sq. feet
|
1 baths - beds |
show details | |

|
#23
Rachel Shankle Dr
Munford, TN 38058
|
3,085 sq. feet
|
3 baths - beds |
show details | |

|
#24
Pw Reed Dr
Munford, TN 38058
|
3,043 sq. feet
|
3 baths - beds |
show details | |

|
#25
Connecticut Ave
Munford, TN 38058
|
1,306 sq. feet
|
2 baths - beds |
show details | |

|
#26
Chance St
Munford, TN 38058
|
1,392 sq. feet
|
2 baths - beds |
show details | |

|
#27
Beaver Rd
Munford, TN 38058
|
1,418 sq. feet
|
1 baths - beds |
show details | |

|
#28
Rolling Oaks Dr
Munford, TN 38058
|
1,140 sq. feet
|
1 baths - beds |
show details | |

|
#29
Nancye Reeder Dr
Munford, TN 38058
|
1,424 sq. feet
|
2 baths - beds |
show details | |

|
#30
Wooten Ave
Munford, TN 38058
|
- sq. feet
|
- baths - beds |
show details |
| Photo | Address | Area | Beds / Baths | Price | Details |
|---|---|---|---|---|---|

|
#31
Lawrence Cv
Munford, TN 38058
|
- sq. feet
|
- baths - beds |
show details | |

|
#32
Frances Ln
Munford, TN 38058
|
- sq. feet
|
- baths - beds |
show details | |

|
#33
S Meadows Cv
Munford, TN 38058
|
- sq. feet
|
- baths - beds |
show details | |

|
#34
S Meadows Cv
Munford, TN 38058
|
- sq. feet
|
- baths - beds |
show details | |

|
#35
Campground Rd
Munford, TN 38058
|
- sq. feet
|
- baths - beds |
show details | |

|
#36
Navy Cir
Munford, TN 38058
|
- sq. feet
|
- baths - beds |
show details | |

|
#37
New York Ave
Munford, TN 38058
|
- sq. feet
|
- baths - beds |
show details | |

|
#38
Walker Field Ln
Munford, TN 38058
|
- sq. feet
|
- baths - beds |
show details | |

|
Check over 1 million property listings on Foreclosure.com!
|
browse all offers | |||

Latest news about housing in Munford, TN collected exclusively by city-data.com from local newspapers, TV, and radio stations

 | Apartments in Munford? (4 replies) |
| Apartments within close commute of Millington? (37 replies) |
| Brighton or Munford Schools? (3 replies) |
| Most likely moving to Memphis next summer! (57 replies) |
| Navy move to Millington--where to buy a house as a short-term investment? (16 replies) |
| Single Mom thinking of relocating Memphis Suburbs (12 replies) |
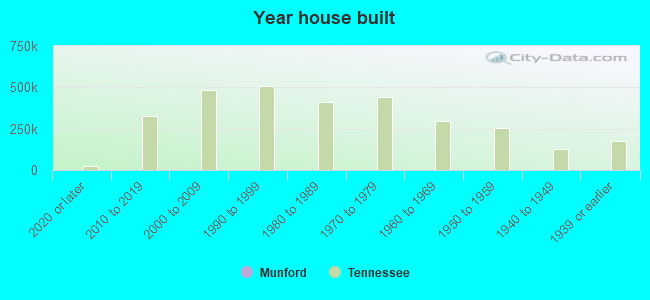
Median year apartment built: 1991
Household type by relationship:
Households: 6,474- Male householders: 1,353 (203 living alone), Female householders: 797 (135 living alone)
1,349 spouses (1,343 opposite-sex spouses), 162 unmarried partners, (162 opposite-sex unmarried partners), 2,362 children (2,202 natural, 70 adopted, 89 stepchildren), 144 grandchildren, 49 brothers or sisters, 131 parents, 0 foster children, 19 other relatives, 102 non-relatives
Size of family households: 616 2-persons, 359 3-persons, 403 4-persons, 178 5-persons, 42 6-persons, 74 7-or-more-persons.
Size of nonfamily households: 345 1-person, 204 2-persons.
1,559 married couples with children.
164 single-parent households (85 men, 79 women).
94.7% of residents of Munford speak English at home.
1.3% of residents speak Spanish at home (100% speak English very well).
1.9% of residents speak other Indo-European language at home (100% speak English very well).
1.6% of residents speak Asian or Pacific Island language at home (79% speak English very well, 21% speak English well).
Foreign born population: 147 (2.3%)
(65.3% of them are naturalized citizens)
| Here: | 7.2 |
| State: | 6.5 |
| Here: | 5.2 |
| State: | 4.4 |
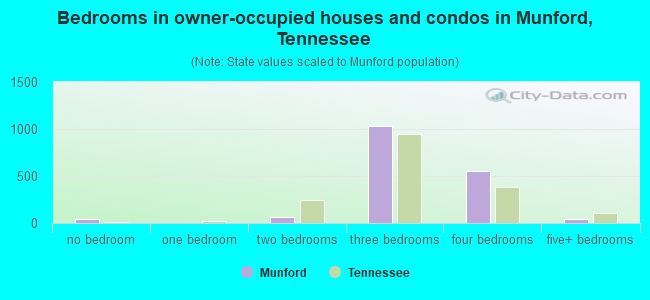
- Bedrooms in owner-occupied houses and condos in Munford, Tennessee
- 38no bedroom
- 01 bedroom
- 622 bedrooms
- 1,0323 bedrooms
- 5484 bedrooms
- 385+ bedrooms
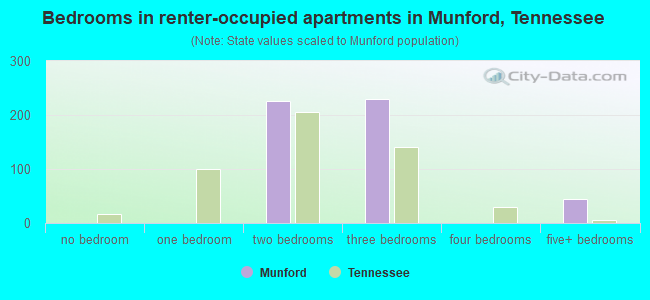
- Bedrooms in renter-occupied apartments in Munford, Tennessee
- 0no bedroom
- 01 bedroom
- 2262 bedrooms
- 2293 bedrooms
- 04 bedrooms
- 445+ bedrooms
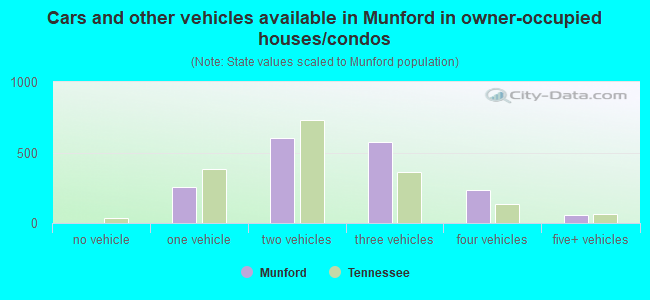
- Cars and other vehicles available in Munford in owner-occupied houses/condos
- 0no vehicle
- 2581 vehicle
- 6022 vehicles
- 5713 vehicles
- 2314 vehicles
- 565+ vehicles
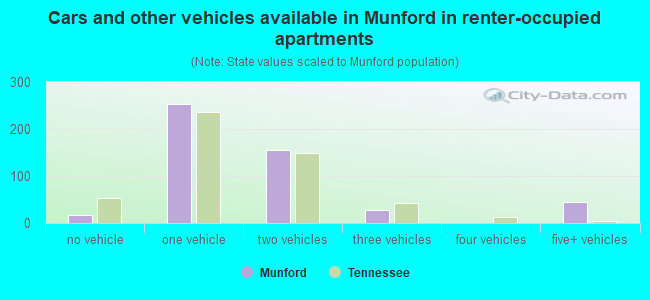
- Cars and other vehicles available in Munford in renter-occupied apartments
- 18no vehicle
- 2531 vehicle
- 1552 vehicles
- 283 vehicles
- 04 vehicles
- 445+ vehicles
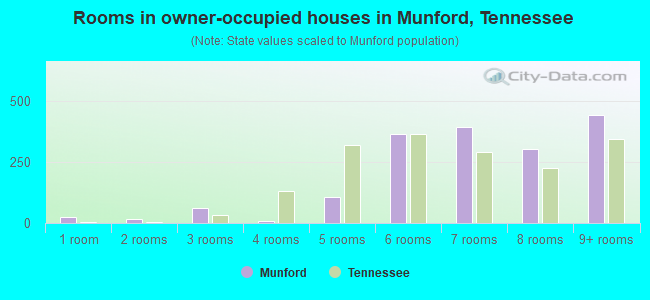
- Rooms in owner-occupied houses in Munford, Tennessee
- 231 room
- 152 rooms
- 623 rooms
- 84 rooms
- 1085 rooms
- 3636 rooms
- 3947 rooms
- 3018 rooms
- 4439+ rooms
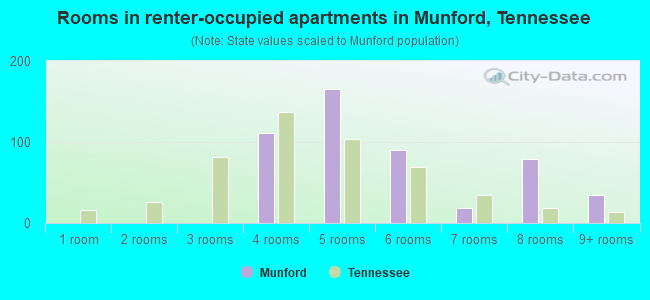
- Rooms in renter-occupied apartments in Munford, Tennessee
- 01 room
- 02 rooms
- 03 rooms
- 1114 rooms
- 1655 rooms
- 906 rooms
- 197 rooms
- 798 rooms
- 359+ rooms
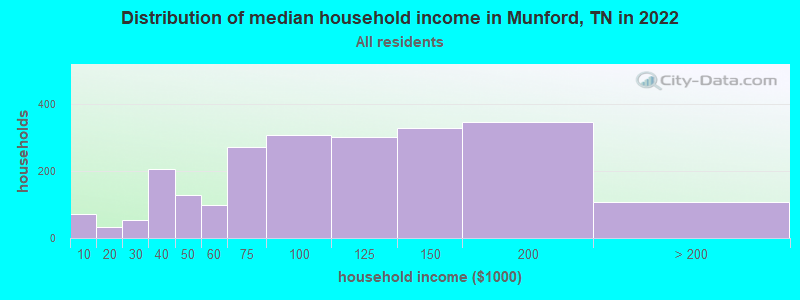
Munford, TN household income distribution

- 71Less than $10,000
- 34$10,000 to $19,999
- 53$20,000 to $29,999
- 206$30,000 to $39,999
- 128$40,000 to $49,999
- 97$50,000 to $59,999
- 272$60,000 to $74,999
- 306$75,000 to $99,999
- 300$100,000 to $124,999
- 327$125,000 to $149,999
- 346$150,000 to $199,999
- 107$200,000 or more
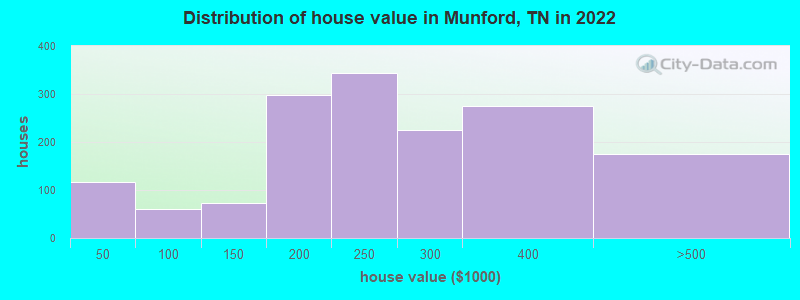
Home value of owner - occupied houses in 2022 in Munford, TN
-
- 24$10,000 to $14,999
- 56$15,000 to $19,999
- 35$25,000 to $29,999
- 32$50,000 to $59,999
- 28$90,000 to $99,999
- 71$125,000 to $149,999
- 141$150,000 to $174,999
- 154$175,000 to $199,999
- 343$200,000 to $249,999
- 223$250,000 to $299,999
- 275$300,000 to $399,999
- 176$400,000 to $499,999
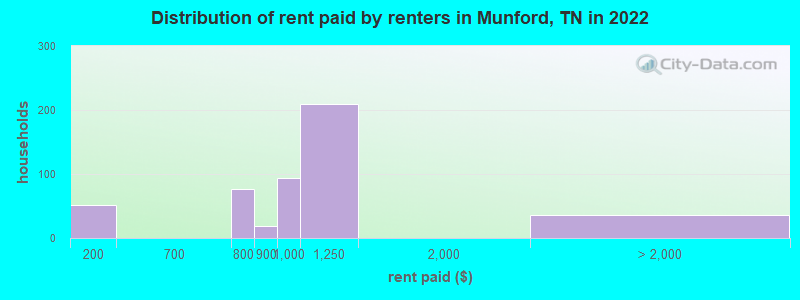
Rent paid by renters in 2022 in Munford, TN
-
- 52$150 to $199
- 77$700 to $749
- 18$800 to $899
- 93$900 to $999
- 208$1,000 to $1,249
- 35No cash rent
Percentage of workers working in this county: 31.3%
Number of people working at home: 344 (10.6% of all workers)
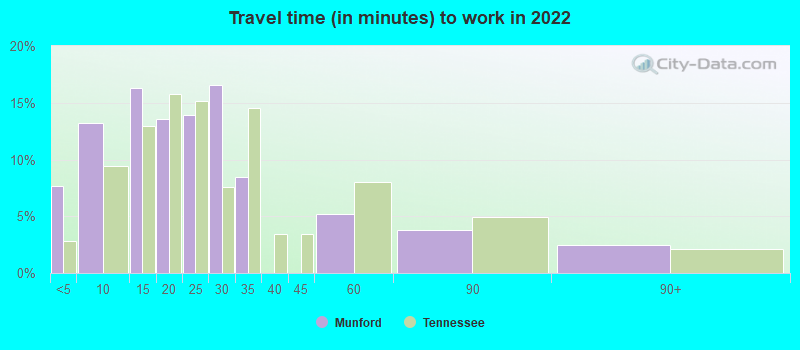
Travel time to work (commute)
- Less than 5 minutes: 130
- 5 to 9 minutes: 175
- 10 to 14 minutes: 299
- 15 to 19 minutes: 188
- 20 to 24 minutes: 411
- 25 to 29 minutes: 138
- 30 to 34 minutes: 280
- 35 to 39 minutes: 164
- 40 to 44 minutes: 205
- 45 to 59 minutes: 675
- 60 to 89 minutes: 125
- 90 or more minutes: 67
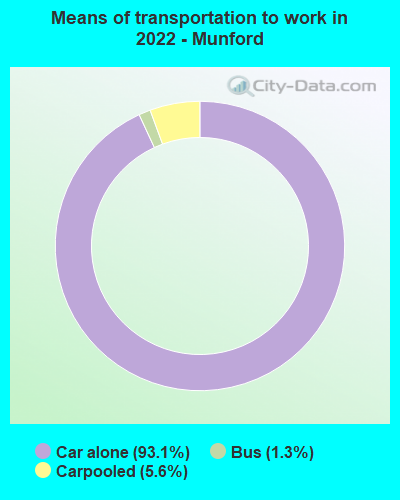
Means of transportation to work:
- Drove a car alone: 1,221 (75.0%)
- Carpooled: 78 (4.8%)
- Bus: 14 (0.9%)
- Worked at home: 344 (21.1%)
- Unemployment by race in 2022
- Unemployment rate for White non-Hispanic residents
- 2.3%Males
- 1.2%Females
- Unemployment rate for Black residents
- 47.2%Males
- 24.7%Females
- Unemployment rate for two or more race residents
- 10.3%Males
- Unemployment rate for Hispanic or Latino residents
- 25.5%Males
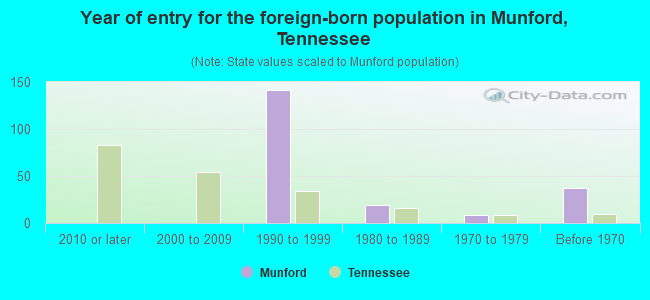
- Year of entry for the foreign-born population in Munford, Tennessee
- 02010 or later
- 02000 to 2009
- 1411990 to 1999
- 191980 to 1989
- 81970 to 1979
- 37Before 1970
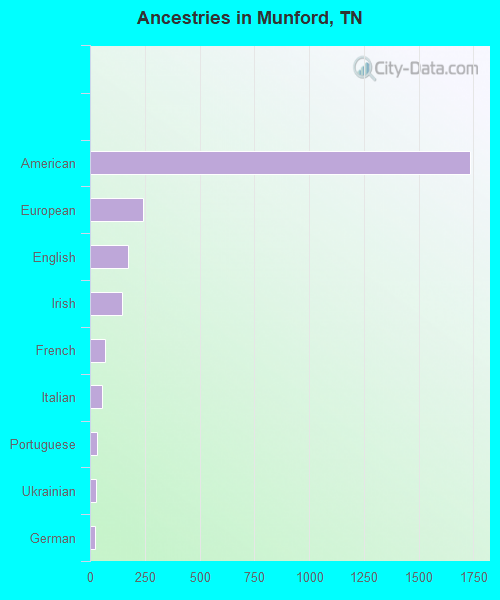
First ancestries reported:
- American: 1,735 (49.2%)
- European: 242 (6.9%)
- English: 175 (5.0%)
- Irish: 145 (4.1%)
- French: 69 (2.0%)
- Italian: 56 (1.6%)
- Portuguese: 30 (0.9%)
- Ukrainian: 27 (0.8%)
- German: 22 (0.6%)
- Scotch-Irish: 13 (0.4%)
- Polish: 11 (0.3%)
- Austrian: 7 (0.2%)
- British: 3 (0.09%)
Most common places of birth for foreign-born residents (%):
| Munford: | 74.8% (110) |
| Tennessee: | 3.1% (11,640) |
| Munford: | 24.5% (36) |
| Tennessee: | 0.2% (698) |
| Munford: | 5.4% (8) |
| Tennessee: | 23.0% (86,435) |
Place of birth for U.S.-born residents:
- This state: 3,768
- Other state: 2,358
- Northeast: 289
- Midwest: 445
- South: 1,187
- West: 455
95.1% of Munford residents lived in the same house 1 years ago.
Out of people who lived in different houses, 27.6% lived in this county.
Out of people who lived in different counties, 24.6% lived in Tennessee.
| Munford: | 95.1% |
| State average: | 87.0% |
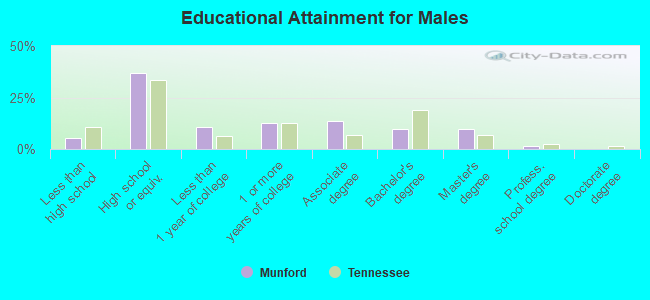
Education attainment for males 25 years and older:
- No schooling: 0
- Nursery to 4th grade: 0
- 5th and 6th grade: 0
- 7th and 8th grade: 0
- 9th grade: 0
- 10th grade: 38
- 11th grade: 73
- 12th grade, no diploma: 0
- High school graduate (or equivalency): 790
- Less than 1 year of college: 234
- Some college more than 1 year, no degree: 271
- Associate degree: 286
- Bachelor's degree: 208
- Master's degree: 209
- Professional school degree: 33
- Doctorate degree: 0
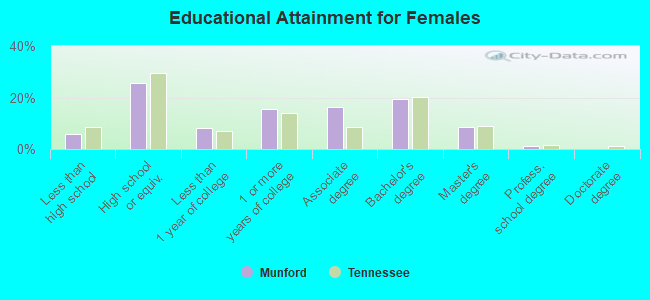
Education attainment for females 25 years and older:
- No schooling: 33
- Nursery to 4th grade: 0
- 5th and 6th grade: 0
- 7th and 8th grade: 0
- 9th grade: 17
- 10th grade: 59
- 11th grade: 0
- 12th grade, no diploma: 6
- High school graduate (or equivalency): 487
- Less than 1 year of college: 153
- Some college more than 1 year, no degree: 294
- Associate degree: 310
- Bachelor's degree: 369
- Master's degree: 166
- Professional school degree: 19
- Doctorate degree: 0
Housing units in structures:
- One, detached: 2,162
- 3 or 4: 84
- 5 to 9: 79
- Mobile homes: 123
- Boats, RVs, vans, etc.: 14
Housing units lacking complete kitchen facilities in 2022: 3.9%
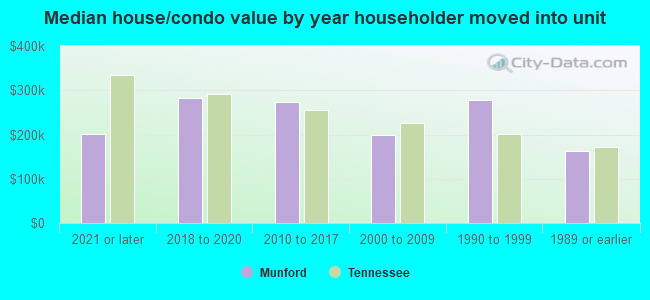
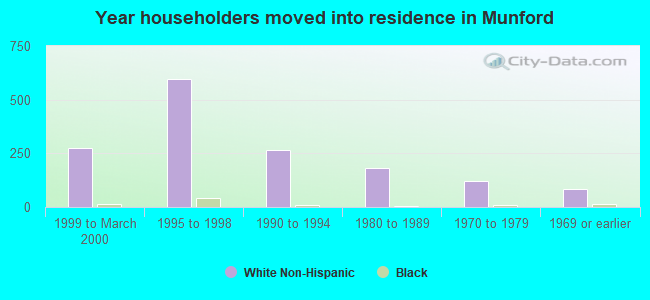
House/condo owner moved in on average 7 years ago
Renter moved in on average 3 years ago
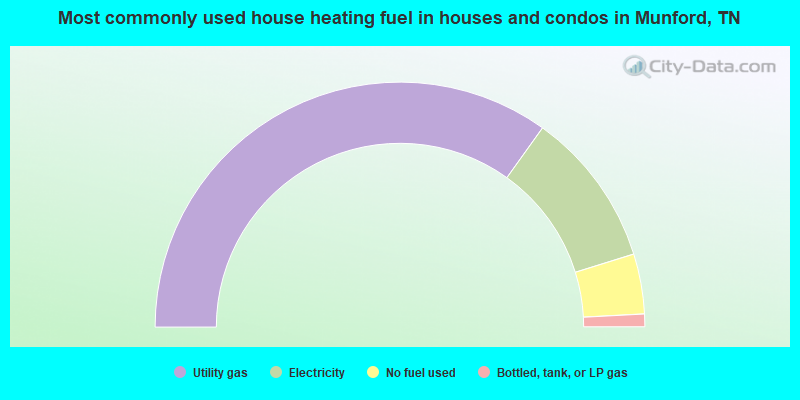
- 69.8%Utility gas
- 20.6%Electricity
- 7.9%No fuel used
- 1.7%Bottled, tank, or LP gas
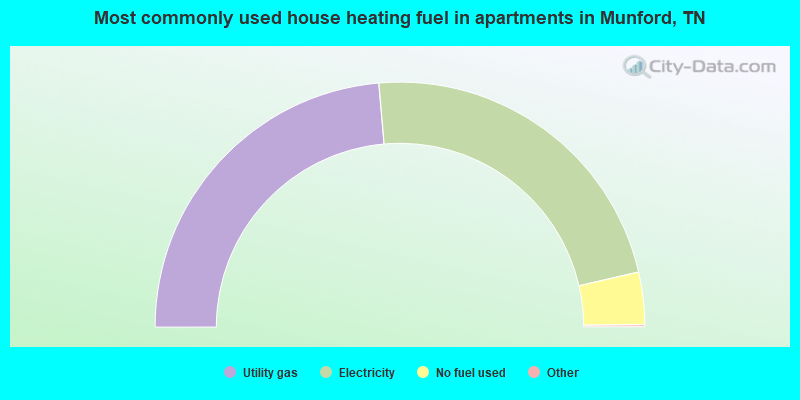
- 47.4%Utility gas
- 45.7%Electricity
- 6.9%No fuel used
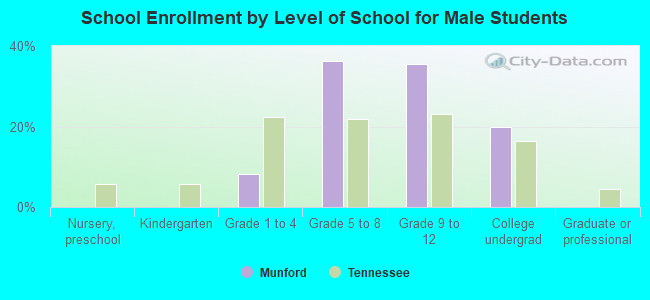
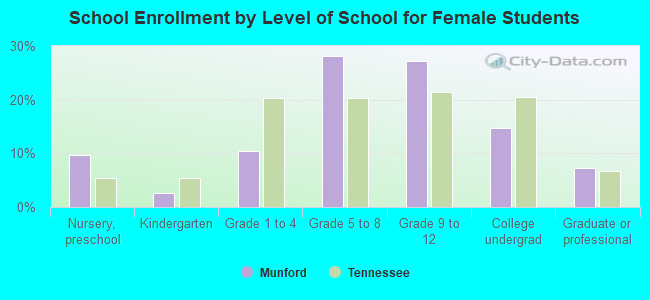
Private vs. public school enrollment:
| Here: | 0.0% |
| Tennessee: | 15.0% |
| Here: | 3.3% |
| Tennessee: | 16.2% |
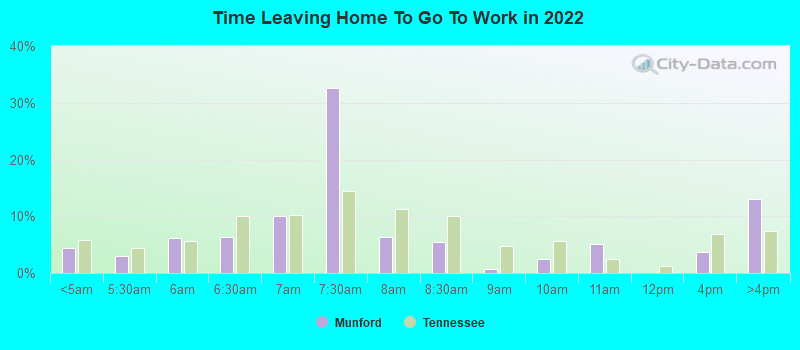
| Here: | 32.4% |
| Tennessee: | 23.5% |