Muncie, IN (Indiana) Houses and Residents
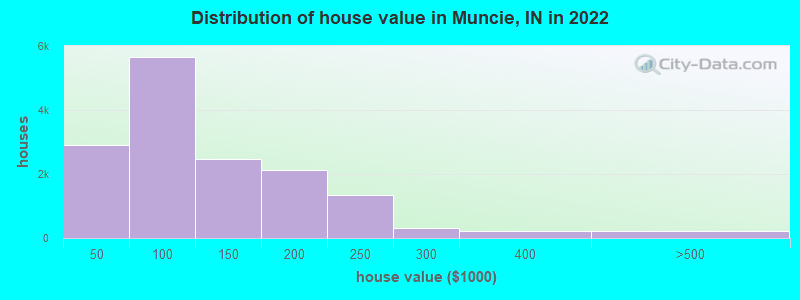
Estimated median house or condo value in 2022: $93,900 (it was $57,100 in 2000 )
Muncie:
$93,900Indiana:
$208,700
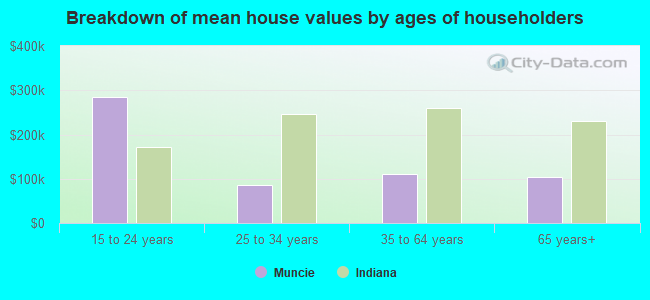
Lower value quartile - upper value quartile: $57,500 - $162,500Mean price in 2022: Detached houses: $135,413 Here:
$135,413State:
$257,916
Townhouses or other attached units: $148,349 Here:
$148,349State:
$224,114
In 2-unit structures: $151,156 Here:
$151,156State:
$175,375
In 3-to-4-unit structures: $174,884 Here:
$174,884State:
$151,116
In 5-or-more-unit structures: $204,964 Here:
$204,964State:
$200,844
Mobile homes: $37,571 Here:
$37,571State:
$67,116
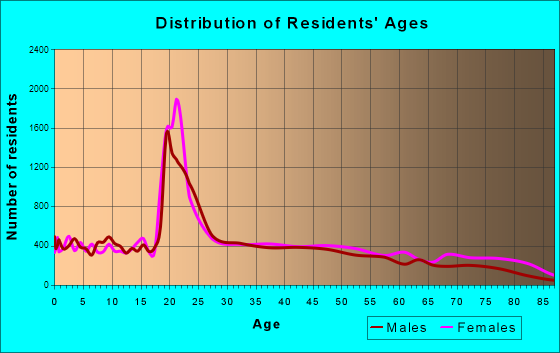
Total population: 70,211 (Urban population: 67,389, Rural population: 79 (all nonfarm) )
Houses: 30,826 (27,716 occupied: 14,113 owner occupied, 13,603 renter occupied )
% of renters here:
49%State:
29%
Housing density: 1,275 houses/condos per square mile
Median price asked for vacant for-sale houses and condos in 2022: $118,884.
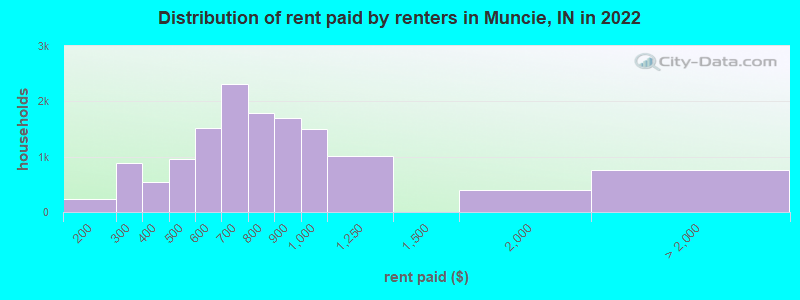
Median contract rent in 2022: $702 (lower quartile is $530, upper quartile is $888)
Median rent asked for vacant for-rent units in 2022: $753
Median gross rent in Muncie, IN in 2022: $864
Housing units in Muncie with a mortgage: 7,157 (573 second mortgage, 79 home equity loan, 431 both second mortgage and home equity loan )Houses without a mortgage: 307
Median household income for houses/condos with a mortgage: $77,705
Median household income for apartments without a mortgage: $46,917
Median monthly housing costs: $788
Data:
Median house or condo value ($)
Median house or condo value ($ change since 2000)
Median house or condo value ($) - White
Median house or condo value ($) - Black or African American
Median house or condo value ($) - Asian
Median house or condo value ($) - Hispanic or Latino
Median house or condo value ($) - American Indian and Alaska Native
Median house or condo value ($) - Multirace
Median house or condo value ($) - Other Race
Median price asked for mobile homes ($)
Household density (households per square mile)
Mean house or condo value by units in structure - 1, detached ($)
Mean house or condo value by units in structure - 1, attached ($)
Mean house or condo value by units in structure - 2 ($)
Mean house or condo value by units in structure by units in structure - 3 or 4 ($)
Mean house or condo value by units in structure - 5 or more ($)
Mean house or condo value by units in structure - Boat, RV, van, etc. ($)
Mean house or condo value by units in structure - Mobile home ($)
Median contract rent ($)
Median contract rent - Lower quartile ($)
Median contract rent - Upper quartile ($)
Median gross rent ($)
Urban houses (%)
Rural houses (%)
Houses occupied (%)
Houses occupied (% change since 2000)
Houses owner occupied (%)
Houses owner occupied (% change since 2000)
Houses renter occupied (%)
Houses renter occupied (% change since 2000)
Vacant housing units - For rent (%)
Vacant housing units - For rent (% change since 2000)
Vacant housing units - For sale only (%)
Vacant housing units - For sale only (% change since 2000)
Vacant housing units - Rented or sold, not occupied (%)
Vacant housing units - Rented or sold, not occupied (% change since 2000)
Vacant housing units - For seasonal, recreational, or occasional use (%)
Vacant housing units - For seasonal, recreational, or occasional use (% change since 2000)
Vacant housing units - For migrant workers (%)
Vacant housing units - For migrant workers (% change since 2000)
Vacant housing units - Other vacant (%)
Vacant housing units - Other vacant (% change since 2000)
Median monthly housing costs ($)
Median household income for houses/condos with a mortgage ($)
Median household income for houses/condos without a mortgage ($)
Median household income ($)
Median household income ($) - White
Median household income ($) - Black or African American
Median household income ($) - Asian
Median household income ($) - Hispanic or Latino
Median household income ($) - American Indian and Alaska Native
Median household income ($) - Multirace
Median household income ($) - Other Race
Mortgage status - with mortgage (%)
Mortgage status - with second mortgage (%)
Mortgage status - with home equity loan (%)
Mortgage status - with both second mortgage and home equity loan (%)
Mortgage status - without a mortgage (%)
Median year house/condo built
Median year apartment built
Household type by relationship - Male householder living alone (%)
Household type by relationship - Male householder not living alone (%)
Household type by relationship - Female householder living alone (%)
Household type by relationship - Female householder not living alone (%)
Household type by relationship - Opposite-Sex spouse (%)
Household type by relationship - Same-Sex spouse (%)
Household type by relationship - Opposite-Sex unmarried partner (%)
Household type by relationship - Same-Sex unmarried partner (%)
Household type by relationship - In group quarters (%)
Size of family households - 2-person household (%)
Size of family households - 3-person household (%)
Size of family households - 4-person household (%)
Size of family households - 5-person household (%)
Size of family households - 6-person household (%)
Size of family households - 7-or-more-person household (%)
Size of nonfamily households - 1-person household (%)
Size of nonfamily households - 2-person household (%)
Size of nonfamily households - 3-person household (%)
Size of nonfamily households - 4-person household (%)
Size of nonfamily households - 5-person household (%)
Size of nonfamily households - 6-person household (%)
Size of nonfamily households - 7-or-moreperson household (%)
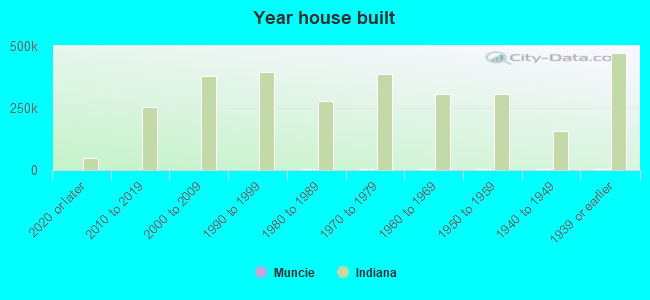
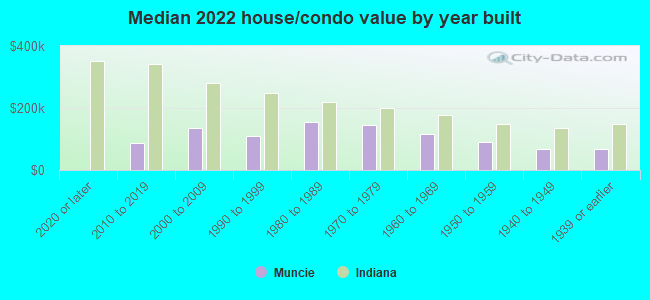
Year house built - Built 2010 or later (%)
Year house built - Built 2000 to 2009 (%)
Year house built - Built 1990 to 1999 (%)
Year house built - Built 1980 to 1989 (%)
Year house built - Built 1970 to 1979 (%)
Year house built - Built 1960 to 1969 (%)
Year house built - Built 1950 to 1959 (%)
Year house built - Built 1940 to 1949 (%)
Year house built - Built 1939 or earlier (%)
Median number of rooms in houses and condos
Median number of rooms in apartments
Median number of bedrooms in owner occupied houses
Mean number of bedrooms in owner occupied houses
Median number of bedrooms in renter occupied houses
Mean number of bedrooms in renter occupied houses
Median number of vehichles in owner occupied houses
Mean number of vehichles in owner occupied houses
Median number of vehichles in renter occupied houses
Mean number of vehichles in renter occupied houses
Rooms in owner-occupied houses - 1 room (%)
Rooms in owner-occupied houses - 2 rooms (%)
Rooms in owner-occupied houses - 3 rooms (%)
Rooms in owner-occupied houses - 4 rooms (%)
Rooms in owner-occupied houses - 5 rooms (%)
Rooms in owner-occupied houses - 6 rooms (%)
Rooms in owner-occupied houses - 7 rooms (%)
Rooms in owner-occupied houses - 8 rooms (%)
Rooms in owner-occupied houses - 9+ rooms (%)
Rooms in renter-occupied houses - 1 room (%)
Rooms in renter-occupied houses - 2 rooms (%)
Rooms in renter-occupied houses - 3 rooms (%)
Rooms in renter-occupied houses - 4 rooms (%)
Rooms in renter-occupied houses - 5 rooms (%)
Rooms in renter-occupied houses - 6 rooms (%)
Rooms in renter-occupied houses - 7 rooms (%)
Rooms in renter-occupied houses - 8 rooms (%)
Rooms in renter-occupied houses - 9+ rooms (%)
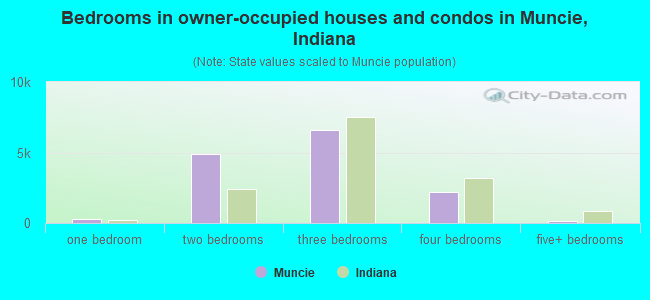
Bedrooms in owner-occupied houses - no bedrooms (%)
Bedrooms in owner-occupied houses - 1 bedroom (%)
Bedrooms in owner-occupied houses - 2 bedrooms (%)
Bedrooms in owner-occupied houses - 3 bedrooms (%)
Bedrooms in owner-occupied houses - 4 bedrooms (%)
Bedrooms in owner-occupied houses - 5+ bedrooms (%)
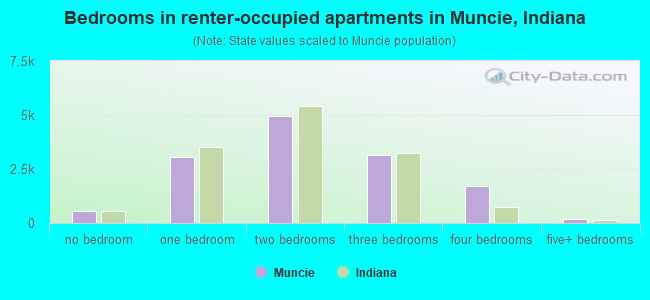
Bedrooms in renter-occupied houses - no bedrooms (%)
Bedrooms in renter-occupied houses - 1 bedroom (%)
Bedrooms in renter-occupied houses - 2 bedrooms (%)
Bedrooms in renter-occupied houses - 3 bedrooms (%)
Bedrooms in renter-occupied houses - 4 bedrooms (%)
Bedrooms in renter-occupied houses - 5+ bedrooms (%)
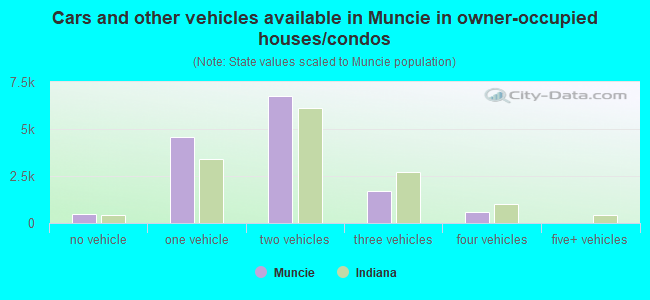
Vehicles available in owner-occupied houses - no vehicle available (%)
Vehicles available in owner-occupied houses - 1 vehicle available(%)
Vehicles available in owner-occupied houses - 2 Vehicles available (%)
Vehicles available in owner-occupied houses - 3 Vehicles available (%)
Vehicles available in owner-occupied houses - 4 Vehicles available (%)
Vehicles available in owner-occupied houses - 5+ Vehicles available (%)
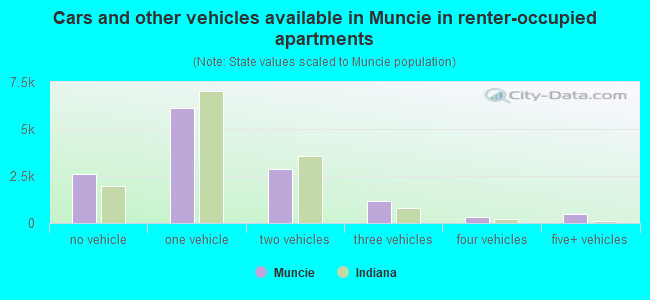
Vehicles available in renter-occupied houses - no vehicle available (%)
Vehicles available in renter-occupied houses - 1 vehicle available (%)
Vehicles available in renter-occupied houses - 2 Vehicles available (%)
Vehicles available in renter-occupied houses - 3 Vehicles available (%)
Vehicles available in renter-occupied houses - 4 Vehicles available (%)
Vehicles available in renter-occupied houses - 5+ Vehicles available (%)
Housing units in structures - 1, detached (%)
Housing units in structures - 1, attached (%)
Housing units in structures - 2 (%)
Housing units in structures - 3 or 4 (%)
Housing units in structures - 5 to 9 (%)
Housing units in structures - 10 to 19 (%)
Housing units in structures - 20 to 49 (%)
Housing units in structures - 50 or more (%)
Housing units in structures - Mobile home (%)
Housing units in structures - Boat, RV, van, etc. (%)
Housing units in structures - Owners - 1, detached (%)
Housing units in structures - Owners - 1, attached (%)
Housing units in structures - Owners - 2 (%)
Housing units in structures - Owners - 3 or 4 (%)
Housing units in structures - Owners - 5 to 9 (%)
Housing units in structures - Owners - 10 to 19 (%)
Housing units in structures - Owners - 20 to 49 (%)
Housing units in structures - Owners - 50 or more (%)
Housing units in structures - Owners - Mobile home (%)
Housing units in structures - Owners - Boat, RV, van, etc. (%)
Housing units in structures - Renters - 1, detached (%)
Housing units in structures - Renters - 1, attached (%)
Housing units in structures - Renters - 2 (%)
Housing units in structures - Renters - 3 or 4 (%)
Housing units in structures - Renters - 5 to 9 (%)
Housing units in structures - Renters - 10 to 19 (%)
Housing units in structures - Renters - 20 to 49 (%)
Housing units in structures - Renters - 50 or more (%)
Housing units in structures - Renters - Mobile home (%)
Housing units in structures - Renters - Boat, RV, van, etc. (%)
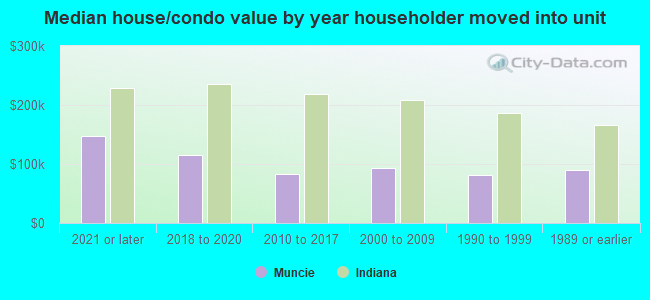
House/condo owner moved in on average (years ago)
Renter moved in on average (years ago)
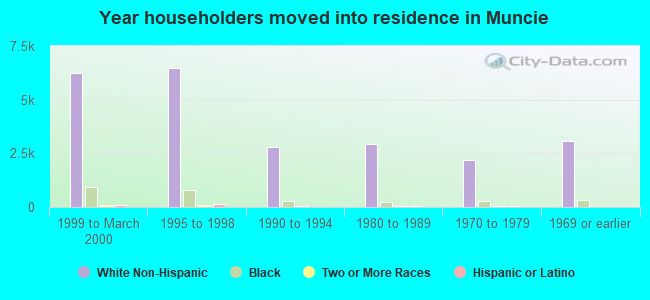
Year householder moved into unit - Moved in 1999 to March 2000 (%)
Year householder moved into unit - Moved in 1999 to March 2000 (%) - White
Year householder moved into unit - Moved in 1999 to March 2000 (%) - Black or African American
Year householder moved into unit - Moved in 1999 to March 2000 (%) - Asian
Year householder moved into unit - Moved in 1999 to March 2000 (%) - Hispanic or Latino
Year householder moved into unit - Moved in 1999 to March 2000 (%) - American Indian and Alaska Native
Year householder moved into unit - Moved in 1999 to March 2000 (%) - Multirace
Year householder moved into unit - Moved in 1999 to March 2000 (%) - Other Race
Year householder moved into unit - Moved in 1995 to 1998 (%)
Year householder moved into unit - Moved in 1995 to 1998 (%) - White
Year householder moved into unit - Moved in 1995 to 1998 (%) - Black or African American
Year householder moved into unit - Moved in 1995 to 1998 (%) - Asian
Year householder moved into unit - Moved in 1995 to 1998 (%) - Hispanic or Latino
Year householder moved into unit - Moved in 1995 to 1998 (%) - American Indian and Alaska Native
Year householder moved into unit - Moved in 1995 to 1998 (%) - Multirace
Year householder moved into unit - Moved in 1995 to 1998 (%) - Other Race
Year householder moved into unit - Moved in 1990 to 1994 (%)
Year householder moved into unit - Moved in 1990 to 1994 (%) - White
Year householder moved into unit - Moved in 1990 to 1994 (%) - Black or African American
Year householder moved into unit - Moved in 1990 to 1994 (%) - Asian
Year householder moved into unit - Moved in 1990 to 1994 (%) - Hispanic or Latino
Year householder moved into unit - Moved in 1990 to 1994 (%) - American Indian and Alaska Native
Year householder moved into unit - Moved in 1990 to 1994 (%) - Multirace
Year householder moved into unit - Moved in 1990 to 1994 (%) - Other Race
Year householder moved into unit - Moved in 1980 to 1989 (%)
Year householder moved into unit - Moved in 1980 to 1989 (%) - White
Year householder moved into unit - Moved in 1980 to 1989 (%) - Black or African American
Year householder moved into unit - Moved in 1980 to 1989 (%) - Asian
Year householder moved into unit - Moved in 1980 to 1989 (%) - Hispanic or Latino
Year householder moved into unit - Moved in 1980 to 1989 (%) - American Indian and Alaska Native
Year householder moved into unit - Moved in 1980 to 1989 (%) - Multirace
Year householder moved into unit - Moved in 1980 to 1989 (%) - Other Race
Year householder moved into unit - Moved in 1970 to 1979 (%)
Year householder moved into unit - Moved in 1970 to 1979 (%) - White
Year householder moved into unit - Moved in 1970 to 1979 (%) - Black or African American
Year householder moved into unit - Moved in 1970 to 1979 (%) - Asian
Year householder moved into unit - Moved in 1970 to 1979 (%) - Hispanic or Latino
Year householder moved into unit - Moved in 1970 to 1979 (%) - American Indian and Alaska Native
Year householder moved into unit - Moved in 1970 to 1979 (%) - Multirace
Year householder moved into unit - Moved in 1970 to 1979 (%) - Other Race
Year householder moved into unit - Moved in 1969 or earlier (%)
Year householder moved into unit - Moved in 1969 or earlier (%) - White
Year householder moved into unit - Moved in 1969 or earlier (%) - Black or African American
Year householder moved into unit - Moved in 1969 or earlier (%) - Asian
Year householder moved into unit - Moved in 1969 or earlier (%) - Hispanic or Latino
Year householder moved into unit - Moved in 1969 or earlier (%) - American Indian and Alaska Native
Year householder moved into unit - Moved in 1969 or earlier (%) - Multirace
Year householder moved into unit - Moved in 1969 or earlier (%) - Other Race
Housing units lacking complete plumbing facilities (%)
Housing units lacking complete kitchen facilities (%)
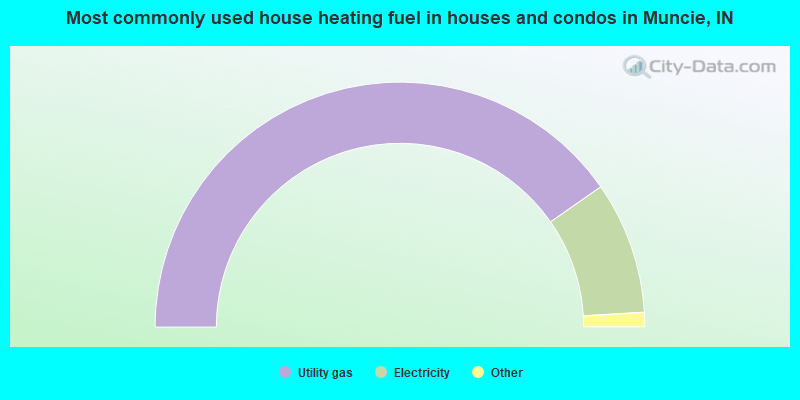
House heating fuel used in houses and condos - Utility gas (%)
House heating fuel used in houses and condos - Bottled, tank, or LP gas (%)
House heating fuel used in houses and condos - Electricity (%)
House heating fuel used in houses and condos - Fuel oil, kerosene, etc. (%)
House heating fuel used in houses and condos - Coal or coke (%)
House heating fuel used in houses and condos - Wood (%)
House heating fuel used in houses and condos - Solar energy (%)
House heating fuel used in houses and condos - Other fuel (%)
House heating fuel used in houses and condos - No fuel used (%)
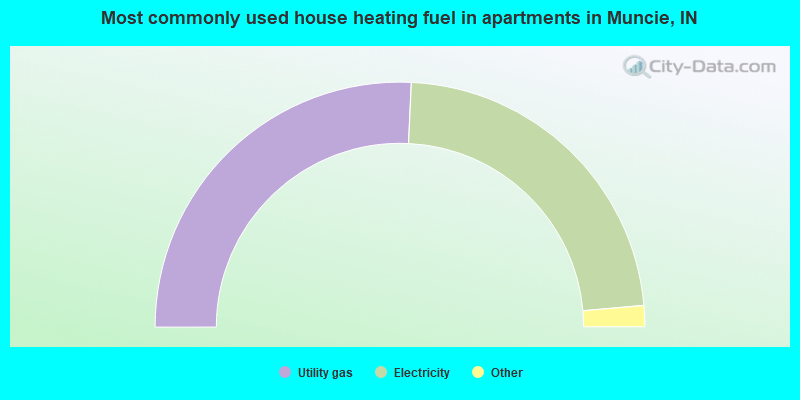
House heating fuel used in apartments - Utility gas (%)
House heating fuel used in apartments - Bottled, tank, or LP gas (%)
House heating fuel used in apartments - Electricity (%)
House heating fuel used in apartments - Fuel oil, kerosene, etc. (%)
House heating fuel used in apartments - Coal or coke (%)
House heating fuel used in apartments - Wood (%)
House heating fuel used in apartments - Solar energy (%)
House heating fuel used in apartments - Other fuel (%)
House heating fuel used in apartments - No fuel used (%)
Latest news about housing in Muncie, IN collected exclusively by city-data.com from local newspapers, TV, and radio stations
Median year house/condo built: 1960Median year apartment built: 1974Household type by relationship:
Households: 65,160
Male householders: 11,100 (4,367 living alone ), Female householders: 16,616 (6,313 living alone )7,532 spouses (7,480 opposite-sex spouses ), 3,300 unmarried partners , (3,056 opposite-sex unmarried partners ), 10,545 children (8,821 natural , 275 adopted , 1,449 stepchildren ), 1,106 grandchildren , 1,029 brothers or sisters , 410 parents , 378 foster children , 635 other relatives , 4,909 non-relatives In group quarters: 7,600
Size of family households: 6,381 2-persons , 2,724 3-persons , 1,611 4-persons , 1,069 5-persons , 643 6-persons , 128 7-or-more-persons .
Size of nonfamily households: 10,680 1-person , 3,087 2-persons , 869 3-persons , 199 4-persons , 325 5-persons .
3,988 married couples with children. single-parent households (274 men , 4,151 women ).
94.9% of residents of Muncie speak English at home. of residents speak Spanish at home (82% speak English very well , 17% speak English well , 1% speak English not well , 1% don't speak English at all ).of residents speak other Indo-European language at home (82% speak English very well , 14% speak English well , 2% speak English not well , 2% don't speak English at all ).of residents speak Asian or Pacific Island language at home (50% speak English very well , 40% speak English well , 5% speak English not well , 5% don't speak English at all ).of residents speak other language at home (92% speak English very well , 5% speak English well , 3% speak English not well ).
Foreign born population: 1,980 (3.0%)of them are naturalized citizens )
Median number of rooms in houses and condos:
Median number of rooms in apartments
Owner-occupied Renter-occupied
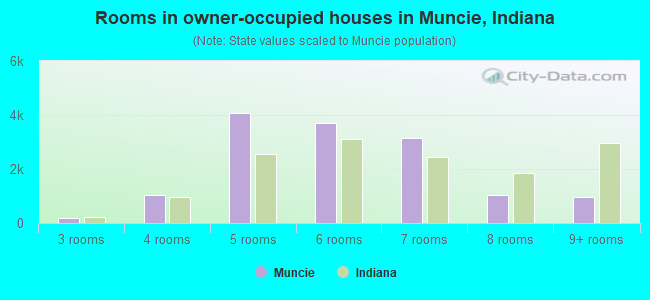
Rooms in owner-occupied houses in Muncie, Indiana
0 1 room 0 2 rooms 183 3 rooms 1,025 4 rooms 4,076 5 rooms 3,687 6 rooms 3,137 7 rooms 1,052 8 rooms 953 9+ rooms
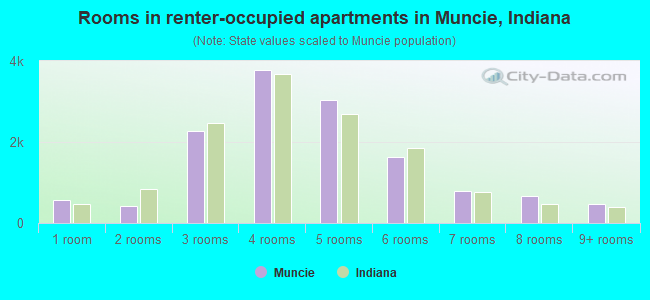
Rooms in renter-occupied apartments in Muncie, Indiana
577 1 room 410 2 rooms 2,263 3 rooms 3,772 4 rooms 3,027 5 rooms 1,635 6 rooms 785 7 rooms 657 8 rooms 477 9+ rooms
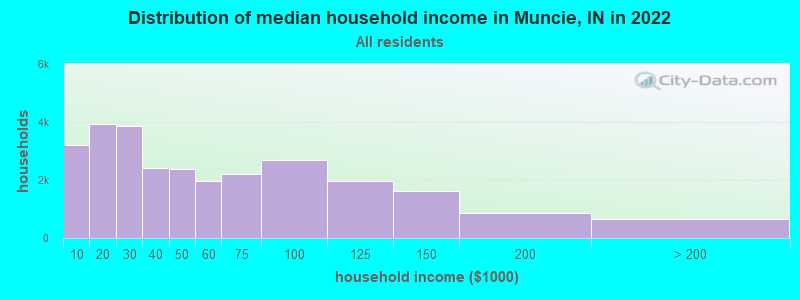
Muncie, IN household income distribution 3,212 Less than $10,0003,948 $10,000 to $19,9993,847 $20,000 to $29,9992,404 $30,000 to $39,9992,390 $40,000 to $49,9991,949 $50,000 to $59,9992,204 $60,000 to $74,9992,679 $75,000 to $99,9991,965 $100,000 to $124,9991,617 $125,000 to $149,999845 $150,000 to $199,999656 $200,000 or more
Home value of owner - occupied houses in 2022 in Muncie, IN 94 Less than $10,000534 $10,000 to $14,999119 $15,000 to $19,999249 $20,000 to $24,999328 $25,000 to $29,999254 $30,000 to $34,999218 $35,000 to $39,9991,117 $40,000 to $49,999824 $50,000 to $59,999821 $60,000 to $69,9991,147 $70,000 to $79,9991,098 $80,000 to $89,999643 $90,000 to $99,9991,033 $100,000 to $124,9991,443 $125,000 to $149,9991,322 $150,000 to $174,999816 $175,000 to $199,9991,336 $200,000 to $249,999302 $250,000 to $299,999209 $300,000 to $399,999109 $400,000 to $499,99941 $500,000 to $749,99956 $750,000 to $999,999Rent paid by renters in 2022 in Muncie, IN 128 $100 to $149104 $150 to $199472 $200 to $249412 $250 to $299368 $300 to $349181 $350 to $399353 $400 to $449596 $450 to $4991,047 $500 to $549477 $550 to $599728 $600 to $6491,578 $650 to $699872 $700 to $749910 $750 to $7991,707 $800 to $8991,492 $900 to $9991,012 $1,000 to $1,249405 $1,500 to $1,999119 $2,000 to $2,499642 No cash rent
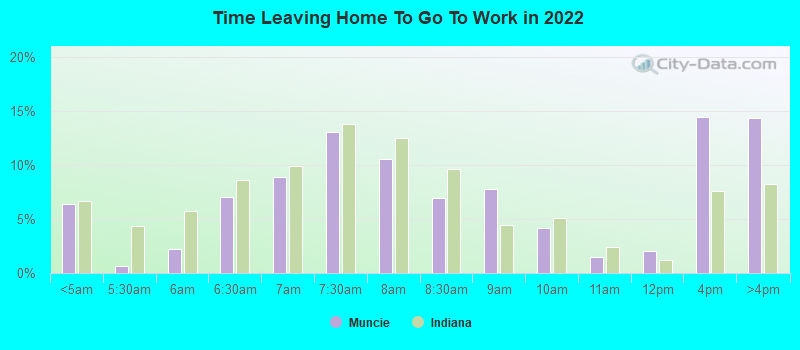
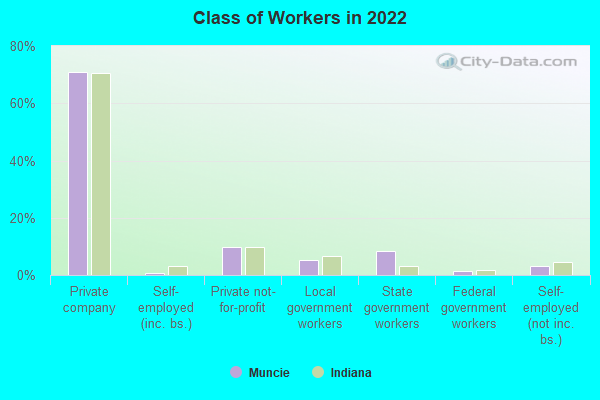
Percentage of workers working in this county: 79.9%Number of people working at home: 2,242 (7.5% of all workers )
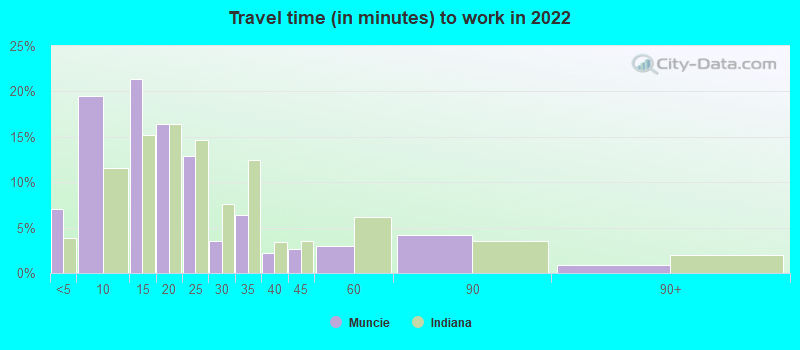
Travel time to work (commute)
Less than 5 minutes: 2,5455 to 9 minutes: 5,69910 to 14 minutes: 5,89615 to 19 minutes: 5,32520 to 24 minutes: 2,66825 to 29 minutes: 52930 to 34 minutes: 1,37135 to 39 minutes: 26740 to 44 minutes: 12945 to 59 minutes: 1,06460 to 89 minutes: 1,61090 or more minutes: 313
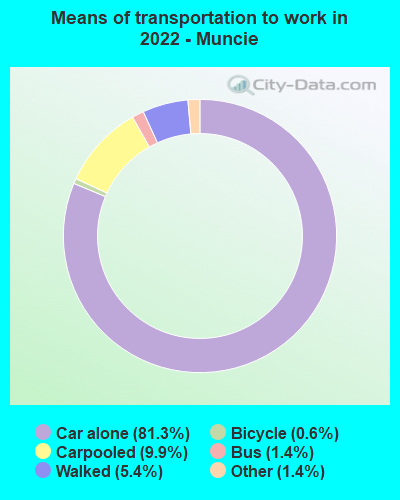
Means of transportation to work:
Drove a car alone: 29,219 (74.7%)Carpooled: 3,909 (10.0%)Bus : 489 (1.3%)Taxi: 616 (1.6%)Bicycle: 245 (0.6%)Walked: 1,950 (5.0%)Worked at home: 2,242 (5.7%)
Unemployment by race in 2022
Unemployment rate for White non-Hispanic residents 9.6% Males3.8% FemalesUnemployment rate for Black residents 5.3% Males4.7% FemalesUnemployment rate for Asian residents 2.3% FemalesUnemployment rate for other race residents 5.8% MalesUnemployment rate for two or more race residents 11.7% Males9.4% FemalesUnemployment rate for Hispanic or Latino residents 10.8% Males19.8% Females
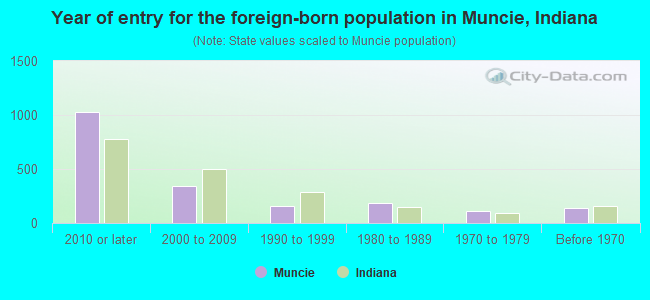
Year of entry for the foreign-born population in Muncie, Indiana
1,024 2010 or later 347 2000 to 2009 161 1990 to 1999 183 1980 to 1989 112 1970 to 1979 139 Before 1970
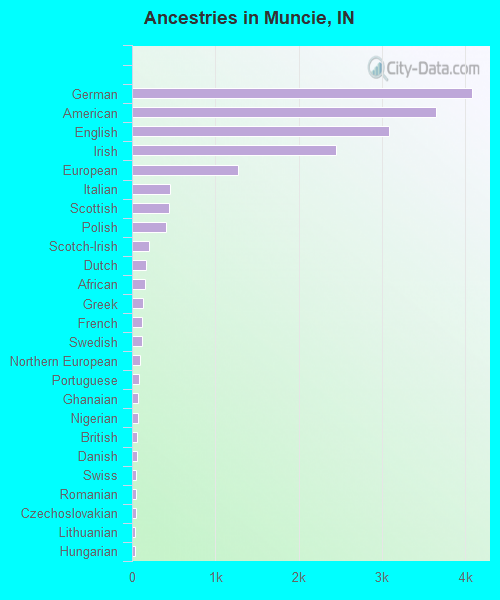
First ancestries reported:
German: 4,084 (14.0%)
American: 3,657 (12.6%)
English: 3,088 (10.6%)
Irish: 2,445 (8.4%)
European: 1,270 (4.4%)
Italian: 455 (1.6%)
Scottish: 448 (1.5%)
Polish: 405 (1.4%)
Scotch-Irish: 205 (0.7%)
Dutch: 164 (0.6%)
African: 162 (0.6%)
Greek: 138 (0.5%)
French: 118 (0.4%)
Swedish: 117 (0.4%)
Northern European: 91 (0.3%)
Portuguese: 83 (0.3%)
Ghanaian: 72 (0.2%)
Nigerian: 70 (0.2%)
British: 66 (0.2%)
Danish: 58 (0.2%)
Swiss: 48 (0.2%)
Romanian: 47 (0.2%)
Czechoslovakian: 44 (0.2%)
Lithuanian: 42 (0.1%)
Hungarian: 39 (0.1%)
Arab: 34 (0.1%)
Scandinavian: 34 (0.1%)
Pennsylvania German: 33 (0.1%)
Eastern European: 33 (0.1%)
Norwegian: 32 (0.1%)
Serbian: 30 (0.1%)
Senegalese: 26 (0.09%)
French Canadian: 24 (0.08%)
Iranian: 23 (0.08%)
Bahamian: 21 (0.07%)
Czech: 20 (0.07%)
Brazilian: 19 (0.07%)
Russian: 19 (0.07%)
Australian: 15 (0.05%)
Austrian: 15 (0.05%)
Kenyan: 10 (0.03%)
Slovak: 6 (0.02%)
Welsh: 6 (0.02%)
Barbadian: 6 (0.02%) Most common places of birth for foreign-born residents (%): China, excluding Hong Kong and Taiwan Muncie:
13.6% (225)Indiana:
5.3% (19,877)
Mexico Muncie:
11.7% (194)Indiana:
27.0% (101,996)
India Muncie:
11.5% (191)Indiana:
8.5% (32,127)
Vietnam Muncie:
7.5% (124)Indiana:
1.8% (6,645)
Philippines Muncie:
5.4% (89)Indiana:
3.1% (11,851)
Nigeria Muncie:
4.8% (79)Indiana:
3.3% (12,337)
Ghana Muncie:
4.5% (75)Indiana:
0.5% (1,776)
Korea Muncie:
4.0% (67)Indiana:
2.0% (7,653)
Bangladesh Muncie:
3.1% (51)Indiana:
0.5% (1,942)
Saudi Arabia Muncie:
2.2% (36)Indiana:
0.4% (1,388)
Germany Muncie:
2.1% (35)Indiana:
1.7% (6,439)
Iran Muncie:
1.9% (32)Indiana:
0.4% (1,600)
United Kingdom, excluding England and Scotland Muncie:
1.7% (28)Indiana:
0.7% (2,504)
Netherlands Muncie:
1.6% (26)Indiana:
0.2% (705)
Brazil Muncie:
1.5% (25)Indiana:
0.7% (2,626)
Place of birth for U.S.-born residents:
This state: 50,197Other state: 11,926Northeast: 1,513Midwest: 4,021South: 4,681West: 1,711 68.1% of Muncie residents lived in the same house 1 years ago.
Out of people who lived in different houses, 35.1% lived in this county.
Out of people who lived in different counties, 76.6% lived in Indiana.
Muncie:
68.1%State average:
87.1%
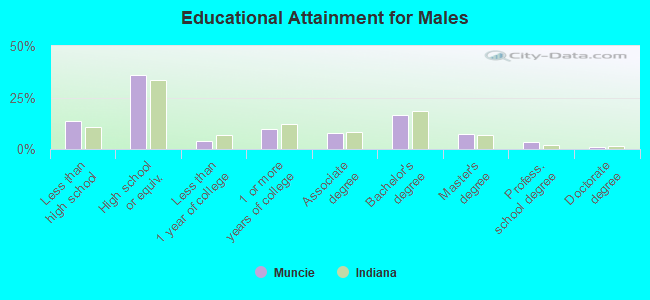
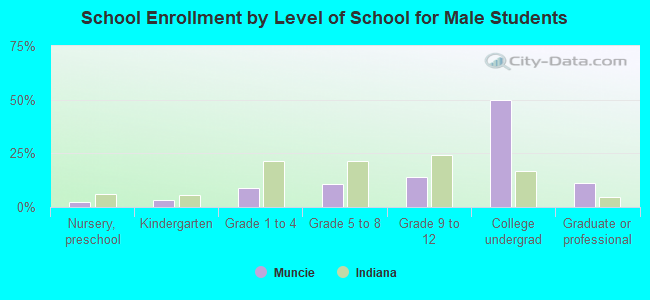
Education attainment for males 25 years and older:
No schooling: 46Nursery to 4th grade: 05th and 6th grade: 317th and 8th grade: 3609th grade: 21510th grade: 56111th grade: 57512th grade, no diploma: 606High school graduate (or equivalency): 6,244Less than 1 year of college: 707Some college more than 1 year, no degree: 1,666Associate degree: 1,388Bachelor's degree: 2,895Master's degree: 1,303Professional school degree: 617Doctorate degree: 154
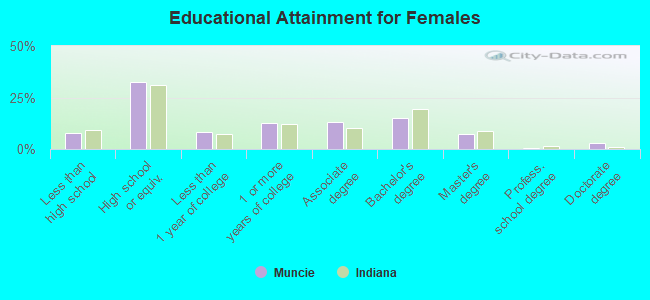
Education attainment for females 25 years and older:
No schooling: 165Nursery to 4th grade: 05th and 6th grade: 07th and 8th grade: 329th grade: 17010th grade: 55611th grade: 47712th grade, no diploma: 206High school graduate (or equivalency): 6,539Less than 1 year of college: 1,686Some college more than 1 year, no degree: 2,584Associate degree: 2,653Bachelor's degree: 3,038Master's degree: 1,488Professional school degree: 91Doctorate degree: 561
Housing units in structures:
One, detached: 19,991One, attached: 707Two: 1,5163 or 4: 1,6135 to 9: 2,58010 to 19: 1,85520 to 49: 91150 or more: 850Mobile homes: 803Median worth of mobile homes: $13,000
Housing units lacking complete plumbing facilities in 2022: 2.4%Housing units lacking complete kitchen facilities in 2022: 2.6%House/condo owner moved in on average 12 years ago
Renter moved in on average 0 years ago
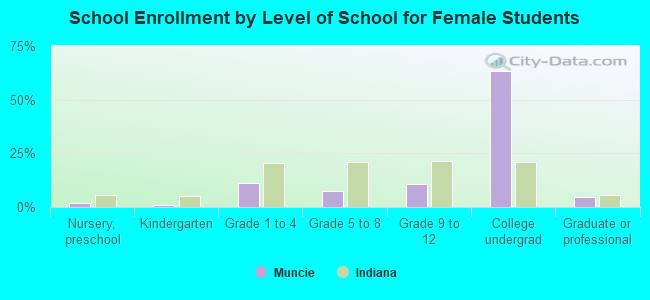
Private vs. public school enrollment:
Students in private schools in grades 1 to 8 (elementary and middle school): 461 Students in private schools in grades 9 to 12 (high school): 214 Students in private undergraduate colleges: 45