Housing density: 3,137 houses/condos per square mile
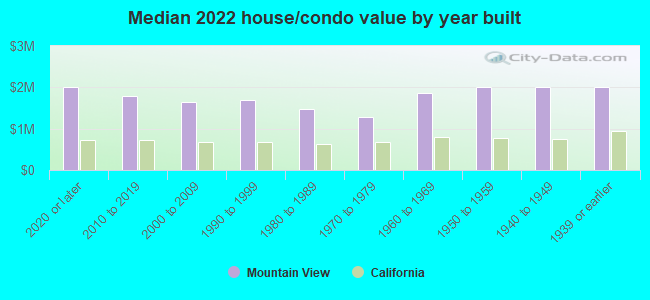
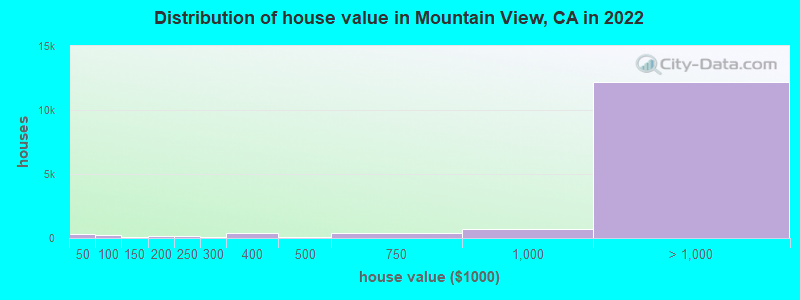
Median price asked for vacant for-sale houses and condos in 2022: $2,573,125.
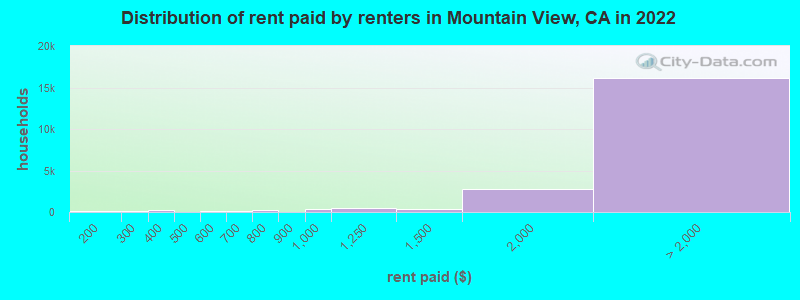
Median contract rent in 2022: over $2,000 (lower quartile is $1,796, upper quartile is over $2,000)
Median rent asked for vacant for-rent units in 2022: $2,304
Median gross rent in Mountain View, CA in 2022: over $2,000
Housing units in Mountain View with a mortgage: 8,647 (797 second mortgage, 0 home equity loan, 771 both second mortgage and home equity loan) Houses without a mortgage: 212
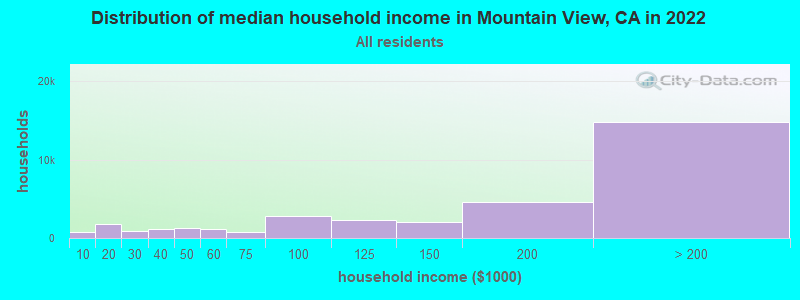
Median household income for houses/condos with a mortgage: $250,001
Median household income for apartments without a mortgage: $154,090
Median monthly housing costs: $2,819
Compare current foreclosures near Mountain View, CA:
Size of family households: 7,874 2-persons, 5,015 3-persons, 3,210 4-persons, 1,502 5-persons, 720 6-persons, 223 7-or-more-persons.
Size of nonfamily households: 11,737 1-person, 3,191 2-persons, 757 3-persons.
12,422 married couples with children.
3,892 single-parent households (795 men, 3,097 women).
49.8% of residents of Mountain View speak English at home.
14.3% of residents speak Spanish at home (59% speak English very well, 21% speak English well, 15% speak English not well, 5% don't speak English at all).
14.8% of residents speak other Indo-European language at home (80% speak English very well, 14% speak English well, 5% speak English not well, 1% don't speak English at all).
20.1% of residents speak Asian or Pacific Island language at home (63% speak English very well, 27% speak English well, 8% speak English not well, 1% don't speak English at all).
1.3% of residents speak other language at home (89% speak English very well, 11% speak English well).
Foreign born population: 33,651 (41.5%)
(45.7% of them are naturalized citizens)
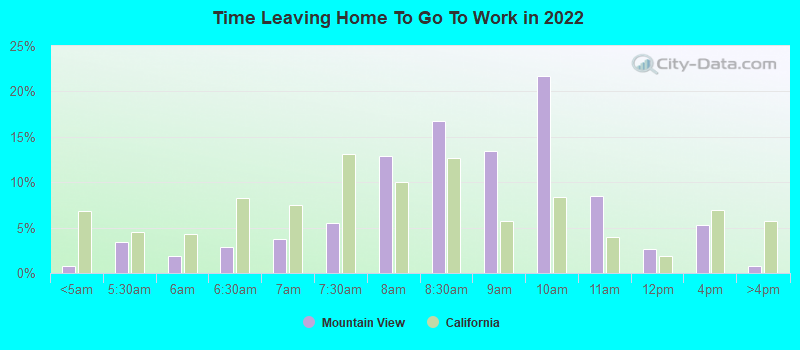
Percentage of workers working in this county: 88.6% Number of people working at home: 13,423 (30.2% of all workers)
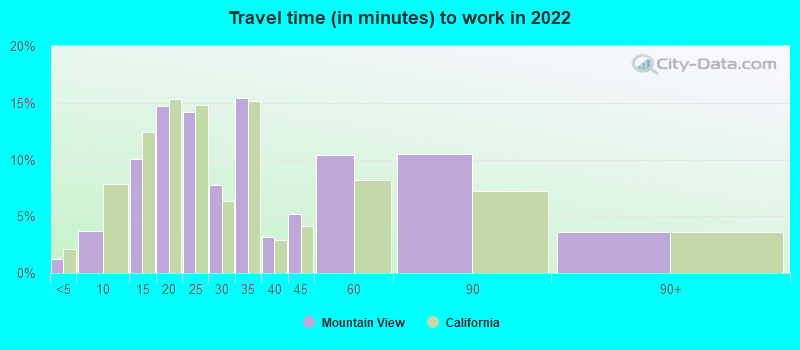
Travel time to work (commute)
Less than 5 minutes: 622
5 to 9 minutes: 1,847
10 to 14 minutes: 5,045
15 to 19 minutes: 6,384
20 to 24 minutes: 6,715
25 to 29 minutes: 2,199
30 to 34 minutes: 4,625
35 to 39 minutes: 366
40 to 44 minutes: 846
45 to 59 minutes: 891
60 to 89 minutes: 939
90 or more minutes: 512
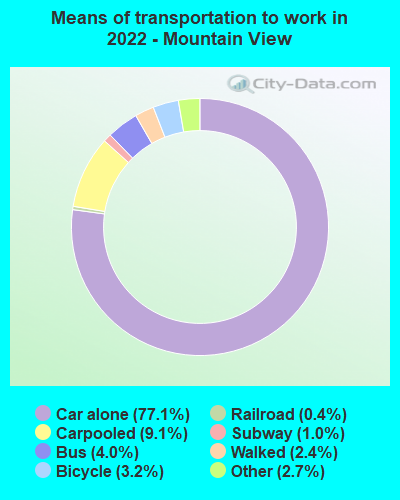
Means of transportation to work:
Drove a car alone: 52,085 (64.3%)
Carpooled: 6,150 (7.6%)
Bus: 2,683 (3.3%)
Subway or elevated rail: 39 (0.0%)
Long-distance train or commuter rail: 689 (0.9%)
Light rail, streetcar or trolley: 261 (0.3%)
Taxi: 1,827 (2.3%)
Bicycle: 2,192 (2.7%)
Walked: 1,631 (2.0%)
Worked at home: 13,423 (16.6%)
Unemployment by race in 2022
Unemployment rate for White non-Hispanic residents
1.5%Males
2.1%Females
Unemployment rate for Black residents
6.2%Males
18.1%Females
Unemployment rate for American Indian and Alaska Native residents
6.4%Males
Unemployment rate for Asian residents
3.2%Males
Unemployment rate for other race residents
0.9%Males
3.5%Females
Unemployment rate for two or more race residents
11.8%Males
13.9%Females
Unemployment rate for Hispanic or Latino residents
1.4%Males
5.6%Females
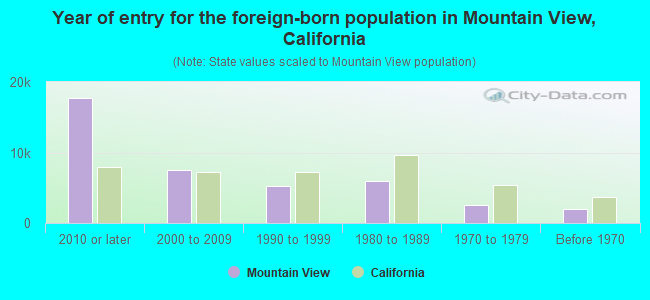
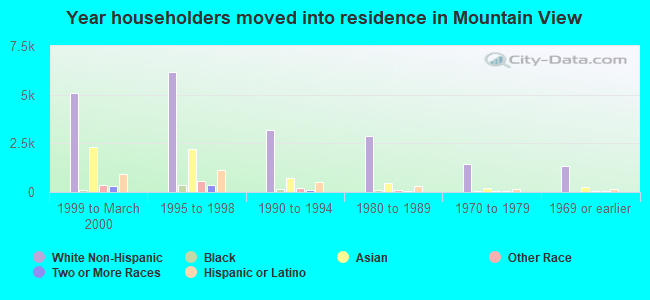
Year of entry for the foreign-born population in Mountain View, California
17,7232010 or later
7,4732000 to 2009
5,2711990 to 1999
5,9161980 to 1989
2,6001970 to 1979
2,002Before 1970
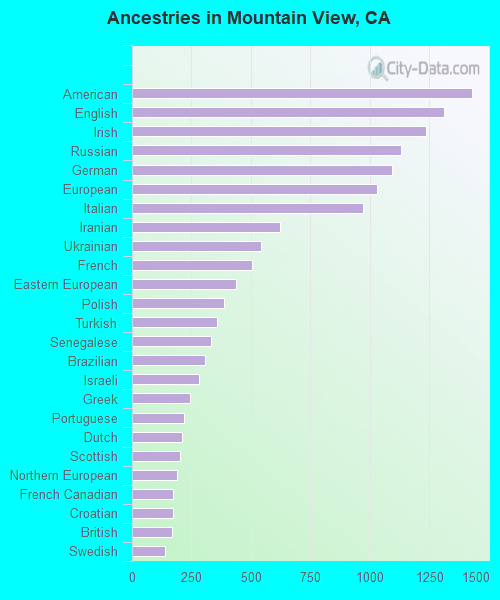
First ancestries reported:
American: 1,429 (2.9%)
English: 1,311 (2.6%)
Irish: 1,234 (2.5%)
Russian: 1,129 (2.3%)
German: 1,091 (2.2%)
European: 1,029 (2.1%)
Italian: 972 (1.9%)
Iranian: 621 (1.2%)
Ukrainian: 543 (1.1%)
French: 506 (1.0%)
Eastern European: 438 (0.9%)
Polish: 388 (0.8%)
Turkish: 359 (0.7%)
Senegalese: 333 (0.7%)
Brazilian: 307 (0.6%)
Israeli: 283 (0.6%)
Greek: 243 (0.5%)
Portuguese: 218 (0.4%)
Dutch: 210 (0.4%)
Scottish: 202 (0.4%)
Northern European: 188 (0.4%)
French Canadian: 172 (0.3%)
Croatian: 171 (0.3%)
British: 169 (0.3%)
Swedish: 139 (0.3%)
Scotch-Irish: 121 (0.2%)
Czech: 116 (0.2%)
Canadian: 113 (0.2%)
Australian: 111 (0.2%)
Nigerian: 110 (0.2%)
Romanian: 99 (0.2%)
Hungarian: 97 (0.2%)
Serbian: 74 (0.1%)
Armenian: 70 (0.1%)
Bulgarian: 60 (0.1%)
Norwegian: 60 (0.1%)
Swiss: 56 (0.1%)
Egyptian: 55 (0.1%)
Lithuanian: 52 (0.1%)
Guyanese: 48 (0.10%)
Danish: 46 (0.09%)
Scandinavian: 45 (0.09%)
African: 44 (0.09%)
Austrian: 44 (0.09%)
Ethiopian: 39 (0.08%)
Afghan: 34 (0.07%)
Kenyan: 25 (0.05%)
Sudanese: 24 (0.05%)
Lebanese: 22 (0.04%)
Albanian: 19 (0.04%)
Jamaican: 19 (0.04%)
Trinidadian and Tobagonian: 19 (0.04%)
Syrian: 17 (0.03%)
Estonian: 16 (0.03%)
Yugoslavian: 15 (0.03%)
Slovak: 15 (0.03%)
Belgian: 12 (0.02%)
New Zealander: 9 (0.02%)
Icelander: 8 (0.02%)
Welsh: 7 (0.01%)
Slavic: 7 (0.01%)
South African: 6 (0.01%)
Finnish: 6 (0.01%)
Pennsylvania German: 6 (0.01%)
Basque: 4 (0.01%)
Arab: 3 (0.01%)
Most common places of birth for foreign-born residents (%):
India
Mountain View:
16.0% (5,526)
California:
5.2% (539,184)
China, excluding Hong Kong and Taiwan
Mountain View:
15.7% (5,408)
California:
6.6% (684,672)
Mexico
Mountain View:
10.8% (3,722)
California:
37.2% (3,881,193)
Taiwan
Mountain View:
5.3% (1,831)
California:
1.7% (176,274)
Philippines
Mountain View:
3.1% (1,059)
California:
7.8% (818,297)
Korea
Mountain View:
2.9% (1,013)
California:
3.0% (315,248)
Russia
Mountain View:
2.9% (1,005)
California:
0.7% (71,932)
Canada
Mountain View:
2.9% (991)
California:
1.2% (127,477)
Colombia
Mountain View:
2.2% (773)
California:
0.5% (55,249)
France
Mountain View:
1.9% (654)
California:
0.4% (40,224)
Hong Kong
Mountain View:
1.9% (642)
California:
1.0% (105,215)
Israel
Mountain View:
1.8% (633)
California:
0.3% (33,029)
Vietnam
Mountain View:
1.8% (629)
California:
4.9% (512,335)
El Salvador
Mountain View:
1.8% (609)
California:
4.2% (440,287)
United Kingdom, excluding England and Scotland
Mountain View:
1.7% (603)
California:
0.6% (60,582)
Japan
Mountain View:
1.7% (602)
California:
1.0% (103,575)
Ukraine
Mountain View:
1.7% (573)
California:
0.6% (60,761)
Iran
Mountain View:
1.6% (540)
California:
2.0% (206,004)
Brazil
Mountain View:
1.5% (520)
California:
0.5% (53,222)
Place of birth for U.S.-born residents:
This state: 28,737
Other state: 17,087
Northeast: 5,736
Midwest: 4,672
South: 3,357
West: 3,322
78.1% of Mountain View residents lived in the same house 1 years ago. Out of people who lived in different houses, 34.3% lived in this county. Out of people who lived in different counties, 35.8% lived in California.
Mountain View:
78.1%
State average:
88.9%
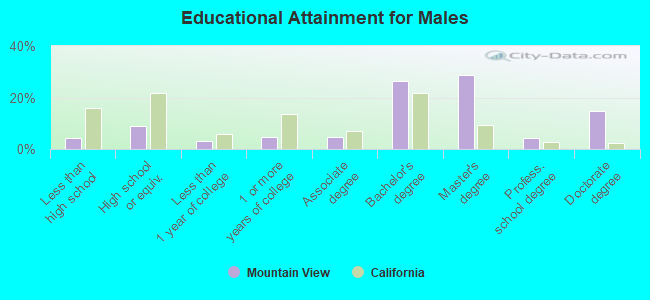
Education attainment for males 25 years and older:
No schooling: 471
Nursery to 4th grade: 310
5th and 6th grade: 110
7th and 8th grade: 172
9th grade: 51
10th grade: 40
11th grade: 74
12th grade, no diploma: 74
High school graduate (or equivalency): 2,815
Less than 1 year of college: 1,019
Some college more than 1 year, no degree: 1,524
Associate degree: 1,512
Bachelor's degree: 8,443
Master's degree: 9,075
Professional school degree: 1,394
Doctorate degree: 4,670
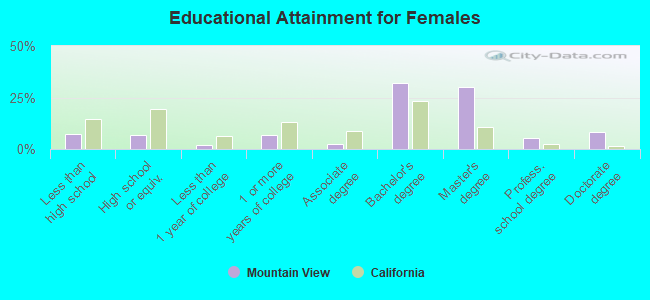
Education attainment for females 25 years and older:
No schooling: 274
Nursery to 4th grade: 483
5th and 6th grade: 407
7th and 8th grade: 627
9th grade: 56
10th grade: 0
11th grade: 81
12th grade, no diploma: 0
High school graduate (or equivalency): 1,818
Less than 1 year of college: 566
Some college more than 1 year, no degree: 1,794
Associate degree: 619
Bachelor's degree: 8,700
Master's degree: 8,125
Professional school degree: 1,413
Doctorate degree: 2,210
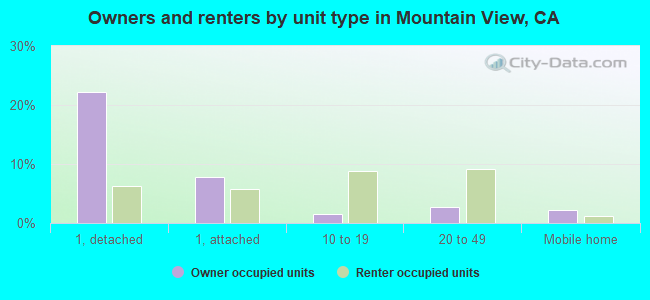
Housing units in structures:
One, detached: 10,467
One, attached: 4,949
Two: 796
3 or 4: 1,685
5 to 9: 2,504
10 to 19: 4,364
20 to 49: 4,510
50 or more: 7,365
Mobile homes: 1,208
Median worth of mobile homes: $233,730
Housing units lacking complete plumbing facilities in 2022: 0.1%
Housing units lacking complete kitchen facilities in 2022: 0.4%
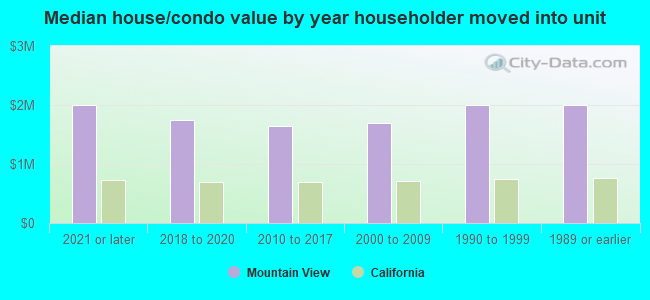
House/condo owner moved in on average 13 years ago