Mountain Top, PA (Pennsylvania) Houses and Residents
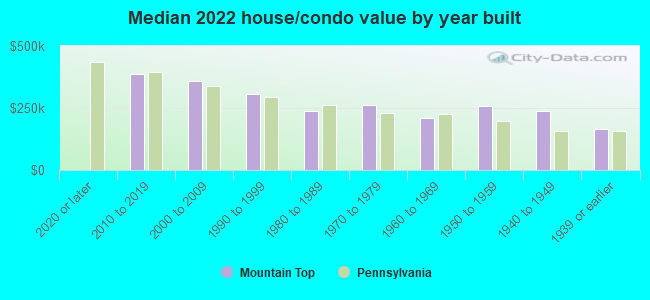
| Mountain Top: | $279,885 |
| Pennsylvania: | $245,500 |
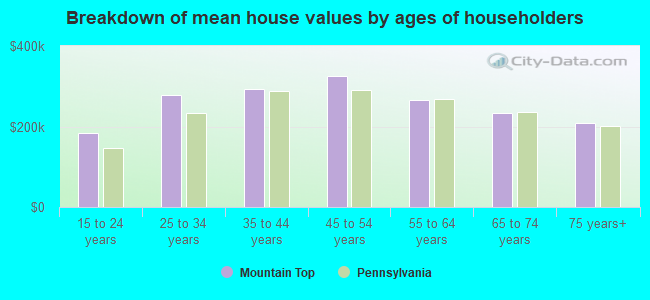
Mean price in 2022:
Detached houses: $325,493
Here: $325,493 State: $317,202 Townhouses or other attached units: $166,331
Here: $166,331 State: $254,369 Mobile homes: $123,653
Here: $123,653 State: $92,414
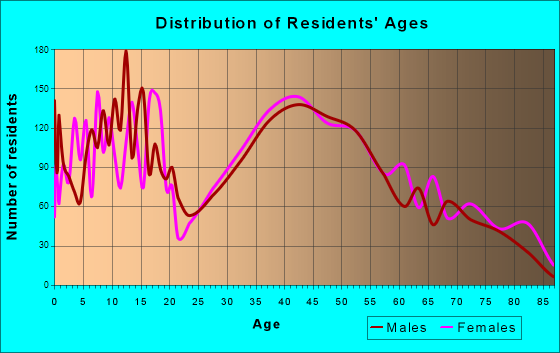
Total population: 10,982 (Urban population: 8,240, Rural population: 7,014 (41 farm, 6,973 nonfarm))
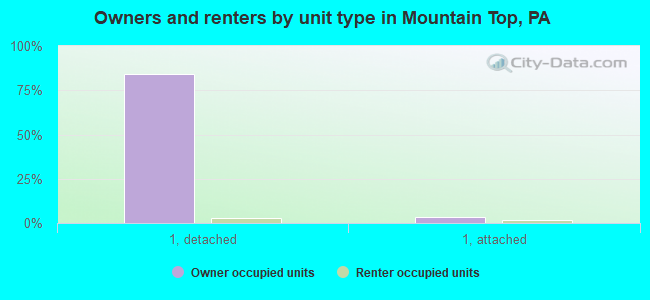
Houses: 4,468 (4,325 occupied: 3,980 owner occupied, 405 renter occupied)
| % of renters here: | 9% |
| State: | 31% |
Housing density: 66 houses/condos per square mile
Median price asked for vacant for-sale houses and condos in 2022: $2,097,096.
Median contract rent in 2022: $637 (lower quartile is $463, upper quartile is $875)
Median rent asked for vacant for-rent units in 2022: $608
Median gross rent in Mountain Top, PA in 2022: $813
Housing units in Mountain Top with a mortgage: 2,902 (359 second mortgage, 0 home equity loan, 270 both second mortgage and home equity loan)
Houses without a mortgage: 106
Median household income for houses/condos with a mortgage: $113,547
Median household income for apartments without a mortgage: $89,639
Median monthly housing costs: $1,428
Compare current foreclosures in Mountain Top, PA:
| Photo | Address | Area | Beds / Baths | Price | Details |
|---|---|---|---|---|---|

|
#1
Blytheburn Rd
Mountain Top, PA 18707
|
- sq. feet
|
2 baths 3 beds |
show details | |

|
#2
Nuangola Rd
Mountain Top, PA 18707
|
- sq. feet
|
- baths - beds |
show details | |

|
#3
Blytheburn Rd
Mountain Top, PA 18707
|
1,776 sq. feet
|
- baths - beds |
show details | |

|
#4
Gracedale Ave
Mountain Top, PA 18707
|
1,394 sq. feet
|
- baths - beds |
show details | |

|
#5
Blytheburn Rd
Mountain Top, PA 18707
|
2,028 sq. feet
|
- baths - beds |
show details | |

|
#6
Red Maple Ave
Mountain Top, PA 18707
|
- sq. feet
|
- baths - beds |
show details | |

|
#7
Sherwood Dr
Mountain Top, PA 18707
|
- sq. feet
|
- baths - beds |
show details | |

|
#8
Deer Run Dr
Mountain Top, PA 18707
|
- sq. feet
|
- baths - beds |
show details | |

|
#9
Ice Lake Dr
Mountain Top, PA 18707
|
- sq. feet
|
- baths - beds |
show details | |

|
#10
Church Rd
Mountain Top, PA 18707
|
- sq. feet
|
- baths - beds |
show details |
| Photo | Address | Area | Beds / Baths | Price | Details |
|---|---|---|---|---|---|

|
#11
Summit View Dr
Mountain Top, PA 18707
|
- sq. feet
|
- baths - beds |
show details | |

|
#12
Blytheburn Rd
Mountain Top, PA 18707
|
- sq. feet
|
- baths - beds |
show details | |

|
#13
Valley Stream Park
Mountain Top, PA 18707
|
- sq. feet
|
- baths - beds |
show details | |

|
#14
Nuangola Rd
Mountain Top, PA 18707
|
- sq. feet
|
- baths - beds |
show details | |

|
#15
Church Rd
Mountain Top, PA 18707
|
- sq. feet
|
- baths - beds |
show details | |

|
#16
Summit Rd
Mountain Top, PA 18707
|
- sq. feet
|
- baths - beds |
show details | |

|
#17
Burma Rd
Mountain Top, PA 18707
|
- sq. feet
|
- baths - beds |
show details | |

|
#18
Walden Dr
Mountain Top, PA 18707
|
- sq. feet
|
- baths - beds |
show details | |

|
#19
Elm St
Mountain Top, PA 18707
|
- sq. feet
|
- baths - beds |
show details | |

|
#20
Grandview Ave
Mountain Top, PA 18707
|
- sq. feet
|
- baths - beds |
show details |
| Photo | Address | Area | Beds / Baths | Price | Details |
|---|---|---|---|---|---|

|
#21
Red Coat Ln
Mountain Top, PA 18707
|
- sq. feet
|
- baths - beds |
show details | |

|
#22
Forest Rd
Mountain Top, PA 18707
|
- sq. feet
|
- baths - beds |
show details | |

|
#23
Vandermark Ave
Mountain Top, PA 18707
|
- sq. feet
|
- baths - beds |
show details | |

|
#24
Lee Ave
Mountain Top, PA 18707
|
- sq. feet
|
- baths - beds |
show details | |

|
#25
Blytheburn Rd
Mountain Top, PA 18707
|
- sq. feet
|
- baths - beds |
show details | |

|
#26
Woodlawn Ave
Mountain Top, PA 18707
|
- sq. feet
|
- baths - beds |
show details | |

|
#27
Church Rd
Mountain Top, PA 18707
|
- sq. feet
|
- baths - beds |
show details | |

|
Check over 1 million property listings on Foreclosure.com!
|
browse all offers | |||


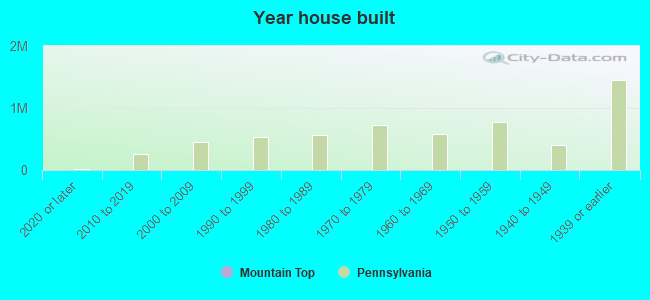
Median year apartment built: 1979
Household type by relationship:
Households: 11,826- Male householders: 2,208 (315 living alone), Female householders: 2,117 (358 living alone)
2,656 spouses (2,640 opposite-sex spouses), 245 unmarried partners, (224 opposite-sex unmarried partners), 4,007 children (3,758 natural, 194 adopted, 55 stepchildren), 118 grandchildren, 38 brothers or sisters, 114 parents, 6 foster children, 46 other relatives, 78 non-relatives
- In group quarters: 188
Size of family households: 1,341 2-persons, 1,086 3-persons, 898 4-persons, 156 5-persons, 24 6-persons, 20 7-or-more-persons.
Size of nonfamily households: 649 1-person, 216 2-persons.
1,853 married couples with children.
898 single-parent households (143 men, 755 women).
91.5% of residents of Mountain Top speak English at home.
1.7% of residents speak Spanish at home (55% speak English very well, 14% speak English well, 29% speak English not well, 2% don't speak English at all).
4.5% of residents speak other Indo-European language at home (66% speak English very well, 30% speak English well, 4% speak English not well).
1.8% of residents speak Asian or Pacific Island language at home (54% speak English very well, 17% speak English well, 29% speak English not well).
Foreign born population: 794 (6.7%)
(87.8% of them are naturalized citizens)
| Here: | 7.5 |
| State: | 6.8 |
| Here: | 5.8 |
| State: | 4.3 |
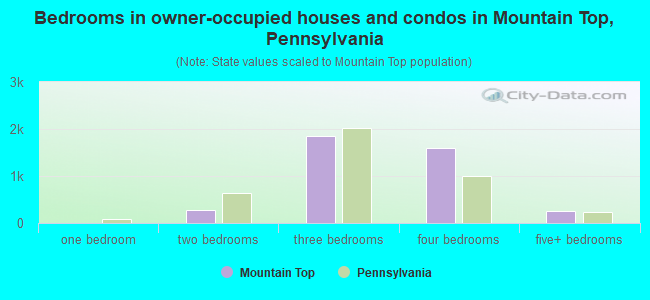
- Bedrooms in owner-occupied houses and condos in Mountain Top, Pennsylvania
- 0no bedroom
- 01 bedroom
- 2762 bedrooms
- 1,8563 bedrooms
- 1,5984 bedrooms
- 2515+ bedrooms
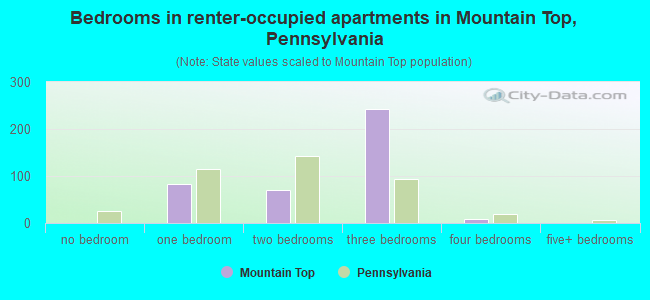
- Bedrooms in renter-occupied apartments in Mountain Top, Pennsylvania
- 0no bedroom
- 831 bedroom
- 712 bedrooms
- 2433 bedrooms
- 84 bedrooms
- 05+ bedrooms
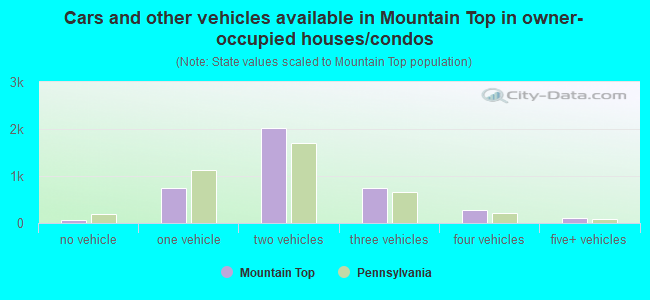
- Cars and other vehicles available in Mountain Top in owner-occupied houses/condos
- 70no vehicle
- 7551 vehicle
- 2,0252 vehicles
- 7503 vehicles
- 2664 vehicles
- 1155+ vehicles
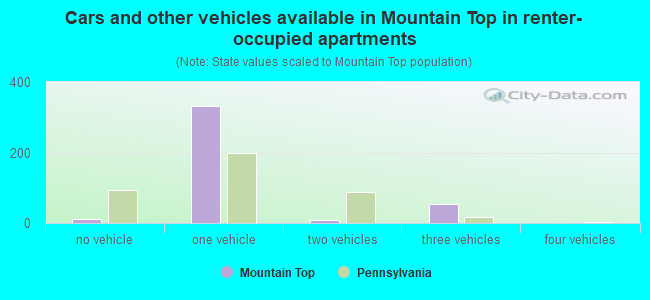
- Cars and other vehicles available in Mountain Top in renter-occupied apartments
- 12no vehicle
- 3331 vehicle
- 82 vehicles
- 533 vehicles
- 04 vehicles
- 05+ vehicles
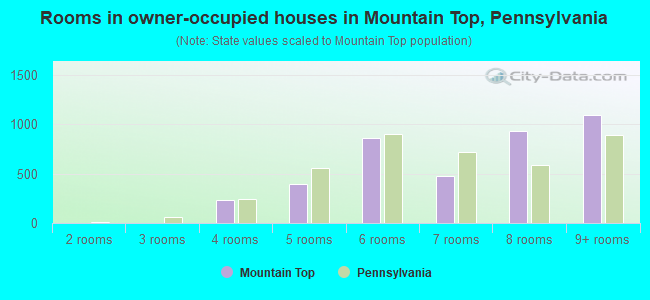
- Rooms in owner-occupied houses in Mountain Top, Pennsylvania
- 01 room
- 02 rooms
- 03 rooms
- 2314 rooms
- 3975 rooms
- 8566 rooms
- 4757 rooms
- 9318 rooms
- 1,0919+ rooms
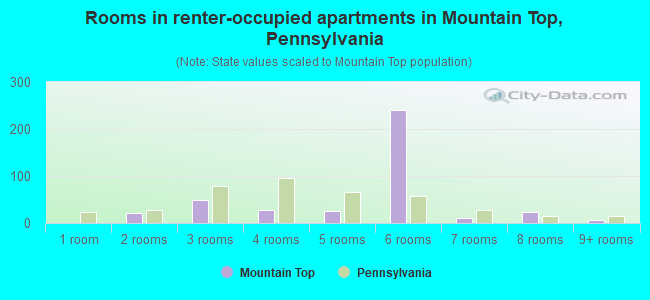
- Rooms in renter-occupied apartments in Mountain Top, Pennsylvania
- 01 room
- 222 rooms
- 483 rooms
- 284 rooms
- 255 rooms
- 2416 rooms
- 117 rooms
- 238 rooms
- 69+ rooms
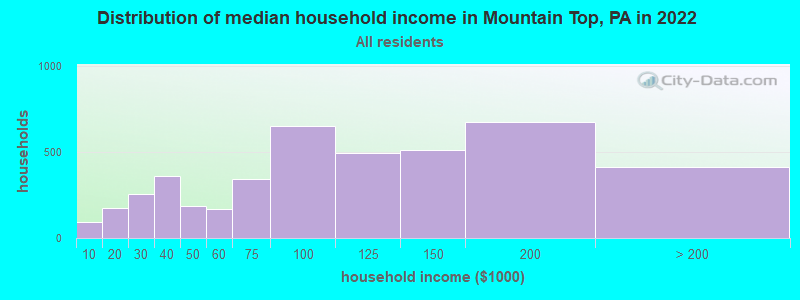
Mountain Top, PA household income distribution

- 91Less than $10,000
- 175$10,000 to $19,999
- 254$20,000 to $29,999
- 363$30,000 to $39,999
- 187$40,000 to $49,999
- 168$50,000 to $59,999
- 341$60,000 to $74,999
- 652$75,000 to $99,999
- 497$100,000 to $124,999
- 512$125,000 to $149,999
- 676$150,000 to $199,999
- 413$200,000 or more
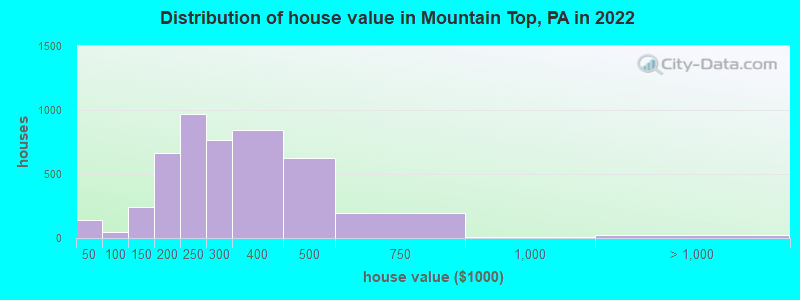
Home value of owner - occupied houses in 2022 in Mountain Top, PA
-
- 24Less than $10,000
- 36$10,000 to $14,999
- 28$20,000 to $24,999
- 4$30,000 to $34,999
- 30$35,000 to $39,999
- 18$40,000 to $49,999
- 7$70,000 to $79,999
- 9$80,000 to $89,999
- 11$90,000 to $99,999
- 102$100,000 to $124,999
- 140$125,000 to $149,999
- 364$150,000 to $174,999
- 298$175,000 to $199,999
- 967$200,000 to $249,999
- 767$250,000 to $299,999
- 847$300,000 to $399,999
- 623$400,000 to $499,999
- 195$500,000 to $749,999
- 11$750,000 to $999,999
- 19$2,000,000 or more
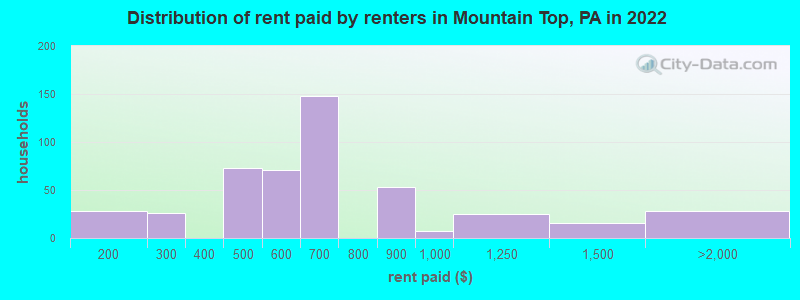
Rent paid by renters in 2022 in Mountain Top, PA
-
- 12$100 to $149
- 15$150 to $199
- 25$200 to $249
- 73$400 to $449
- 71$500 to $549
- 147$600 to $649
- 53$800 to $899
- 6$900 to $999
- 25$1,000 to $1,249
- 16$1,250 to $1,499
- 27$1,500 to $1,999
- 1No cash rent
Percentage of workers working in this county: 86.4%
Number of people working at home: 1,047 (16.8% of all workers)
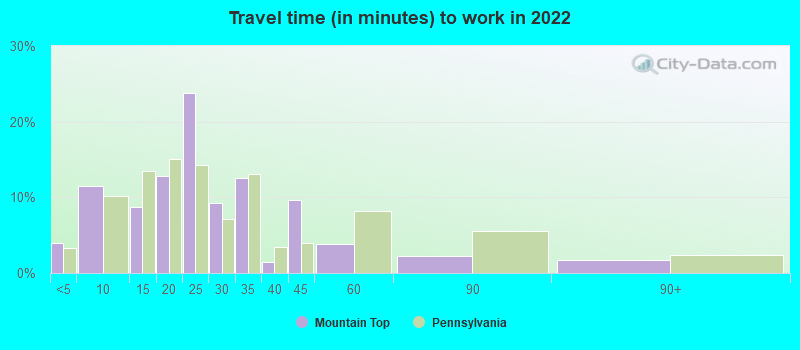
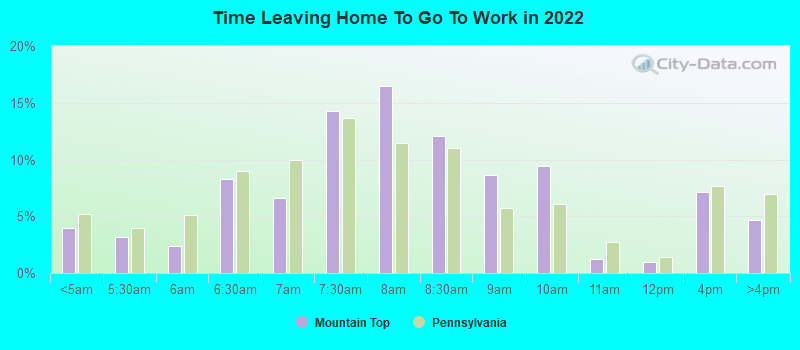
Travel time to work (commute)
- Less than 5 minutes: 174
- 5 to 9 minutes: 531
- 10 to 14 minutes: 456
- 15 to 19 minutes: 694
- 20 to 24 minutes: 951
- 25 to 29 minutes: 781
- 30 to 34 minutes: 813
- 35 to 39 minutes: 92
- 40 to 44 minutes: 293
- 45 to 59 minutes: 228
- 60 to 89 minutes: 184
- 90 or more minutes: 144
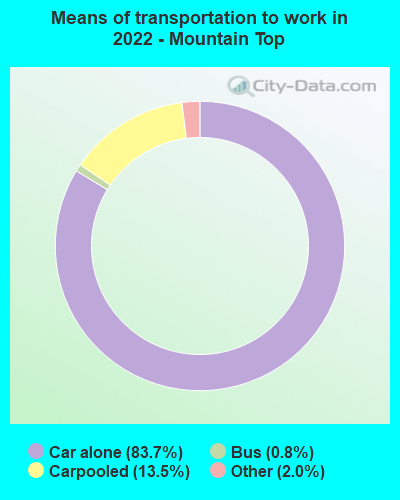
Means of transportation to work:
- Drove a car alone: 4,559 (70.5%)
- Carpooled: 782 (12.1%)
- Bus: 39 (0.6%)
- Taxi: 133 (2.1%)
- Worked at home: 1,047 (16.2%)
- Unemployment by race in 2022
- Unemployment rate for White non-Hispanic residents
- 2.2%Males
- 3.3%Females
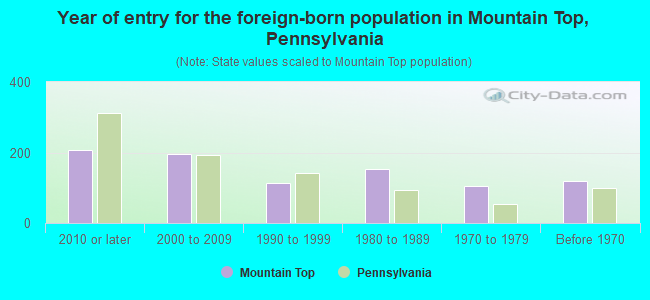
- Year of entry for the foreign-born population in Mountain Top, Pennsylvania
- 2072010 or later
- 1962000 to 2009
- 1141990 to 1999
- 1521980 to 1989
- 1051970 to 1979
- 120Before 1970
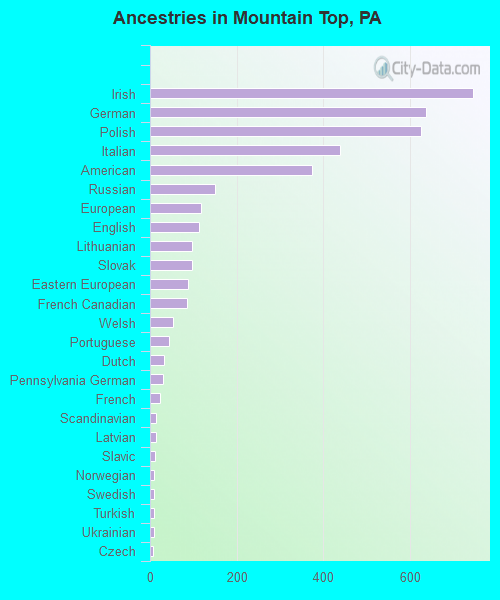
First ancestries reported:
- Irish: 745 (15.5%)
- German: 637 (13.3%)
- Polish: 626 (13.0%)
- Italian: 439 (9.1%)
- American: 374 (7.8%)
- Russian: 149 (3.1%)
- European: 117 (2.4%)
- English: 114 (2.4%)
- Lithuanian: 97 (2.0%)
- Slovak: 96 (2.0%)
- Eastern European: 88 (1.8%)
- French Canadian: 85 (1.8%)
- Welsh: 54 (1.1%)
- Portuguese: 43 (0.9%)
- Dutch: 32 (0.7%)
- Pennsylvania German: 30 (0.6%)
- French: 24 (0.5%)
- Scandinavian: 14 (0.3%)
- Latvian: 13 (0.3%)
- Slavic: 11 (0.2%)
- Norwegian: 10 (0.2%)
- Swedish: 10 (0.2%)
- Turkish: 10 (0.2%)
- Ukrainian: 10 (0.2%)
- Czech: 8 (0.2%)
- Greek: 8 (0.2%)
- Lebanese: 6 (0.1%)
- Australian: 6 (0.1%)
- Hungarian: 6 (0.1%)
- Jamaican: 4 (0.08%)
- British: 3 (0.06%)
Most common places of birth for foreign-born residents (%):
| Mountain Top: | 22.1% (174) |
| Pennsylvania: | 10.7% (100,596) |
| Mountain Top: | 9.4% (74) |
| Pennsylvania: | 7.2% (67,704) |
| Mountain Top: | 8.6% (68) |
| Pennsylvania: | 1.2% (11,211) |
| Mountain Top: | 7.4% (58) |
| Pennsylvania: | 0.6% (5,742) |
| Mountain Top: | 7.2% (57) |
| Pennsylvania: | 0.2% (1,487) |
| Mountain Top: | 3.7% (29) |
| Pennsylvania: | 2.9% (27,433) |
| Mountain Top: | 3.4% (27) |
| Pennsylvania: | 2.2% (21,039) |
| Mountain Top: | 3.2% (25) |
| Pennsylvania: | 0.2% (1,956) |
| Mountain Top: | 3.0% (24) |
| Pennsylvania: | 0.1% (908) |
| Mountain Top: | 2.8% (22) |
| Pennsylvania: | 0.1% (1,033) |
| Mountain Top: | 2.7% (21) |
| Pennsylvania: | 0.9% (8,772) |
| Mountain Top: | 2.4% (19) |
| Pennsylvania: | 1.8% (16,884) |
| Mountain Top: | 1.6% (13) |
| Pennsylvania: | 1.9% (18,065) |
| Mountain Top: | 1.5% (12) |
| Pennsylvania: | 1.3% (12,172) |
| Mountain Top: | 1.5% (12) |
| Pennsylvania: | 1.4% (13,268) |
Place of birth for U.S.-born residents:
- This state: 8,736
- Other state: 2,051
- Northeast: 1,280
- Midwest: 205
- South: 458
- West: 91
95.0% of Mountain Top residents lived in the same house 1 years ago.
Out of people who lived in different houses, 40.1% lived in this county.
Out of people who lived in different counties, 47.6% lived in Pennsylvania.
| Mountain Top: | 95.0% |
| State average: | 89.3% |
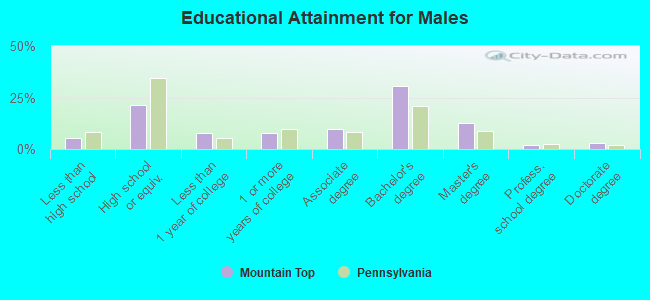
Education attainment for males 25 years and older:
- No schooling: 109
- Nursery to 4th grade: 0
- 5th and 6th grade: 2
- 7th and 8th grade: 0
- 9th grade: 10
- 10th grade: 47
- 11th grade: 23
- 12th grade, no diploma: 21
- High school graduate (or equivalency): 839
- Less than 1 year of college: 297
- Some college more than 1 year, no degree: 299
- Associate degree: 386
- Bachelor's degree: 1,188
- Master's degree: 491
- Professional school degree: 74
- Doctorate degree: 109
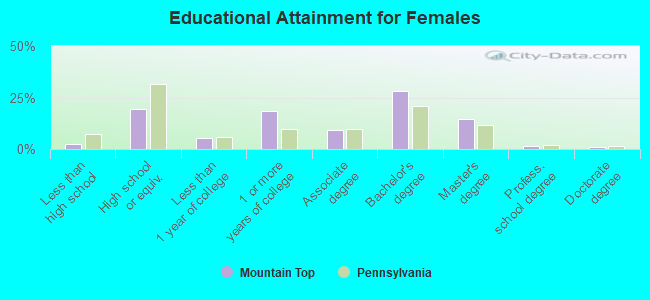
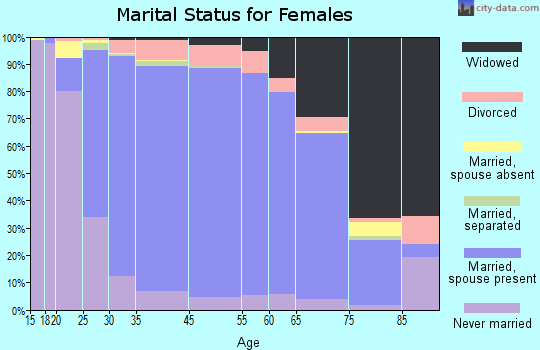
Education attainment for females 25 years and older:
- No schooling: 30
- Nursery to 4th grade: 0
- 5th and 6th grade: 0
- 7th and 8th grade: 9
- 9th grade: 4
- 10th grade: 35
- 11th grade: 2
- 12th grade, no diploma: 13
- High school graduate (or equivalency): 817
- Less than 1 year of college: 224
- Some college more than 1 year, no degree: 775
- Associate degree: 382
- Bachelor's degree: 1,184
- Master's degree: 616
- Professional school degree: 66
- Doctorate degree: 36
Housing units in structures:
- One, detached: 3,775
- One, attached: 329
- Two: 24
- 3 or 4: 151
- 5 to 9: 19
- Mobile homes: 168
Median worth of mobile homes: $32,001
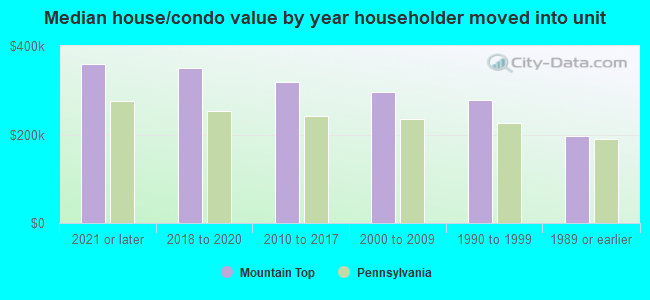
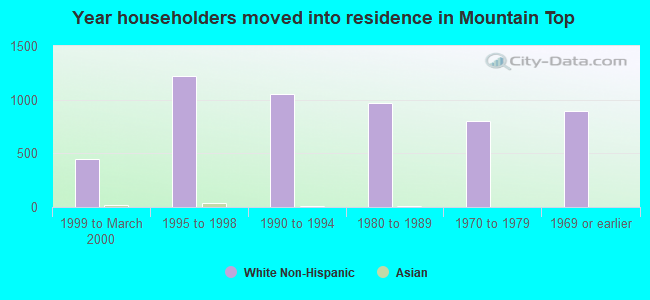
House/condo owner moved in on average 13 years ago
Renter moved in on average 5 years ago
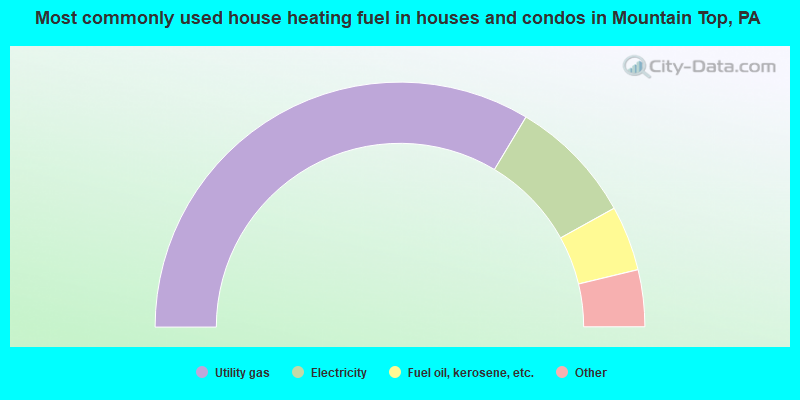
- 67.2%Utility gas
- 16.7%Electricity
- 8.6%Fuel oil, kerosene, etc.
- 3.4%Bottled, tank, or LP gas
- 2.2%Coal or coke
- 1.4%Other fuel
- 0.3%Wood
- 0.1%No fuel used
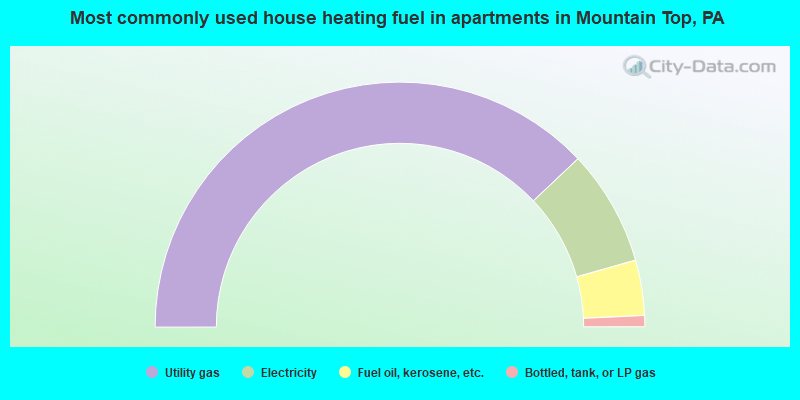
- 75.9%Utility gas
- 15.3%Electricity
- 7.3%Fuel oil, kerosene, etc.
- 1.5%Bottled, tank, or LP gas
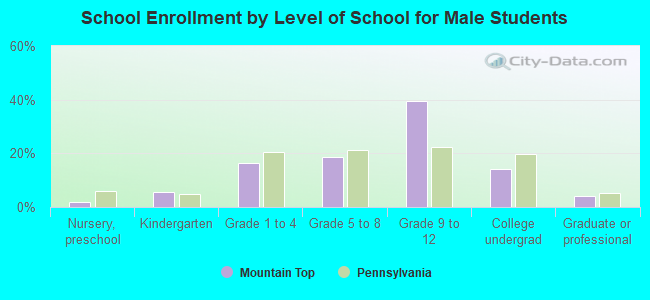
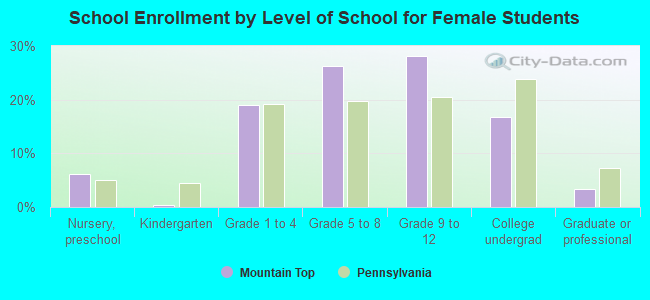
Private vs. public school enrollment:
| Here: | 17.7% |
| Pennsylvania: | 15.7% |
| Here: | 6.1% |
| Pennsylvania: | 13.4% |
| Here: | 53.8% |
| Pennsylvania: | 39.8% |