Mount Olympus, UT (Utah) Houses and Residents
| Mount Olympus: | $915,921 |
| Utah: | $499,500 |
Total population: 7,902 (Urban population: 6,554, Rural population: 280 (all nonfarm))
Houses: 2,604 (2,541 occupied: 2,422 owner occupied, 119 renter occupied)
| % of renters here: | 5% |
| State: | 29% |
Housing density: 769 houses/condos per square mile
Median price asked for vacant for-sale houses and condos in 2022 in this county: $719,617.
Median contract rent in 2022: over $2,000 (lower quartile is $1,591, upper quartile is over $2,000)
Median rent asked for vacant for-rent units in 2022: $1,690
Median gross rent in Mount Olympus, UT in 2022: over $2,000
Housing units in Mount Olympus with a mortgage: 1,477 (174 second mortgage, 179 home equity loan, 0 both second mortgage and home equity loan)
Houses without a mortgage: 838
Compare current foreclosures near Mount Olympus, UT:
| Photo | Address | Area | Beds / Baths | Price | Details |
|---|---|---|---|---|---|

|
#1
E Downington Ave
Salt Lake City, UT 84108
|
2,580 sq. feet
|
2 baths 1 beds |
$949,900
|
show details |

|
#2
S Holladay Cir
Salt Lake City, UT 84117
|
2,440 sq. feet
|
2 baths 4 beds |
$799,900
|
show details |

|
#3
S Cascade Way
Salt Lake City, UT 84109
|
1,185 sq. feet
|
1 baths 5 beds |
show details | |

|
#4
S Interlochin Ln
West Jordan, UT 84084
|
2,054 sq. feet
|
2 baths 3 beds |
show details | |

|
#5
Ashley Ridge Rd
Sandy, UT 84092
|
2,661 sq. feet
|
2 baths 6 beds |
show details | |

|
#6
S Solano Cir
Salt Lake City, UT 84120
|
1,009 sq. feet
|
2 baths 5 beds |
show details | |

|
#7
W 300 S
Salt Lake City, UT 84104
|
1,313 sq. feet
|
1 baths 3 beds |
show details | |

|
#8
S Sorrento Way
West Jordan, UT 84081
|
1,332 sq. feet
|
2 baths 4 beds |
show details | |

|
#9
W 3500 S Ste 5040w
Salt Lake City, UT 84119
|
736 sq. feet
|
2 baths 3 beds |
show details | |

|
#10
E Wilson Ave
Salt Lake City, UT 84105
|
950 sq. feet
|
1 baths 3 beds |
show details |
| Photo | Address | Area | Beds / Baths | Price | Details |
|---|---|---|---|---|---|

|
#11
Mankato St
Herriman, UT 84096
|
1,468 sq. feet
|
2 baths 3 beds |
show details | |

|
#12
W Heath Ave
Salt Lake City, UT 84118
|
979 sq. feet
|
1 baths 5 beds |
show details | |

|
#13
Jerema Ct
Draper, UT 84020
|
3,996 sq. feet
|
4 baths 6 beds |
show details | |

|
#14
E Evelyn Dr
Salt Lake City, UT 84124
|
2,560 sq. feet
|
4 baths 4 beds |
show details | |

|
#15
W 6785 S
West Jordan, UT 84084
|
1,516 sq. feet
|
1 baths 3 beds |
show details | |

|
#16
W 3800 S
Salt Lake City, UT 84119
|
2,050 sq. feet
|
2 baths 3 beds |
show details | |

|
#17
Eagle Crest Dr
Draper, UT 84020
|
3,711 sq. feet
|
4 baths 4 beds |
show details | |

|
#18
W 5780 S
Salt Lake City, UT 84129
|
1,100 sq. feet
|
1 baths 1 beds |
show details | |

|
#19
S 4340 W
Salt Lake City, UT 84118
|
1,176 sq. feet
|
2 baths 3 beds |
show details | |

|
#20
W Aspen Springs Dr
Herriman, UT 84096
|
1,334 sq. feet
|
2 baths 2 beds |
show details |
| Photo | Address | Area | Beds / Baths | Price | Details |
|---|---|---|---|---|---|

|
#21
S Nielsen Way
Salt Lake City, UT 84119
|
2,598 sq. feet
|
4 baths 4 beds |
show details | |

|
#22
W 400 N
Salt Lake City, UT 84116
|
1,200 sq. feet
|
1 baths 2 beds |
show details | |

|
#23
W 7705 S
West Jordan, UT 84084
|
2,638 sq. feet
|
1 baths 6 beds |
show details | |

|
#24
Westfield Cir
West Jordan, UT 84084
|
1,032 sq. feet
|
1 baths 3 beds |
show details | |

|
#25
W 3615 S
Salt Lake City, UT 84119
|
1,712 sq. feet
|
1 baths 5 beds |
show details | |

|
#26
S Huntington Rd
Salt Lake City, UT 84129
|
1,614 sq. feet
|
1 baths 4 beds |
show details | |

|
#27
S 3450 W
Salt Lake City, UT 84119
|
1,664 sq. feet
|
2 baths 4 beds |
show details | |

|
#28
S Bay Meadows Dr
Sandy, UT 84092
|
2,382 sq. feet
|
3 baths 5 beds |
show details | |

|
#29
W 8600 S
West Jordan, UT 84088
|
2,172 sq. feet
|
4 baths 5 beds |
show details | |

|
#30
W 12120 S
Riverton, UT 84065
|
1,572 sq. feet
|
2 baths 3 beds |
show details |
| Photo | Address | Area | Beds / Baths | Price | Details |
|---|---|---|---|---|---|

|
#31
S Firenze Pl
West Jordan, UT 84081
|
1,537 sq. feet
|
2 baths 3 beds |
show details | |

|
#32
W Crus Corvi Rd
West Jordan, UT 84081
|
1,498 sq. feet
|
1 baths 3 beds |
show details | |

|
#33
S Wakefield Way
West Jordan, UT 84081
|
2,462 sq. feet
|
2 baths 6 beds |
show details | |

|
#34
S 2345 W
West Jordan, UT 84084
|
1,600 sq. feet
|
2 baths 3 beds |
show details | |

|
#35
W Tess Ave
Salt Lake City, UT 84119
|
1,186 sq. feet
|
1 baths 3 beds |
show details | |

|
#36
W Table Rock Dr
Salt Lake City, UT 84129
|
2,574 sq. feet
|
3 baths 4 beds |
show details | |

|
#37
W 4700 S
Salt Lake City, UT 84129
|
1,890 sq. feet
|
2 baths 4 beds |
show details | |

|
#38
S Far Vista Dr
Salt Lake City, UT 84118
|
1,275 sq. feet
|
2 baths 3 beds |
show details | |

|
#39
S 3400 W
Salt Lake City, UT 84119
|
1,425 sq. feet
|
1 baths 3 beds |
show details | |

|
#40
W 500 N
Salt Lake City, UT 84116
|
1,368 sq. feet
|
1 baths 3 beds |
show details |
| Photo | Address | Area | Beds / Baths | Price | Details |
|---|---|---|---|---|---|

|
#41
S Mckinley Ln
Salt Lake City, UT 84129
|
2,700 sq. feet
|
2 baths 4 beds |
show details | |

|
#42
S 5170 W
West Jordan, UT 84081
|
1,717 sq. feet
|
3 baths 4 beds |
show details | |

|
#43
W 3440 S
Salt Lake City, UT 84119
|
570 sq. feet
|
1 baths 3 beds |
show details | |

|
#44
S Sorensen Cir
Salt Lake City, UT 84129
|
1,808 sq. feet
|
2 baths 3 beds |
show details | |

|
#45
W Brookway Dr
Salt Lake City, UT 84119
|
1,234 sq. feet
|
2 baths 3 beds |
show details | |

|
#46
W 7095 S
West Jordan, UT 84084
|
2,000 sq. feet
|
3 baths 3 beds |
show details | |

|
#47
E Hibiscus Ave
Sandy, UT 84094
|
1,554 sq. feet
|
2 baths 5 beds |
show details | |

|
#48
W 400 S
Salt Lake City, UT 84104
|
1,020 sq. feet
|
1 baths 3 beds |
show details | |

|
#49
S 2855 W
Salt Lake City, UT 84119
|
1,170 sq. feet
|
1 baths 2 beds |
show details | |

|
Check over 1 million property listings on Foreclosure.com!
|
browse all offers | |||

 | Black in SLC (154 replies) |
| Possible relocation to Salt Lake Citt area. (10 replies) |
| Holladay vs E Millcreek (13 replies) |
| Moving from Tampa FL to SLC Utah... (23 replies) |
| Which neighbors/schools for non-LDS Asian kids? (15 replies) |
| Moving from VA to Salt Lake City (10 replies) |

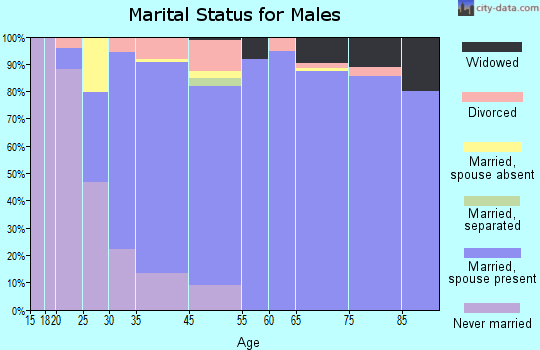
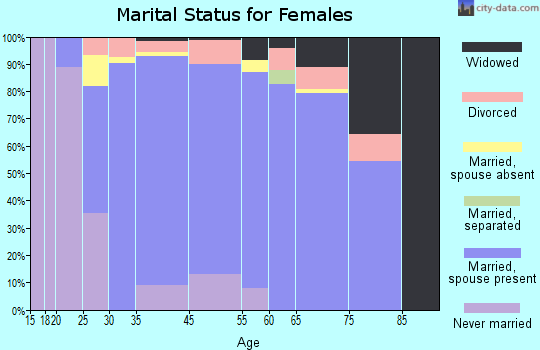
Household type by relationship:
Households: 1,015,649- In family households: 879,880 (178,461 male householders, 64,165 female householders)
187,678 spouses, 347,268 children (321,676 natural, 9,572 adopted, 16,020 stepchildren), 25,511 grandchildren, 12,209 brothers or sisters, 7,940 parents, foster children, 18,887 other relatives, 27,608 non-relatives
- In nonfamily households: 135,769 (49,607 male householders (35,052 living alone)), 50,389 female householders (40,012 living alone)), 35,773 nonrelatives
- In group quarters: 14,006 (9,420 institutionalized population)
205,311 married couples with children.
43,285 single-parent households (10,357 men, 32,928 women).
89.6% of residents of Mount Olympus speak English at home.
2.3% of residents speak Spanish at home (90% speak English very well, 5% speak English well, 5% speak English not well).
5.5% of residents speak other Indo-European language at home (88% speak English very well, 5% speak English well, 7% speak English not well).
2.5% of residents speak Asian or Pacific Island language at home (47% speak English very well, 38% speak English well, 16% speak English not well).
0.2% of residents speak other language at home (100% speak English very well).
Foreign born population: 972 (10.8%)
(100.8% of them are naturalized citizens)
| Here: | 8.7 |
| State: | 7.6 |
| Here: | 9.3 |
| State: | 4.3 |
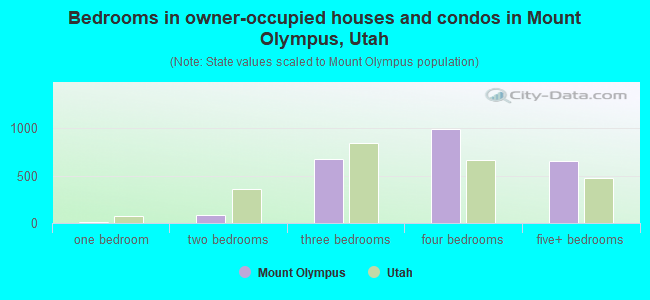
- Bedrooms in owner-occupied houses and condos in Mount Olympus, Utah
- 0no bedroom
- 71 bedroom
- 882 bedrooms
- 6753 bedrooms
- 9934 bedrooms
- 6595+ bedrooms
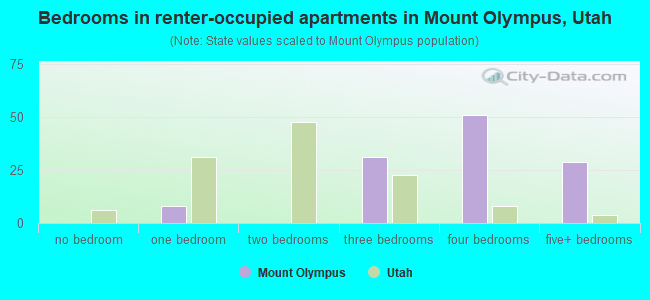
- Bedrooms in renter-occupied apartments in Mount Olympus, Utah
- 0no bedroom
- 81 bedroom
- 02 bedrooms
- 313 bedrooms
- 514 bedrooms
- 295+ bedrooms
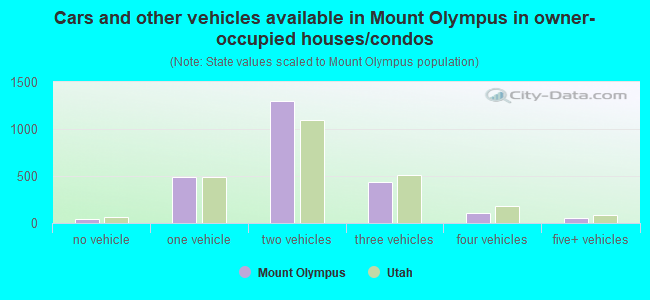
- Cars and other vehicles available in Mount Olympus in owner-occupied houses/condos
- 42no vehicle
- 4861 vehicle
- 1,2992 vehicles
- 4363 vehicles
- 1024 vehicles
- 575+ vehicles
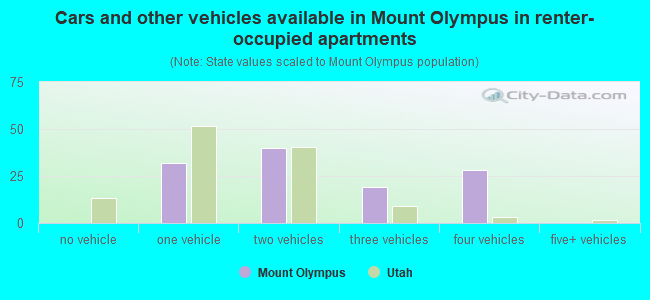
- Cars and other vehicles available in Mount Olympus in renter-occupied apartments
- 0no vehicle
- 321 vehicle
- 402 vehicles
- 193 vehicles
- 284 vehicles
- 05+ vehicles
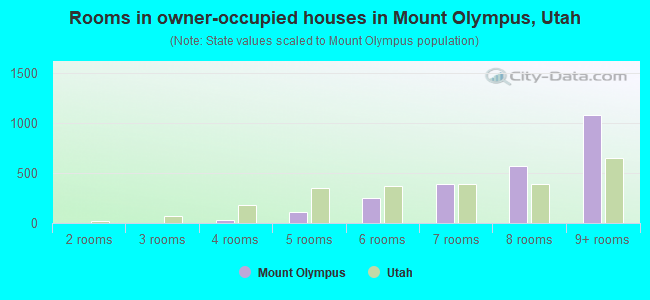
- Rooms in owner-occupied houses in Mount Olympus, Utah
- 01 room
- 02 rooms
- 03 rooms
- 284 rooms
- 1075 rooms
- 2496 rooms
- 3857 rooms
- 5748 rooms
- 1,0799+ rooms
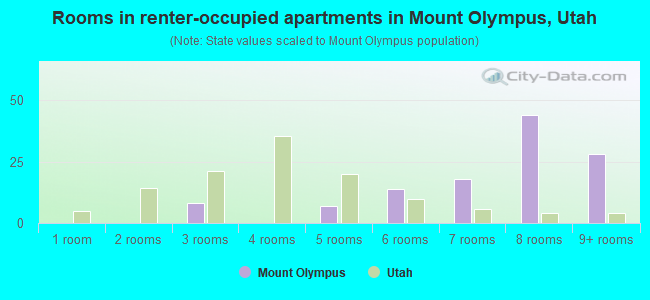
- Rooms in renter-occupied apartments in Mount Olympus, Utah
- 01 room
- 02 rooms
- 83 rooms
- 04 rooms
- 75 rooms
- 146 rooms
- 187 rooms
- 448 rooms
- 289+ rooms
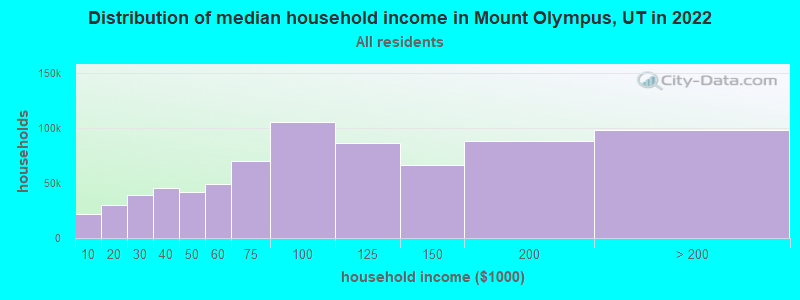
Mount Olympus, UT household income distribution

- 21,456Less than $10,000
- 30,066$10,000 to $19,999
- 39,076$20,000 to $29,999
- 45,429$30,000 to $39,999
- 41,957$40,000 to $49,999
- 49,158$50,000 to $59,999
- 69,926$60,000 to $74,999
- 105,531$75,000 to $99,999
- 86,715$100,000 to $124,999
- 66,323$125,000 to $149,999
- 88,637$150,000 to $199,999
- 98,525$200,000 or more
Percentage of workers working in this county: 94.1%
Number of people working at home: 898 (19.0% of all workers)
Travel time to work (commute)
- Less than 5 minutes: 46
- 5 to 9 minutes: 217
- 10 to 14 minutes: 378
- 15 to 19 minutes: 589
- 20 to 24 minutes: 983
- 25 to 29 minutes: 262
- 30 to 34 minutes: 364
- 35 to 39 minutes: 21
- 40 to 44 minutes: 24
- 45 to 59 minutes: 45
- 60 to 89 minutes: 34
- 90 or more minutes: 47
Means of transportation to work:
- Drove a car alone: 2,700 (83.6%)
- Carpooled: 223 (6.9%)
- Bus or trolley bus: 62 (1.9%)
- Walked: 3 (0.1%)
- Other means: 22 (0.7%)
- Worked at home: 221 (6.8%)
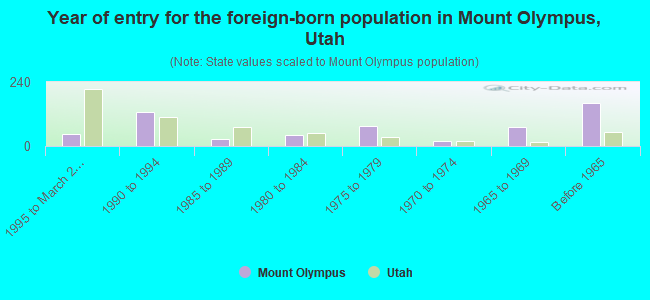
- Year of entry for the foreign-born population in Mount Olympus, Utah
- 461995 to March 2000
- 1261990 to 1994
- 251985 to 1989
- 431980 to 1984
- 751975 to 1979
- 191970 to 1974
- 721965 to 1969
- 161Before 1965
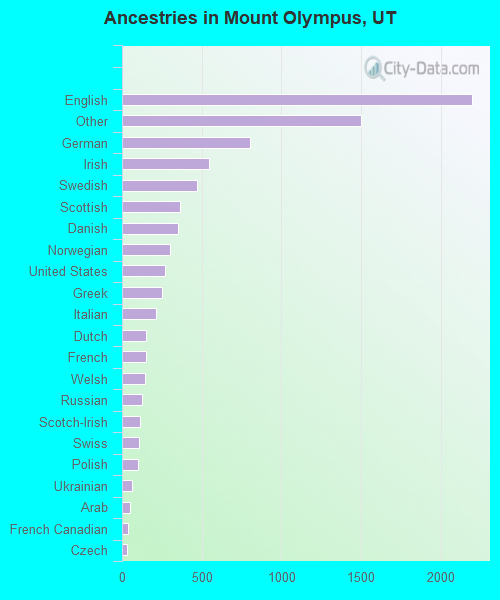
First ancestries reported:
- English: 2,194 (26.2%)
- Other: 1,501 (17.9%)
- German: 805 (9.6%)
- Irish: 547 (6.5%)
- Swedish: 470 (5.6%)
- Scottish: 361 (4.3%)
- Danish: 353 (4.2%)
- Norwegian: 301 (3.6%)
- United States: 272 (3.2%)
- Greek: 252 (3.0%)
- Italian: 211 (2.5%)
- Dutch: 151 (1.8%)
- French: 151 (1.8%)
- Welsh: 147 (1.8%)
- Russian: 125 (1.5%)
- Scotch-Irish: 114 (1.4%)
- Swiss: 106 (1.3%)
- Polish: 103 (1.2%)
- Ukrainian: 61 (0.7%)
- Arab: 50 (0.6%)
- French Canadian: 35 (0.4%)
- Czech: 33 (0.4%)
- Portuguese: 11 (0.1%)
- Hungarian: 9 (0.1%)
- Slovak: 7 (0.08%)
- Lithuanian: 5 (0.06%)
- West Indian: 4 (0.05%)
Most common places of birth for foreign-born residents (%):
| Mount Olympus: | 10.8% (61) |
| Utah: | 2.0% (3,195) |
| Mount Olympus: | 9.5% (54) |
| Utah: | 4.9% (7,722) |
| Mount Olympus: | 9.0% (51) |
| Utah: | 1.0% (1,655) |
| Mount Olympus: | 8.1% (46) |
| Utah: | 3.2% (5,086) |
| Mount Olympus: | 7.9% (45) |
| Utah: | 3.0% (4,784) |
| Mount Olympus: | 7.2% (41) |
| Utah: | 0.3% (523) |
| Mount Olympus: | 6.5% (37) |
| Utah: | 0.3% (518) |
| Mount Olympus: | 5.8% (33) |
| Utah: | 1.9% (3,013) |
| Mount Olympus: | 4.8% (27) |
| Utah: | 1.6% (2,507) |
| Mount Olympus: | 3.4% (19) |
| Utah: | 0.3% (460) |
| Mount Olympus: | 3.4% (19) |
| Utah: | 0.6% (983) |
| Mount Olympus: | 2.8% (16) |
| Utah: | 0.2% (339) |
| Mount Olympus: | 2.8% (16) |
| Utah: | 0.5% (865) |
| Mount Olympus: | 2.3% (13) |
| Utah: | 0.7% (1,098) |
| Mount Olympus: | 2.1% (12) |
| Utah: | 41.9% (66,478) |
| Mount Olympus: | 1.8% (10) |
| Utah: | 1.3% (2,030) |
| Mount Olympus: | 1.8% (10) |
| Utah: | 3.1% (4,920) |
| Mount Olympus: | 1.6% (9) |
| Utah: | 0.5% (839) |
| Mount Olympus: | 1.6% (9) |
| Utah: | 0.3% (495) |
| Mount Olympus: | 1.6% (9) |
| Utah: | 1.2% (1,908) |
Place of birth for U.S.-born residents:
- This state: 3,476
- Other state: 2,707
- Northeast: 540
- Midwest: 702
- South: 514
- West: 951
69% of Mount Olympus residents lived in the same house 5 years ago.
Out of people who lived in different houses, 66% lived in this county.
Out of people who lived in different counties, 5% lived in Utah.
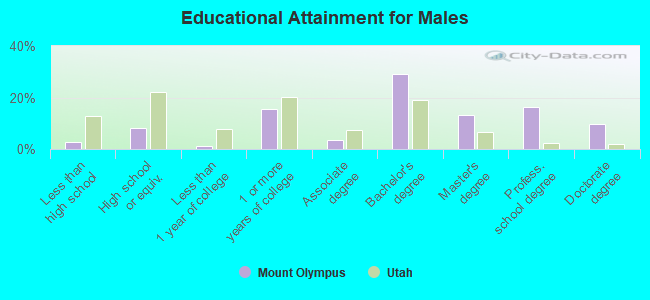
Education attainment for males 25 years and older:
- No schooling: 16
- Nursery to 4th grade: 0
- 5th and 6th grade: 0
- 7th and 8th grade: 0
- 9th grade: 7
- 10th grade: 21
- 11th grade: 13
- 12th grade, no diploma: 7
- High school graduate (or equivalency): 188
- Less than 1 year of college: 29
- Some college more than 1 year, no degree: 357
- Associate degree: 82
- Bachelor's degree: 670
- Master's degree: 306
- Professional school degree: 372
- Doctorate degree: 227
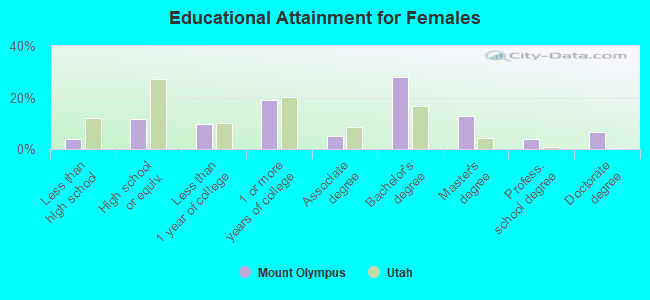
Education attainment for females 25 years and older:
- No schooling: 0
- Nursery to 4th grade: 9
- 5th and 6th grade: 26
- 7th and 8th grade: 8
- 9th grade: 0
- 10th grade: 16
- 11th grade: 7
- 12th grade, no diploma: 32
- High school graduate (or equivalency): 289
- Less than 1 year of college: 238
- Some college more than 1 year, no degree: 470
- Associate degree: 124
- Bachelor's degree: 701
- Master's degree: 317
- Professional school degree: 92
- Doctorate degree: 166
Housing units in structures:
- One, detached: 2,580
- One, attached: 7
- Two: 12
- Boats, RVs, vans, etc.: 5
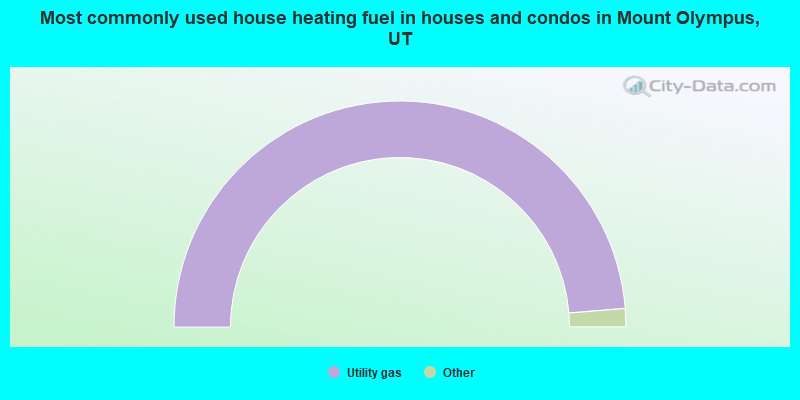
- 97.4%Utility gas
- 2.1%Electricity
- 0.5%Bottled, tank, or LP gas
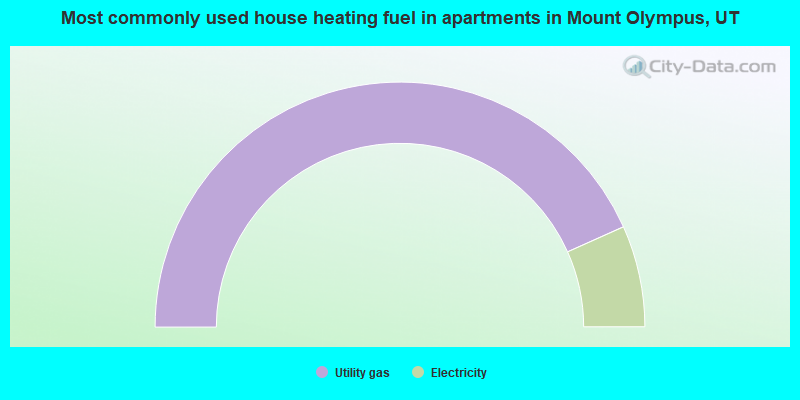
- 86.6%Utility gas
- 13.4%Electricity
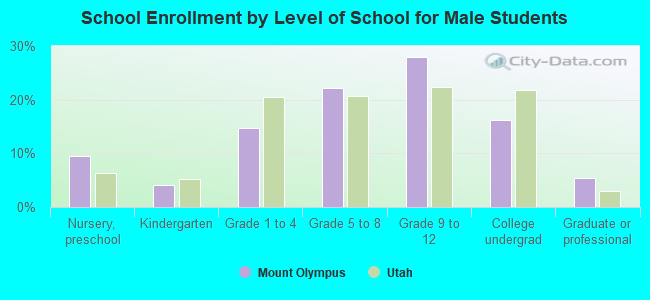
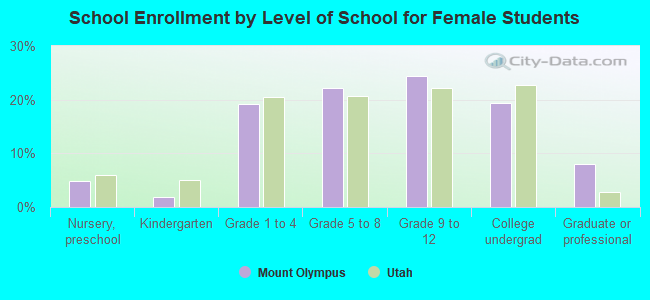
Private vs. public school enrollment:
| Here: | 18.3% |
| Utah: | 4.2% |
| Here: | 10.9% |
| Utah: | 3.9% |
| Here: | 25.3% |
| Utah: | 27.4% |