Morrow, GA (Georgia) Houses and Residents
| Morrow: | $191,485 |
| Georgia: | $297,400 |
Total population: 7,167 (Urban population: 4,893, Rural population: 0)
Houses: 1,765 (1,598 occupied: 941 owner occupied, 681 renter occupied)
| % of renters here: | 42% |
| State: | 34% |
Housing density: 599 houses/condos per square mile
Median price asked for vacant for-sale houses and condos in 2022 in this county: $143,584.
Median contract rent in 2022: $1,115 (lower quartile is $920, upper quartile is $1,571)
Median rent asked for vacant for-rent units in 2022: $2,851
Median gross rent in Morrow, GA in 2022: $1,336
Housing units in Morrow with a mortgage: 483 (0 second mortgage, 0 home equity loan, 0 both second mortgage and home equity loan)
Houses without a mortgage: 0
Median household income for houses/condos with a mortgage: $80,638
Median household income for apartments without a mortgage: $90,011
Median monthly housing costs: $1,185
Compare current foreclosures in Morrow, GA:
| Photo | Address | Area | Beds / Baths | Price | Details |
|---|---|---|---|---|---|

|
#1
Mount Zion Blvd
Morrow, GA 30260
|
1,555 sq. feet
|
3 baths 3 beds |
show details | |

|
#2
Denson Blvd
Morrow, GA 30260
|
1,297 sq. feet
|
2 baths 3 beds |
show details | |

|
#3
Fairfield Ct
Morrow, GA 30260
|
1,050 sq. feet
|
2 baths 3 beds |
show details | |

|
#4
Mural Cir
Morrow, GA 30260
|
1,140 sq. feet
|
1 baths 3 beds |
show details | |

|
#5
Sinclair Pl
Morrow, GA 30260
|
1,618 sq. feet
|
2 baths 3 beds |
show details | |

|
#6
White Fox Ct
Morrow, GA 30260
|
1,808 sq. feet
|
2 baths 3 beds |
show details | |

|
#7
Caribou Ct
Morrow, GA 30260
|
1,403 sq. feet
|
2 baths 3 beds |
show details | |

|
#8
Northridge Way
Morrow, GA 30260
|
1,238 sq. feet
|
2 baths 2 beds |
show details | |

|
#9
Wendy Jean Dr
Morrow, GA 30260
|
1,918 sq. feet
|
2 baths 3 beds |
show details | |

|
#10
E Meyer Dr
Morrow, GA 30260
|
1,820 sq. feet
|
2 baths 4 beds |
show details |
| Photo | Address | Area | Beds / Baths | Price | Details |
|---|---|---|---|---|---|

|
#11
Wendell Way
Morrow, GA 30260
|
1,440 sq. feet
|
2 baths 3 beds |
show details | |

|
#12
Monterey Dr
Morrow, GA 30260
|
1,598 sq. feet
|
2 baths 3 beds |
show details | |

|
#13
Sanders Dr
Morrow, GA 30260
|
1,095 sq. feet
|
1 baths 3 beds |
show details | |

|
#14
Joy Lake Rd
Morrow, GA 30260
|
2,479 sq. feet
|
1 baths 4 beds |
show details | |

|
#15
Pine Meadows Ct
Morrow, GA 30260
|
1,178 sq. feet
|
2 baths 3 beds |
show details | |

|
#16
Fairlane Dr
Morrow, GA 30260
|
1,099 sq. feet
|
1 baths 3 beds |
show details | |

|
#17
Reynolds Ct
Morrow, GA 30260
|
1,504 sq. feet
|
2 baths 3 beds |
show details | |

|
#18
Green Meadows Ln
Morrow, GA 30260
|
1,229 sq. feet
|
1 baths 3 beds |
show details | |

|
#19
Creekview Ln
Morrow, GA 30260
|
1,934 sq. feet
|
3 baths 4 beds |
show details | |

|
#20
Heritage Ln
Morrow, GA 30260
|
2,024 sq. feet
|
2 baths 3 beds |
show details |
| Photo | Address | Area | Beds / Baths | Price | Details |
|---|---|---|---|---|---|

|
#21
King William Dr
Morrow, GA 30260
|
1,501 sq. feet
|
1 baths 3 beds |
show details | |

|
#22
Wilson Blvd
Morrow, GA 30260
|
3,361 sq. feet
|
3 baths 3 beds |
show details | |

|
#23
Georges Way
Morrow, GA 30260
|
1,348 sq. feet
|
2 baths 2 beds |
show details | |

|
#24
Brookview Ct
Morrow, GA 30260
|
1,107 sq. feet
|
2 baths 3 beds |
show details | |

|
#25
Baden Ct
Morrow, GA 30260
|
1,902 sq. feet
|
1 baths 3 beds |
show details | |

|
#26
Melandre Dr
Morrow, GA 30260
|
1,927 sq. feet
|
2 baths 3 beds |
show details | |

|
#27
Waterford Ct
Morrow, GA 30260
|
975 sq. feet
|
2 baths 2 beds |
show details | |

|
#28
W Meyer Ct
Morrow, GA 30260
|
2,188 sq. feet
|
2 baths 4 beds |
show details | |

|
#29
Tsali Trl
Morrow, GA 30260
|
1,817 sq. feet
|
2 baths 4 beds |
show details | |

|
#30
Lanier Pl
Morrow, GA 30260
|
1,279 sq. feet
|
2 baths 3 beds |
show details |
| Photo | Address | Area | Beds / Baths | Price | Details |
|---|---|---|---|---|---|

|
#31
Demere Dr
Morrow, GA 30260
|
1,332 sq. feet
|
2 baths 3 beds |
show details | |

|
#32
Ahyoka Dr
Morrow, GA 30260
|
5,385 sq. feet
|
4 baths 4 beds |
show details | |

|
#33
Arctic Ct
Morrow, GA 30260
|
1,352 sq. feet
|
2 baths 3 beds |
show details | |

|
#34
Cameron Rd
Morrow, GA 30260
|
1,280 sq. feet
|
2 baths - beds |
show details | |

|
#35
Aquila Dr
Morrow, GA 30260
|
- sq. feet
|
- baths - beds |
show details | |

|
#36
Claridge Park Dr # 1512
Morrow, GA 30260
|
- sq. feet
|
- baths - beds |
show details | |

|
#37
Indian Lake Dr # 290
Morrow, GA 30260
|
- sq. feet
|
- baths - beds |
show details | |

|
#38
Jonesboro Rd, Ste 111 Pmb 150
Morrow, GA 30260
|
- sq. feet
|
- baths - beds |
show details | |

|
#39
Trammell Rd Apt J1
Morrow, GA 30260
|
- sq. feet
|
- baths - beds |
show details | |

|
#40
Georges Way
Morrow, GA 30260
|
- sq. feet
|
- baths - beds |
show details |
| Photo | Address | Area | Beds / Baths | Price | Details |
|---|---|---|---|---|---|

|
#41
Indian Lake Dr
Morrow, GA 30260
|
- sq. feet
|
- baths - beds |
show details | |

|
#42
N Lee St Apt 4i
Morrow, GA 30260
|
- sq. feet
|
- baths - beds |
show details | |

|
#43
Harper Dr Apt 9b
Morrow, GA 30260
|
- sq. feet
|
- baths - beds |
show details | |

|
#44
Maddox Rd
Morrow, GA 30260
|
- sq. feet
|
- baths - beds |
show details | |

|
#45
Sandlewood Dr
Morrow, GA 30260
|
- sq. feet
|
- baths - beds |
show details | |

|
#46
Maddox Rd
Morrow, GA 30260
|
- sq. feet
|
- baths - beds |
show details | |

|
#47
Mount Zion Blvd Apt J119
Morrow, GA 30260
|
- sq. feet
|
- baths - beds |
show details | |

|
#48
Trammell Rd Apt 148
Morrow, GA 30260
|
- sq. feet
|
- baths - beds |
show details | |

|
#49
Indian Lake Dr # 344
Morrow, GA 30260
|
- sq. feet
|
- baths - beds |
show details | |

|
Check over 1 million property listings on Foreclosure.com!
|
browse all offers | |||

Latest news about housing in Morrow, GA collected exclusively by city-data.com from local newspapers, TV, and radio stations

 | House or apartment rental (3 replies) |
| House or apartment rental (0 replies) |
| Atlanta market not selling $400K+ homes as fast as it used to (61 replies) |
| Why are so many homes built like this? (26 replies) |
| Why are homes so cheap in Stone Mountain? (82 replies) |
| Median Home Sale Price by High School District in Metro Atlanta - Past 90 Days (28 replies) |

Median year apartment built: 1992
Household type by relationship:
Households: 6,568- Male householders: 652 (116 living alone), Female householders: 919 (120 living alone)
884 spouses (884 opposite-sex spouses), 122 unmarried partners, (122 opposite-sex unmarried partners), 2,367 children (2,263 natural, 0 adopted, 103 stepchildren), 249 grandchildren, 52 brothers or sisters, 285 parents, 0 foster children, 234 other relatives, 78 non-relatives
- In group quarters: 723
Size of family households: 362 2-persons, 113 3-persons, 409 4-persons, 103 5-persons, 169 6-persons, 27 7-or-more-persons.
Size of nonfamily households: 295 1-person, 98 2-persons.
1,404 married couples with children.
222 single-parent households (26 men, 196 women).
46.8% of residents of Morrow speak English at home.
24.1% of residents speak Spanish at home (40% speak English very well, 46% speak English well, 11% speak English not well, 2% don't speak English at all).
1.6% of residents speak other Indo-European language at home (60% speak English very well, 32% speak English well, 8% speak English not well).
26.1% of residents speak Asian or Pacific Island language at home (36% speak English very well, 31% speak English well, 26% speak English not well, 7% don't speak English at all).
0.9% of residents speak other language at home (100% speak English very well).
Foreign born population: 2,044 (31.1%)
(82.8% of them are naturalized citizens)
| Here: | 6.6 |
| State: | 6.8 |
| Here: | 5.8 |
| State: | 4.6 |

- Bedrooms in owner-occupied houses and condos in Morrow, Georgia
- 0no bedroom
- 01 bedroom
- 1342 bedrooms
- 3563 bedrooms
- 3734 bedrooms
- 775+ bedrooms

- Bedrooms in renter-occupied apartments in Morrow, Georgia
- 0no bedroom
- 531 bedroom
- 1932 bedrooms
- 3823 bedrooms
- 04 bedrooms
- 545+ bedrooms

- Cars and other vehicles available in Morrow in owner-occupied houses/condos
- 0no vehicle
- 2821 vehicle
- 3772 vehicles
- 2563 vehicles
- 264 vehicles
- 05+ vehicles

- Cars and other vehicles available in Morrow in renter-occupied apartments
- 121no vehicle
- 2151 vehicle
- 1512 vehicles
- 863 vehicles
- 564 vehicles
- 545+ vehicles

- Rooms in owner-occupied houses in Morrow, Georgia
- 01 room
- 02 rooms
- 03 rooms
- 94 rooms
- 1855 rooms
- 2276 rooms
- 2557 rooms
- 948 rooms
- 1709+ rooms

- Rooms in renter-occupied apartments in Morrow, Georgia
- 01 room
- 02 rooms
- 443 rooms
- 1244 rooms
- 1475 rooms
- 1296 rooms
- 1527 rooms
- 08 rooms
- 869+ rooms


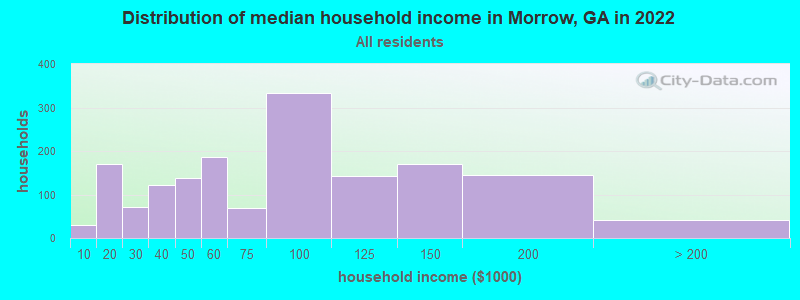
Morrow, GA household income distribution

- 31Less than $10,000
- 171$10,000 to $19,999
- 71$20,000 to $29,999
- 121$30,000 to $39,999
- 139$40,000 to $49,999
- 186$50,000 to $59,999
- 70$60,000 to $74,999
- 334$75,000 to $99,999
- 142$100,000 to $124,999
- 171$125,000 to $149,999
- 145$150,000 to $199,999
- 42$200,000 or more
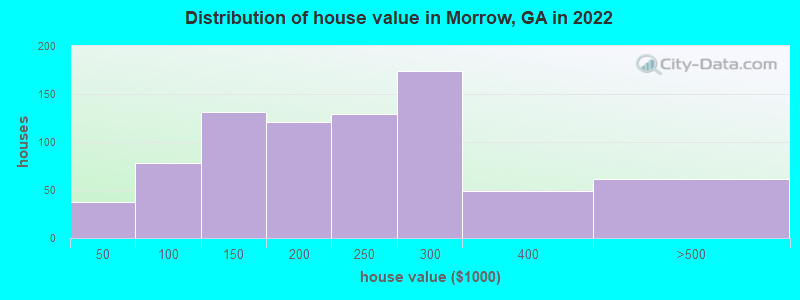
Home value of owner - occupied houses in 2022 in Morrow, GA
-
- 18$10,000 to $14,999
- 19$15,000 to $19,999
- 20$50,000 to $59,999
- 57$90,000 to $99,999
- 75$100,000 to $124,999
- 55$125,000 to $149,999
- 43$150,000 to $174,999
- 77$175,000 to $199,999
- 129$200,000 to $249,999
- 174$250,000 to $299,999
- 49$300,000 to $399,999
- 60$400,000 to $499,999
Rent paid by renters in 2022 in Morrow, GA
-
- 12$400 to $449
- 53$650 to $699
- 63$750 to $799
- 121$800 to $899
- 102$900 to $999
- 56$1,000 to $1,249
- 138$1,250 to $1,499
- 107$1,500 to $1,999


Percentage of workers working in this county: 52.9%
Number of people working at home: 307 (11.4% of all workers)
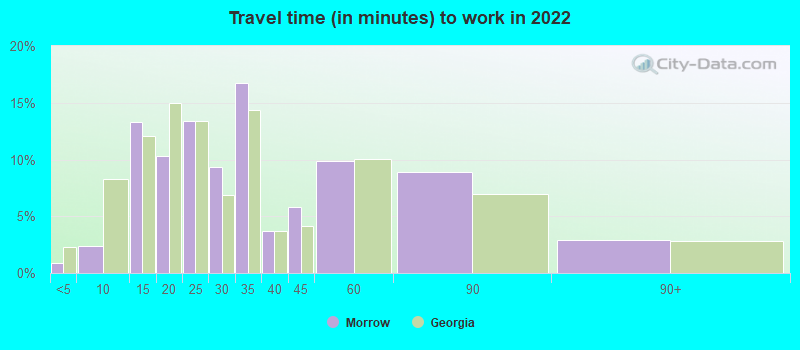
Travel time to work (commute)
- Less than 5 minutes: 0
- 5 to 9 minutes: 171
- 10 to 14 minutes: 332
- 15 to 19 minutes: 411
- 20 to 24 minutes: 136
- 25 to 29 minutes: 91
- 30 to 34 minutes: 469
- 35 to 39 minutes: 394
- 40 to 44 minutes: 82
- 45 to 59 minutes: 198
- 60 to 89 minutes: 166
- 90 or more minutes: 39
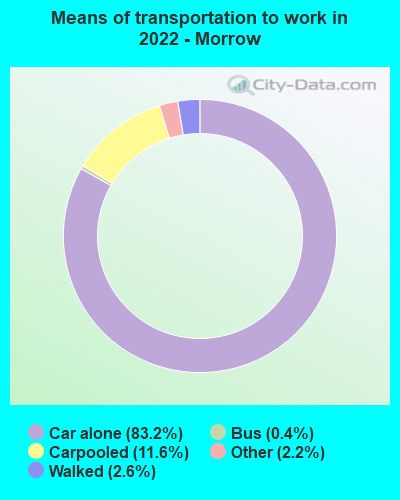
Means of transportation to work:
- Drove a car alone: 5,901 (76.8%)
- Carpooled: 858 (11.2%)
- Bus: 20 (0.3%)
- Taxi: 169 (2.2%)
- Walked: 189 (2.5%)
- Worked at home: 307 (4.0%)

- Unemployment by race in 2022
- Unemployment rate for Black residents
- 9.8%Males
- 18.1%Females
- Unemployment rate for Asian residents
- 1.2%Females
- Unemployment rate for other race residents
- 1.4%Males
- Unemployment rate for Hispanic or Latino residents
- 14.0%Males

- Year of entry for the foreign-born population in Morrow, Georgia
- 4692010 or later
- 3462000 to 2009
- 7201990 to 1999
- 1711980 to 1989
- 371970 to 1979
- 15Before 1970
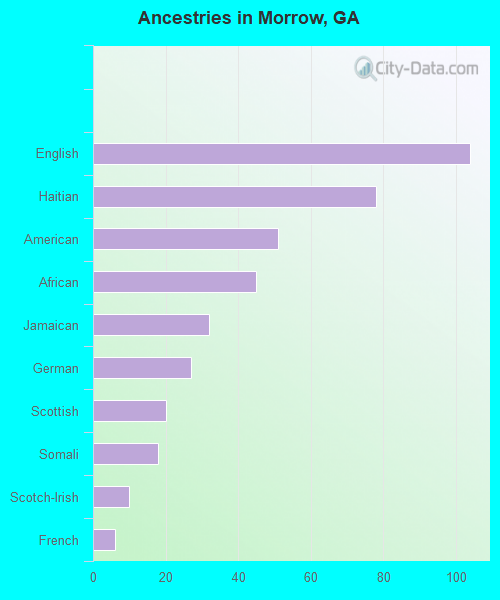
First ancestries reported:
- English: 104 (2.4%)
- Haitian: 78 (1.8%)
- American: 51 (1.2%)
- African: 45 (1.0%)
- Jamaican: 32 (0.7%)
- German: 27 (0.6%)
- Scottish: 20 (0.5%)
- Somali: 18 (0.4%)
- Scotch-Irish: 10 (0.2%)
- French: 6 (0.1%)
Most common places of birth for foreign-born residents (%):
| Morrow: | 68.2% (1,310) |
| Georgia: | 4.1% (45,797) |
| Morrow: | 15.0% (288) |
| Georgia: | 20.0% (223,400) |
| Morrow: | 12.1% (233) |
| Georgia: | 1.1% (11,847) |
| Morrow: | 2.7% (52) |
| Georgia: | 3.6% (39,974) |
| Morrow: | 1.8% (34) |
| Georgia: | 1.6% (17,476) |
Place of birth for U.S.-born residents:
- This state: 3,561
- Other state: 1,084
- Northeast: 279
- Midwest: 24
- South: 516
- West: 311
92.6% of Morrow residents lived in the same house 1 years ago.
Out of people who lived in different houses, 20.5% lived in this county.
Out of people who lived in different counties, 80.1% lived in Georgia.
| Morrow: | 92.6% |
| State average: | 86.6% |
Education attainment for males 25 years and older:
- No schooling: 47
- Nursery to 4th grade: 56
- 5th and 6th grade: 41
- 7th and 8th grade: 0
- 9th grade: 84
- 10th grade: 0
- 11th grade: 79
- 12th grade, no diploma: 73
- High school graduate (or equivalency): 545
- Less than 1 year of college: 129
- Some college more than 1 year, no degree: 179
- Associate degree: 83
- Bachelor's degree: 338
- Master's degree: 65
- Professional school degree: 28
- Doctorate degree: 0

Education attainment for females 25 years and older:
- No schooling: 108
- Nursery to 4th grade: 0
- 5th and 6th grade: 3
- 7th and 8th grade: 184
- 9th grade: 24
- 10th grade: 0
- 11th grade: 41
- 12th grade, no diploma: 175
- High school graduate (or equivalency): 465
- Less than 1 year of college: 159
- Some college more than 1 year, no degree: 302
- Associate degree: 204
- Bachelor's degree: 242
- Master's degree: 26
- Professional school degree: 7
- Doctorate degree: 11


Housing units in structures:
- One, detached: 1,299
- One, attached: 137
- 3 or 4: 4
- 5 to 9: 88
- 10 to 19: 117
- 20 to 49: 76
- 50 or more: 42
House/condo owner moved in on average 9 years ago
Renter moved in on average 5 years ago

Private vs. public school enrollment:
| Here: | 5.6% |
| Georgia: | 12.1% |
| Here: | 51.9% |
| Georgia: | 10.8% |
| Here: | 0.0% |
| Georgia: | 17.1% |


