Morro Bay, CA (California) Houses and Residents
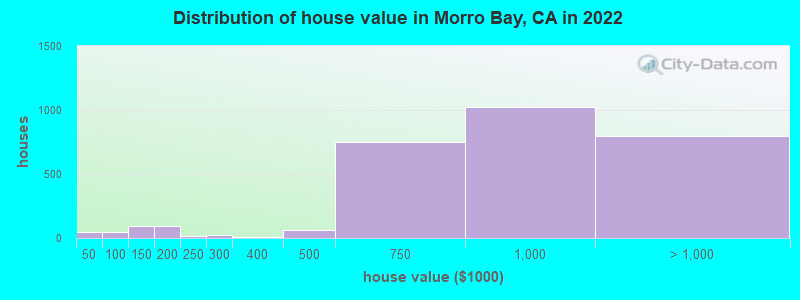
Estimated median house or condo value in 2022: $857,598 (it was $231,400 in 2000 )
Morro Bay:
$857,598California:
$715,900
Lower value quartile - upper value quartile: $626,989 - $1,029,226Mean price in 2022: Detached houses: $1,025,295 Here:
$1,025,295State:
$988,808
Townhouses or other attached units: $858,532 Here:
$858,532State:
$838,546
In 2-unit structures: $1,307,246 Here:
$1,307,246State:
$1,138,100
In 5-or-more-unit structures: $744,199 Here:
$744,199State:
$730,996
Mobile homes: $112,099 Here:
$112,099State:
$184,506
Occupied boats, RVs, vans, etc.: $146,599 Here:
$146,599State:
$204,957
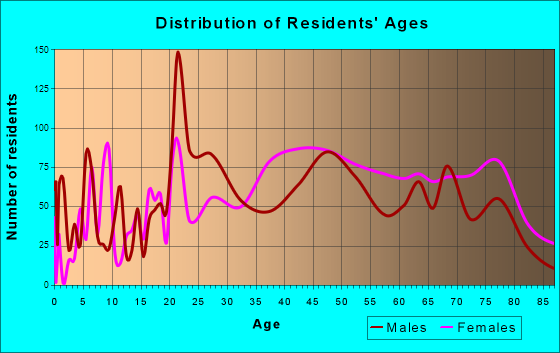
Total population: 10,544 (Urban population: 10,308 (all inside urban clusters), Rural population: 0)
Houses: 6,178 (4,925 occupied: 2,892 owner occupied, 2,121 renter occupied )
% of renters here:
42%State:
44%
Housing density: 1,198 houses/condos per square mile
Median price asked for vacant for-sale houses and condos in 2022: $519,095.
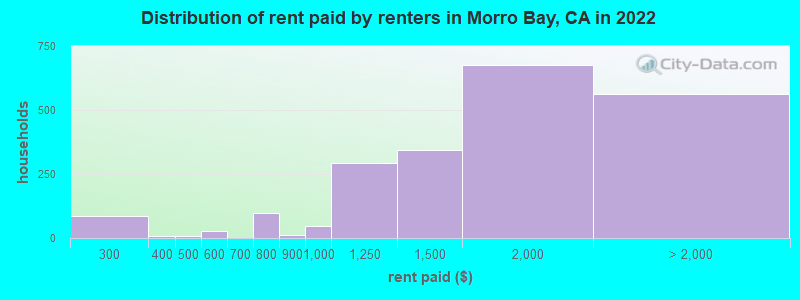
Median contract rent in 2022: $1,582 (lower quartile is $1,210, upper quartile is $1,978)
Median rent asked for vacant for-rent units in 2022: $1,377
Median gross rent in Morro Bay, CA in 2022: $1,779
Housing units in Morro Bay with a mortgage: 1,860 (166 second mortgage, 0 home equity loan, 172 both second mortgage and home equity loan )Houses without a mortgage: 64
Median household income for houses/condos with a mortgage: $129,836
Median household income for apartments without a mortgage: $81,298
Median monthly housing costs: $1,803
Data:
Median house or condo value ($)
Median house or condo value ($ change since 2000)
Median house or condo value ($) - White
Median house or condo value ($) - Black or African American
Median house or condo value ($) - Asian
Median house or condo value ($) - Hispanic or Latino
Median house or condo value ($) - American Indian and Alaska Native
Median house or condo value ($) - Multirace
Median house or condo value ($) - Other Race
Median price asked for mobile homes ($)
Household density (households per square mile)
Mean house or condo value by units in structure - 1, detached ($)
Mean house or condo value by units in structure - 1, attached ($)
Mean house or condo value by units in structure - 2 ($)
Mean house or condo value by units in structure by units in structure - 3 or 4 ($)
Mean house or condo value by units in structure - 5 or more ($)
Mean house or condo value by units in structure - Boat, RV, van, etc. ($)
Mean house or condo value by units in structure - Mobile home ($)
Median contract rent ($)
Median contract rent - Lower quartile ($)
Median contract rent - Upper quartile ($)
Median gross rent ($)
Urban houses (%)
Rural houses (%)
Houses occupied (%)
Houses occupied (% change since 2000)
Houses owner occupied (%)
Houses owner occupied (% change since 2000)
Houses renter occupied (%)
Houses renter occupied (% change since 2000)
Vacant housing units - For rent (%)
Vacant housing units - For rent (% change since 2000)
Vacant housing units - For sale only (%)
Vacant housing units - For sale only (% change since 2000)
Vacant housing units - Rented or sold, not occupied (%)
Vacant housing units - Rented or sold, not occupied (% change since 2000)
Vacant housing units - For seasonal, recreational, or occasional use (%)
Vacant housing units - For seasonal, recreational, or occasional use (% change since 2000)
Vacant housing units - For migrant workers (%)
Vacant housing units - For migrant workers (% change since 2000)
Vacant housing units - Other vacant (%)
Vacant housing units - Other vacant (% change since 2000)
Median monthly housing costs ($)
Median household income for houses/condos with a mortgage ($)
Median household income for houses/condos without a mortgage ($)
Median household income ($)
Median household income ($) - White
Median household income ($) - Black or African American
Median household income ($) - Asian
Median household income ($) - Hispanic or Latino
Median household income ($) - American Indian and Alaska Native
Median household income ($) - Multirace
Median household income ($) - Other Race
Mortgage status - with mortgage (%)
Mortgage status - with second mortgage (%)
Mortgage status - with home equity loan (%)
Mortgage status - with both second mortgage and home equity loan (%)
Mortgage status - without a mortgage (%)
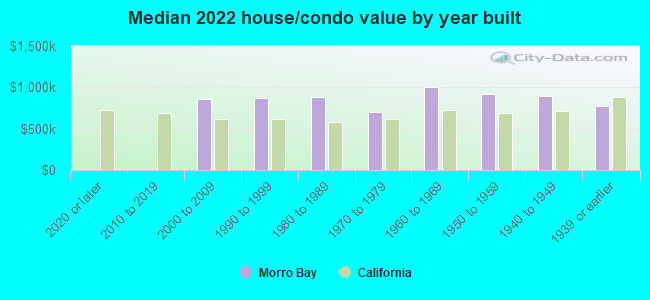
Median year house/condo built
Median year apartment built
Household type by relationship - Male householder living alone (%)
Household type by relationship - Male householder not living alone (%)
Household type by relationship - Female householder living alone (%)
Household type by relationship - Female householder not living alone (%)
Household type by relationship - Opposite-Sex spouse (%)
Household type by relationship - Same-Sex spouse (%)
Household type by relationship - Opposite-Sex unmarried partner (%)
Household type by relationship - Same-Sex unmarried partner (%)
Household type by relationship - In group quarters (%)
Size of family households - 2-person household (%)
Size of family households - 3-person household (%)
Size of family households - 4-person household (%)
Size of family households - 5-person household (%)
Size of family households - 6-person household (%)
Size of family households - 7-or-more-person household (%)
Size of nonfamily households - 1-person household (%)
Size of nonfamily households - 2-person household (%)
Size of nonfamily households - 3-person household (%)
Size of nonfamily households - 4-person household (%)
Size of nonfamily households - 5-person household (%)
Size of nonfamily households - 6-person household (%)
Size of nonfamily households - 7-or-moreperson household (%)
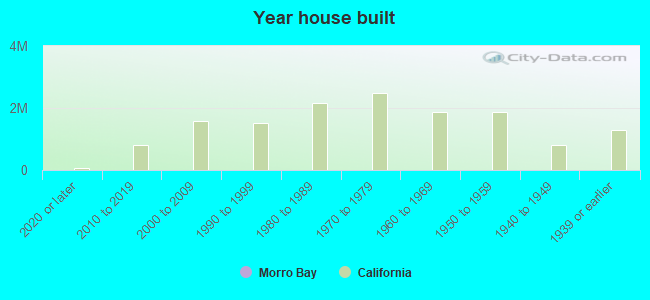
Year house built - Built 2010 or later (%)
Year house built - Built 2000 to 2009 (%)
Year house built - Built 1990 to 1999 (%)
Year house built - Built 1980 to 1989 (%)
Year house built - Built 1970 to 1979 (%)
Year house built - Built 1960 to 1969 (%)
Year house built - Built 1950 to 1959 (%)
Year house built - Built 1940 to 1949 (%)
Year house built - Built 1939 or earlier (%)
Median number of rooms in houses and condos
Median number of rooms in apartments
Median number of bedrooms in owner occupied houses
Mean number of bedrooms in owner occupied houses
Median number of bedrooms in renter occupied houses
Mean number of bedrooms in renter occupied houses
Median number of vehichles in owner occupied houses
Mean number of vehichles in owner occupied houses
Median number of vehichles in renter occupied houses
Mean number of vehichles in renter occupied houses
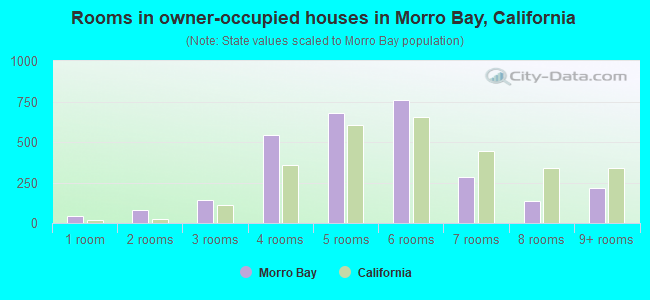
Rooms in owner-occupied houses - 1 room (%)
Rooms in owner-occupied houses - 2 rooms (%)
Rooms in owner-occupied houses - 3 rooms (%)
Rooms in owner-occupied houses - 4 rooms (%)
Rooms in owner-occupied houses - 5 rooms (%)
Rooms in owner-occupied houses - 6 rooms (%)
Rooms in owner-occupied houses - 7 rooms (%)
Rooms in owner-occupied houses - 8 rooms (%)
Rooms in owner-occupied houses - 9+ rooms (%)
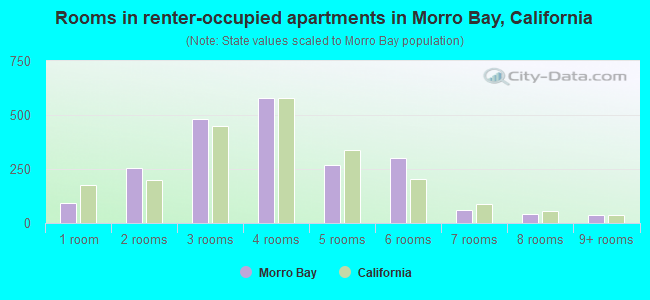
Rooms in renter-occupied houses - 1 room (%)
Rooms in renter-occupied houses - 2 rooms (%)
Rooms in renter-occupied houses - 3 rooms (%)
Rooms in renter-occupied houses - 4 rooms (%)
Rooms in renter-occupied houses - 5 rooms (%)
Rooms in renter-occupied houses - 6 rooms (%)
Rooms in renter-occupied houses - 7 rooms (%)
Rooms in renter-occupied houses - 8 rooms (%)
Rooms in renter-occupied houses - 9+ rooms (%)
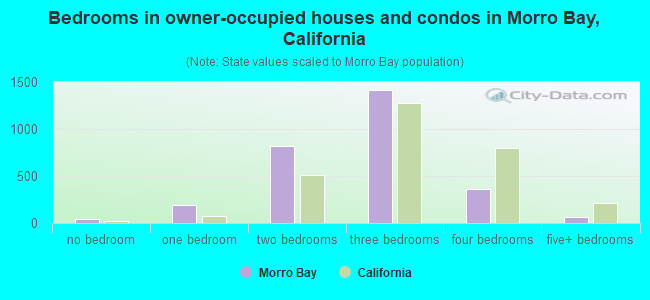
Bedrooms in owner-occupied houses - no bedrooms (%)
Bedrooms in owner-occupied houses - 1 bedroom (%)
Bedrooms in owner-occupied houses - 2 bedrooms (%)
Bedrooms in owner-occupied houses - 3 bedrooms (%)
Bedrooms in owner-occupied houses - 4 bedrooms (%)
Bedrooms in owner-occupied houses - 5+ bedrooms (%)
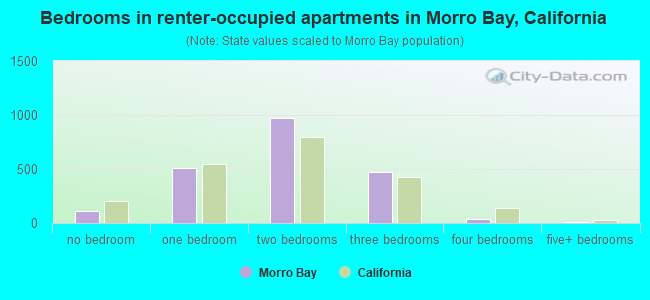
Bedrooms in renter-occupied houses - no bedrooms (%)
Bedrooms in renter-occupied houses - 1 bedroom (%)
Bedrooms in renter-occupied houses - 2 bedrooms (%)
Bedrooms in renter-occupied houses - 3 bedrooms (%)
Bedrooms in renter-occupied houses - 4 bedrooms (%)
Bedrooms in renter-occupied houses - 5+ bedrooms (%)
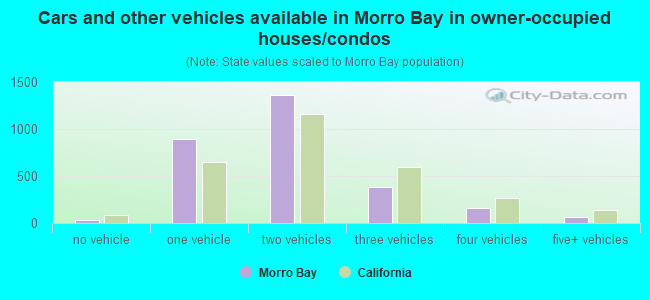
Vehicles available in owner-occupied houses - no vehicle available (%)
Vehicles available in owner-occupied houses - 1 vehicle available(%)
Vehicles available in owner-occupied houses - 2 Vehicles available (%)
Vehicles available in owner-occupied houses - 3 Vehicles available (%)
Vehicles available in owner-occupied houses - 4 Vehicles available (%)
Vehicles available in owner-occupied houses - 5+ Vehicles available (%)
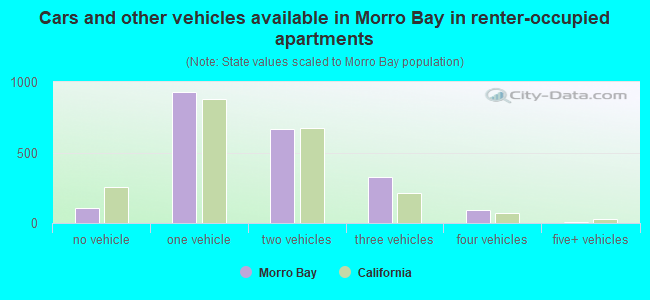
Vehicles available in renter-occupied houses - no vehicle available (%)
Vehicles available in renter-occupied houses - 1 vehicle available (%)
Vehicles available in renter-occupied houses - 2 Vehicles available (%)
Vehicles available in renter-occupied houses - 3 Vehicles available (%)
Vehicles available in renter-occupied houses - 4 Vehicles available (%)
Vehicles available in renter-occupied houses - 5+ Vehicles available (%)
Housing units in structures - 1, detached (%)
Housing units in structures - 1, attached (%)
Housing units in structures - 2 (%)
Housing units in structures - 3 or 4 (%)
Housing units in structures - 5 to 9 (%)
Housing units in structures - 10 to 19 (%)
Housing units in structures - 20 to 49 (%)
Housing units in structures - 50 or more (%)
Housing units in structures - Mobile home (%)
Housing units in structures - Boat, RV, van, etc. (%)
Housing units in structures - Owners - 1, detached (%)
Housing units in structures - Owners - 1, attached (%)
Housing units in structures - Owners - 2 (%)
Housing units in structures - Owners - 3 or 4 (%)
Housing units in structures - Owners - 5 to 9 (%)
Housing units in structures - Owners - 10 to 19 (%)
Housing units in structures - Owners - 20 to 49 (%)
Housing units in structures - Owners - 50 or more (%)
Housing units in structures - Owners - Mobile home (%)
Housing units in structures - Owners - Boat, RV, van, etc. (%)
Housing units in structures - Renters - 1, detached (%)
Housing units in structures - Renters - 1, attached (%)
Housing units in structures - Renters - 2 (%)
Housing units in structures - Renters - 3 or 4 (%)
Housing units in structures - Renters - 5 to 9 (%)
Housing units in structures - Renters - 10 to 19 (%)
Housing units in structures - Renters - 20 to 49 (%)
Housing units in structures - Renters - 50 or more (%)
Housing units in structures - Renters - Mobile home (%)
Housing units in structures - Renters - Boat, RV, van, etc. (%)
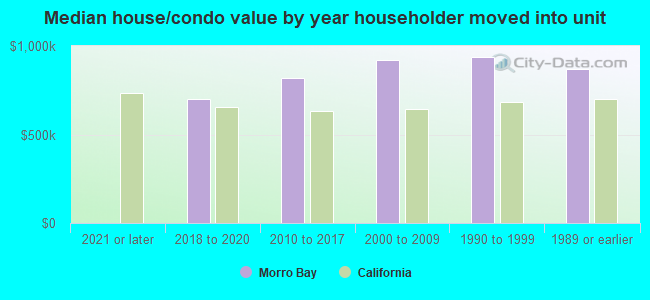
House/condo owner moved in on average (years ago)
Renter moved in on average (years ago)
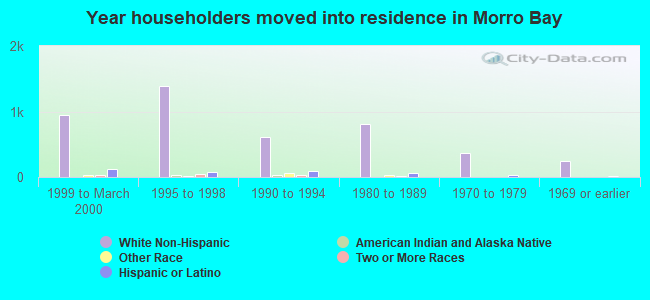
Year householder moved into unit - Moved in 1999 to March 2000 (%)
Year householder moved into unit - Moved in 1999 to March 2000 (%) - White
Year householder moved into unit - Moved in 1999 to March 2000 (%) - Black or African American
Year householder moved into unit - Moved in 1999 to March 2000 (%) - Asian
Year householder moved into unit - Moved in 1999 to March 2000 (%) - Hispanic or Latino
Year householder moved into unit - Moved in 1999 to March 2000 (%) - American Indian and Alaska Native
Year householder moved into unit - Moved in 1999 to March 2000 (%) - Multirace
Year householder moved into unit - Moved in 1999 to March 2000 (%) - Other Race
Year householder moved into unit - Moved in 1995 to 1998 (%)
Year householder moved into unit - Moved in 1995 to 1998 (%) - White
Year householder moved into unit - Moved in 1995 to 1998 (%) - Black or African American
Year householder moved into unit - Moved in 1995 to 1998 (%) - Asian
Year householder moved into unit - Moved in 1995 to 1998 (%) - Hispanic or Latino
Year householder moved into unit - Moved in 1995 to 1998 (%) - American Indian and Alaska Native
Year householder moved into unit - Moved in 1995 to 1998 (%) - Multirace
Year householder moved into unit - Moved in 1995 to 1998 (%) - Other Race
Year householder moved into unit - Moved in 1990 to 1994 (%)
Year householder moved into unit - Moved in 1990 to 1994 (%) - White
Year householder moved into unit - Moved in 1990 to 1994 (%) - Black or African American
Year householder moved into unit - Moved in 1990 to 1994 (%) - Asian
Year householder moved into unit - Moved in 1990 to 1994 (%) - Hispanic or Latino
Year householder moved into unit - Moved in 1990 to 1994 (%) - American Indian and Alaska Native
Year householder moved into unit - Moved in 1990 to 1994 (%) - Multirace
Year householder moved into unit - Moved in 1990 to 1994 (%) - Other Race
Year householder moved into unit - Moved in 1980 to 1989 (%)
Year householder moved into unit - Moved in 1980 to 1989 (%) - White
Year householder moved into unit - Moved in 1980 to 1989 (%) - Black or African American
Year householder moved into unit - Moved in 1980 to 1989 (%) - Asian
Year householder moved into unit - Moved in 1980 to 1989 (%) - Hispanic or Latino
Year householder moved into unit - Moved in 1980 to 1989 (%) - American Indian and Alaska Native
Year householder moved into unit - Moved in 1980 to 1989 (%) - Multirace
Year householder moved into unit - Moved in 1980 to 1989 (%) - Other Race
Year householder moved into unit - Moved in 1970 to 1979 (%)
Year householder moved into unit - Moved in 1970 to 1979 (%) - White
Year householder moved into unit - Moved in 1970 to 1979 (%) - Black or African American
Year householder moved into unit - Moved in 1970 to 1979 (%) - Asian
Year householder moved into unit - Moved in 1970 to 1979 (%) - Hispanic or Latino
Year householder moved into unit - Moved in 1970 to 1979 (%) - American Indian and Alaska Native
Year householder moved into unit - Moved in 1970 to 1979 (%) - Multirace
Year householder moved into unit - Moved in 1970 to 1979 (%) - Other Race
Year householder moved into unit - Moved in 1969 or earlier (%)
Year householder moved into unit - Moved in 1969 or earlier (%) - White
Year householder moved into unit - Moved in 1969 or earlier (%) - Black or African American
Year householder moved into unit - Moved in 1969 or earlier (%) - Asian
Year householder moved into unit - Moved in 1969 or earlier (%) - Hispanic or Latino
Year householder moved into unit - Moved in 1969 or earlier (%) - American Indian and Alaska Native
Year householder moved into unit - Moved in 1969 or earlier (%) - Multirace
Year householder moved into unit - Moved in 1969 or earlier (%) - Other Race
Housing units lacking complete plumbing facilities (%)
Housing units lacking complete kitchen facilities (%)
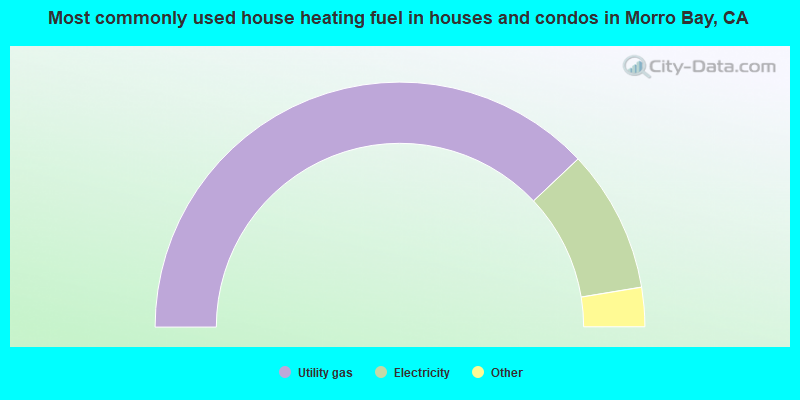
House heating fuel used in houses and condos - Utility gas (%)
House heating fuel used in houses and condos - Bottled, tank, or LP gas (%)
House heating fuel used in houses and condos - Electricity (%)
House heating fuel used in houses and condos - Fuel oil, kerosene, etc. (%)
House heating fuel used in houses and condos - Coal or coke (%)
House heating fuel used in houses and condos - Wood (%)
House heating fuel used in houses and condos - Solar energy (%)
House heating fuel used in houses and condos - Other fuel (%)
House heating fuel used in houses and condos - No fuel used (%)
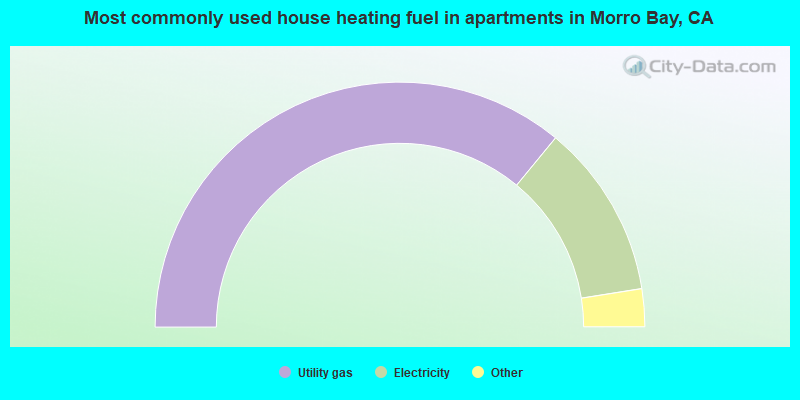
House heating fuel used in apartments - Utility gas (%)
House heating fuel used in apartments - Bottled, tank, or LP gas (%)
House heating fuel used in apartments - Electricity (%)
House heating fuel used in apartments - Fuel oil, kerosene, etc. (%)
House heating fuel used in apartments - Coal or coke (%)
House heating fuel used in apartments - Wood (%)
House heating fuel used in apartments - Solar energy (%)
House heating fuel used in apartments - Other fuel (%)
House heating fuel used in apartments - No fuel used (%)
Median year house/condo built: 1970Median year apartment built: 1973Household type by relationship:
Households: 10,777
Male householders: 2,508 (683 living alone ), Female householders: 2,348 (1,039 living alone )2,192 spouses (2,138 opposite-sex spouses ), 270 unmarried partners , (270 opposite-sex unmarried partners ), 2,339 children (2,162 natural , 29 adopted , 148 stepchildren ), 197 grandchildren , 57 brothers or sisters , 203 parents , 0 foster children , 75 other relatives , 405 non-relatives In group quarters: 180
Size of family households: 1,636 2-persons , 594 3-persons , 290 4-persons , 75 5-persons , 137 6-persons , 82 7-or-more-persons .
Size of nonfamily households: 1,770 1-person , 323 2-persons , 49 3-persons , 37 4-persons .
899 married couples with children. single-parent households (69 men , 237 women ).
86.8% of residents of Morro Bay speak English at home. of residents speak Spanish at home (79% speak English very well , 11% speak English well , 10% don't speak English at all ).of residents speak other Indo-European language at home (58% speak English very well , 42% speak English well ).of residents speak Asian or Pacific Island language at home (69% speak English very well , 31% speak English well ).of residents speak other language at home (81% speak English very well , 19% don't speak English at all ).
Foreign born population: 655 (6.1%)of them are naturalized citizens )
Median number of rooms in houses and condos:
Median number of rooms in apartments
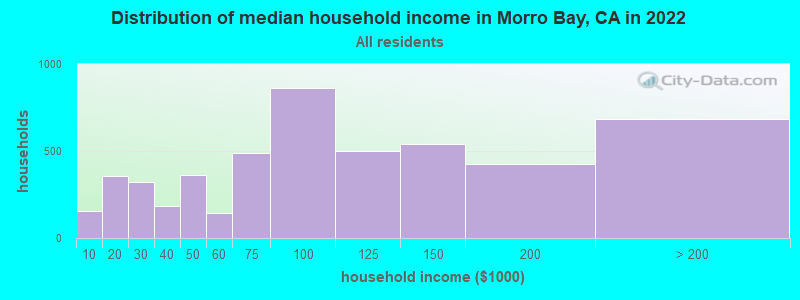
Morro Bay, CA household income distribution 156 Less than $10,000359 $10,000 to $19,999319 $20,000 to $29,999183 $30,000 to $39,999361 $40,000 to $49,999142 $50,000 to $59,999487 $60,000 to $74,999864 $75,000 to $99,999498 $100,000 to $124,999542 $125,000 to $149,999427 $150,000 to $199,999685 $200,000 or more
Home value of owner - occupied houses in 2022 in Morro Bay, CA 31 Less than $10,0009 $10,000 to $14,9996 $20,000 to $24,9993 $50,000 to $59,9993 $70,000 to $79,99941 $80,000 to $89,99993 $100,000 to $124,9993 $125,000 to $149,99994 $150,000 to $174,99918 $200,000 to $249,99920 $250,000 to $299,9998 $300,000 to $399,99964 $400,000 to $499,999747 $500,000 to $749,9991,019 $750,000 to $999,999514 $1,000,000 to $1,499,999153 $1,500,000 to $1,999,999130 $2,000,000 or moreRent paid by renters in 2022 in Morro Bay, CA 85 $250 to $2998 $300 to $3498 $400 to $44910 $500 to $54916 $550 to $59929 $700 to $74966 $750 to $79910 $800 to $89948 $900 to $999294 $1,000 to $1,249341 $1,250 to $1,499675 $1,500 to $1,999200 $2,000 to $2,499117 $2,500 to $2,99969 $3,000 to $3,49934 $3,500 or more142 No cash rent
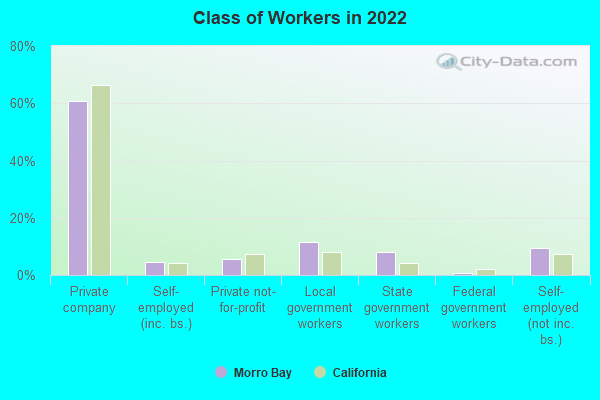
Percentage of workers working in this county: 94.3%Number of people working at home: 872 (17.5% of all workers )
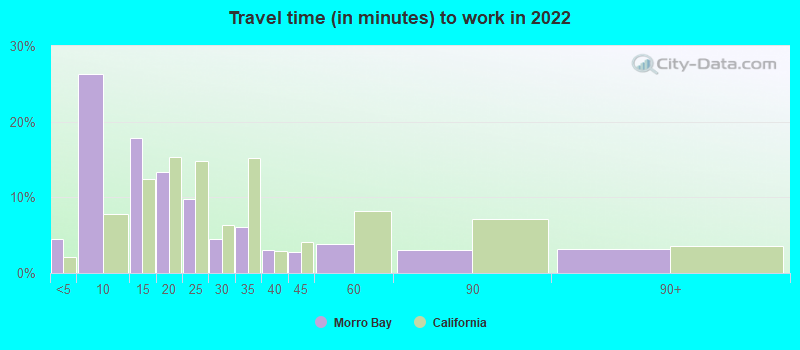
Travel time to work (commute)
Less than 5 minutes: 2025 to 9 minutes: 84310 to 14 minutes: 39815 to 19 minutes: 61820 to 24 minutes: 65925 to 29 minutes: 24530 to 34 minutes: 57335 to 39 minutes: 16540 to 44 minutes: 6245 to 59 minutes: 16460 to 89 minutes: 3090 or more minutes: 115
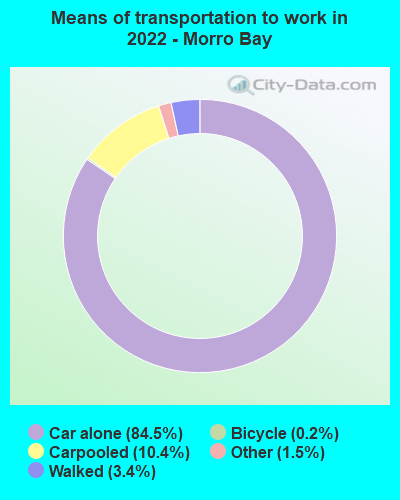
Means of transportation to work:
Drove a car alone: 3,176 (70.2%)Carpooled: 364 (8.0%)Taxi: 54 (1.2%)Bicycle: 8 (0.2%)Walked: 111 (2.5%)Worked at home: 872 (19.3%)
Unemployment by race in 2022
Unemployment rate for White non-Hispanic residents 8.3% Males12.7% FemalesUnemployment rate for Hispanic or Latino residents 5.1% Females
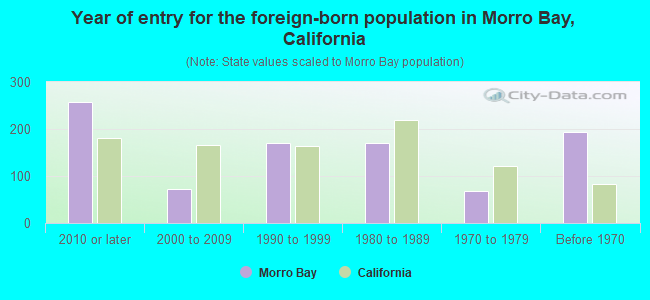
Year of entry for the foreign-born population in Morro Bay, California
257 2010 or later 73 2000 to 2009 170 1990 to 1999 171 1980 to 1989 69 1970 to 1979 194 Before 1970
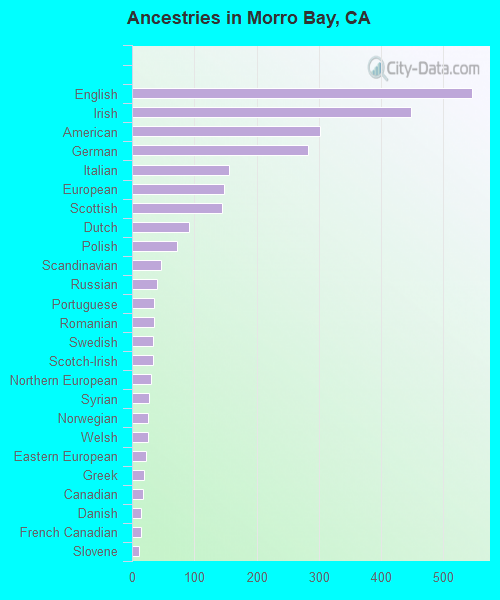
First ancestries reported:
English: 546 (14.2%)
Irish: 448 (11.6%)
American: 302 (7.8%)
German: 282 (7.3%)
Italian: 155 (4.0%)
European: 147 (3.8%)
Scottish: 144 (3.7%)
Dutch: 91 (2.4%)
Polish: 72 (1.9%)
Scandinavian: 46 (1.2%)
Russian: 40 (1.0%)
Portuguese: 36 (0.9%)
Romanian: 35 (0.9%)
Swedish: 34 (0.9%)
Scotch-Irish: 33 (0.9%)
Northern European: 30 (0.8%)
Syrian: 28 (0.7%)
Norwegian: 25 (0.6%)
Welsh: 25 (0.6%)
Eastern European: 22 (0.6%)
Greek: 20 (0.5%)
Canadian: 18 (0.5%)
Danish: 14 (0.4%)
French Canadian: 14 (0.4%)
Slovene: 11 (0.3%)
French: 8 (0.2%)
German Russian: 8 (0.2%)
Hungarian: 8 (0.2%)
Armenian: 7 (0.2%)
Yugoslavian: 7 (0.2%) Most common places of birth for foreign-born residents (%): Mexico Morro Bay:
43.9% (275)California:
37.2% (3,881,193)
Canada Morro Bay:
6.9% (43)California:
1.2% (127,477)
Netherlands Morro Bay:
6.4% (40)California:
0.2% (17,937)
Syria Morro Bay:
6.2% (39)California:
0.3% (30,949)
Philippines Morro Bay:
4.6% (29)California:
7.8% (818,297)
Japan Morro Bay:
4.5% (28)California:
1.0% (103,575)
Vietnam Morro Bay:
4.1% (26)California:
4.9% (512,335)
Scotland Morro Bay:
4.0% (25)California:
0.1% (8,444)
China, excluding Hong Kong and Taiwan Morro Bay:
3.5% (22)California:
6.6% (684,672)
Germany Morro Bay:
2.7% (17)California:
0.7% (73,304)
Kuwait Morro Bay:
2.2% (14)California:
0.1% (6,353)
Korea Morro Bay:
2.2% (14)California:
3.0% (315,248)
Place of birth for U.S.-born residents:
This state: 6,927Other state: 3,071Northeast: 815Midwest: 634South: 829West: 804 89.1% of Morro Bay residents lived in the same house 1 years ago.
Out of people who lived in different houses, 41.2% lived in this county.
Out of people who lived in different counties, 94.6% lived in California.
Morro Bay:
89.1%State average:
88.9%
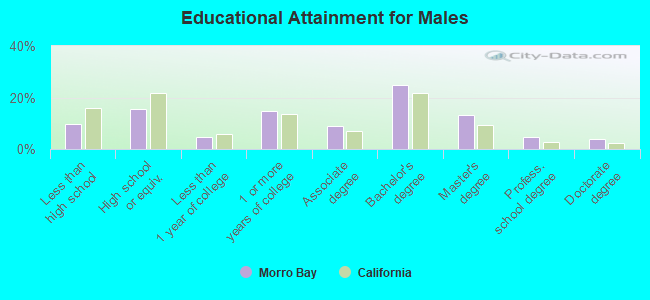
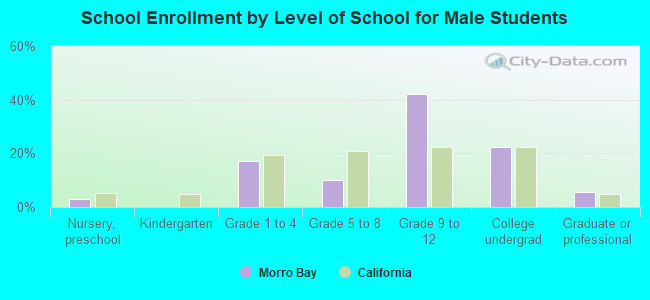
Education attainment for males 25 years and older:
No schooling: 101Nursery to 4th grade: 45th and 6th grade: 247th and 8th grade: 09th grade: 1410th grade: 3211th grade: 1812th grade, no diploma: 207High school graduate (or equivalency): 634Less than 1 year of college: 196Some college more than 1 year, no degree: 615Associate degree: 373Bachelor's degree: 1,019Master's degree: 538Professional school degree: 186Doctorate degree: 166
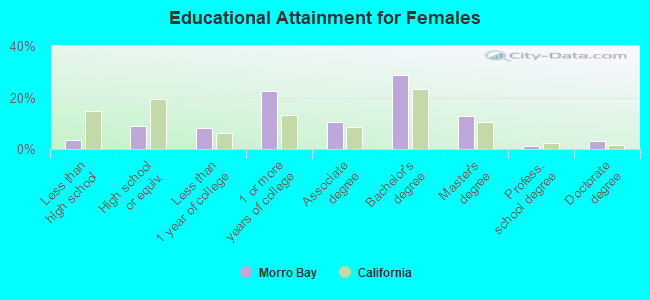
Education attainment for females 25 years and older:
No schooling: 21Nursery to 4th grade: 05th and 6th grade: 117th and 8th grade: 09th grade: 010th grade: 011th grade: 1312th grade, no diploma: 109High school graduate (or equivalency): 402Less than 1 year of college: 366Some college more than 1 year, no degree: 996Associate degree: 462Bachelor's degree: 1,277Master's degree: 574Professional school degree: 51Doctorate degree: 132
Housing units in structures:
One, detached: 4,368One, attached: 360Two: 3273 or 4: 3125 to 9: 22210 to 19: 4720 to 49: 9150 or more: 15Mobile homes: 377Boats, RVs, vans, etc.: 54Median worth of mobile homes: $180,968
Housing units lacking complete plumbing facilities in 2022: 0.4%Housing units lacking complete kitchen facilities in 2022: 1.2%House/condo owner moved in on average 12 years ago
Renter moved in on average 5 years ago
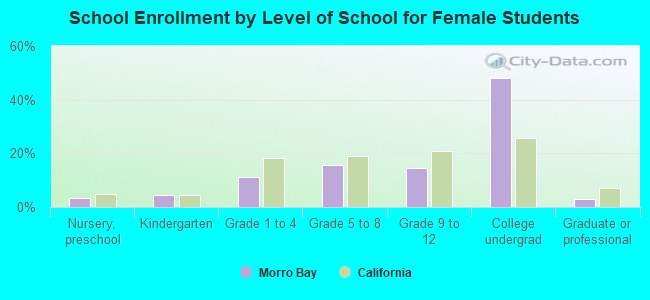
Private vs. public school enrollment:
Students in private schools in grades 1 to 8 (elementary and middle school): 59 Here:
11.0%California:
10.5%
Students in private schools in grades 9 to 12 (high school): 4 Students in private undergraduate colleges: 6 Here:
0.8%California:
15.9%