Montville, CT (Connecticut) Houses and Residents
| Montville: | $268,939 |
| Connecticut: | $347,200 |
Total population: 19,571 (Urban population: 14,167, Rural population: 4,379 (52 farm, 4,327 nonfarm))
Houses: 6,805 (6,426 occupied: 4,973 owner occupied, 1,453 renter occupied)
| % of renters here: | 23% |
| State: | 34% |
Housing density: 162 houses/condos per square mile
Median price asked for vacant for-sale houses and condos in 2022 in this county: $309,766.
Median contract rent in 2022: $1,207 (lower quartile is $927, upper quartile is $1,489)
Median rent asked for vacant for-rent units in 2022: $1,179
Median gross rent in Montville, CT in 2022: $1,354
Housing units in Montville with a mortgage: 3,079 (309 second mortgage, 312 home equity loan, 6 both second mortgage and home equity loan)
Houses without a mortgage: 1,158
Compare current foreclosures near Montville, CT:
| Photo | Address | Area | Beds / Baths | Price | Details |
|---|---|---|---|---|---|

|
#1
Lake Dr E
Oakdale, CT 06370
|
1,346 sq. feet
|
1 baths 3 beds |
$349,900
|
show details |

|
#2
Railroad Ave
Chester, CT 06412
|
2,092 sq. feet
|
2 baths 4 beds |
$484,900
|
show details |

|
#3
Rope Ferry Rd Unit N161
Waterford, CT 06385
|
576 sq. feet
|
1 baths 1 beds |
show details | |

|
#4
Mount Parnassus Rd
East Haddam, CT 06423
|
2,328 sq. feet
|
3 baths 3 beds |
show details | |

|
#5
Boswell Ave
Norwich, CT 06360
|
2,244 sq. feet
|
4 baths 4 beds |
show details | |

|
#6
New London Rd
Colchester, CT 06415
|
1,938 sq. feet
|
3 baths 3 beds |
show details | |

|
#7
Cow Hill Rd
Mystic, CT 06355
|
1,614 sq. feet
|
2 baths 3 beds |
show details | |

|
#8
Vergennes Ct
Groton, CT 06340
|
- sq. feet
|
1 baths 4 beds |
show details | |

|
#9
Hammond Ct
Colchester, CT 06415
|
1,152 sq. feet
|
1 baths 3 beds |
show details | |

|
#10
Mountain Rd
Colchester, CT 06415
|
3,158 sq. feet
|
3 baths 3 beds |
show details |
| Photo | Address | Area | Beds / Baths | Price | Details |
|---|---|---|---|---|---|

|
#11
Vauxhall St
New London, CT 06320
|
930 sq. feet
|
1 baths 3 beds |
show details | |

|
#12
Broad St
Norwich, CT 06360
|
1,703 sq. feet
|
1 baths 4 beds |
show details | |

|
#13
Candlewood Rd
Groton, CT 06340
|
2,064 sq. feet
|
1 baths 3 beds |
show details | |

|
#14
Huntington Rd
Scotland, CT 06264
|
960 sq. feet
|
1 baths 3 beds |
show details | |

|
#15
Liberty St
Pawcatuck, CT 06379
|
1,880 sq. feet
|
2 baths 4 beds |
show details | |

|
#16
Hope Valley Rd
Amston, CT 06231
|
2,128 sq. feet
|
2 baths 3 beds |
show details | |

|
#17
Norwich Rd
Plainfield, CT 06374
|
1,519 sq. feet
|
2 baths 3 beds |
show details | |

|
#18
Oakwood Rd
Niantic, CT 06357
|
1,104 sq. feet
|
1 baths 3 beds |
show details | |

|
#19
Haywardville Rd
East Haddam, CT 06423
|
1,132 sq. feet
|
1 baths 3 beds |
show details | |

|
#20
Ocean Ave
New London, CT 06320
|
990 sq. feet
|
1 baths 2 beds |
show details |
| Photo | Address | Area | Beds / Baths | Price | Details |
|---|---|---|---|---|---|

|
#21
Hemlock Rd
Groton, CT 06340
|
1,876 sq. feet
|
2 baths 3 beds |
show details | |

|
#22
Lloyd Rd
Waterford, CT 06385
|
2,208 sq. feet
|
2 baths 5 beds |
show details | |

|
#23
Elderkin Ave
Groton, CT 06340
|
672 sq. feet
|
1 baths 1 beds |
show details | |

|
#24
Blacksmith Dr
Ledyard, CT 06339
|
1,196 sq. feet
|
2 baths 4 beds |
show details | |

|
#25
Breezy Knls
Mystic, CT 06355
|
1,376 sq. feet
|
1 baths 3 beds |
show details | |

|
#26
Oak St
Old Lyme, CT 06371
|
1,416 sq. feet
|
2 baths 3 beds |
show details | |

|
#27
Valley Rd
Groton, CT 06340
|
1,405 sq. feet
|
1 baths 3 beds |
show details | |

|
#28
Moxley Rd
Uncasville, CT 06382
|
1,118 sq. feet
|
2 baths 3 beds |
show details | |

|
#29
Lincoln Rd
Waterford, CT 06385
|
1,132 sq. feet
|
1 baths 3 beds |
show details | |

|
#30
Sachem Ln
Ledyard, CT 06339
|
1,200 sq. feet
|
1 baths 3 beds |
show details |
| Photo | Address | Area | Beds / Baths | Price | Details |
|---|---|---|---|---|---|

|
#31
1st Ave
Waterford, CT 06385
|
1,547 sq. feet
|
1 baths 4 beds |
show details | |

|
#32
Burgess Pl
Groton, CT 06340
|
1,082 sq. feet
|
1 baths 3 beds |
show details | |

|
#33
School St
New London, CT 06320
|
1,664 sq. feet
|
2 baths 2 beds |
show details | |

|
#34
Parum Rd # 3-05
Colchester, CT 06415
|
1,503 sq. feet
|
1 baths 3 beds |
show details | |

|
#35
Carolina Dr Apt 21
Oakdale, CT 06370
|
960 sq. feet
|
1 baths 2 beds |
show details | |

|
#36
Woodmont Cir
East Haddam, CT 06423
|
2,128 sq. feet
|
2 baths 3 beds |
show details | |

|
#37
Glasgo Rd Lot 208
Jewett City, CT 06351
|
1,680 sq. feet
|
2 baths 3 beds |
show details | |

|
#38
Norwich Rd
Plainfield, CT 06374
|
1,278 sq. feet
|
1 baths 3 beds |
show details | |

|
#39
Kelsey Hill Rd
Deep River, CT 06417
|
2,848 sq. feet
|
3 baths 3 beds |
show details | |

|
#40
Scenic View Dr Apt 21
Deep River, CT 06417
|
864 sq. feet
|
1 baths 2 beds |
show details |
| Photo | Address | Area | Beds / Baths | Price | Details |
|---|---|---|---|---|---|

|
#41
Roode Rd
Jewett City, CT 06351
|
1,104 sq. feet
|
1 baths 3 beds |
show details | |

|
#42
Lumber Yard Rd
East Haddam, CT 06423
|
2,400 sq. feet
|
2 baths 6 beds |
show details | |

|
#43
Westbrook Rd
Centerbrook, CT 06409
|
1,776 sq. feet
|
1 baths 2 beds |
show details | |

|
#44
Cedar Meadow Rd
Moodus, CT 06469
|
2,030 sq. feet
|
2 baths 3 beds |
show details | |

|
#45
Main St
Deep River, CT 06417
|
1,248 sq. feet
|
2 baths 3 beds |
show details | |

|
#46
Prospect St # A
Deep River, CT 06417
|
1,486 sq. feet
|
2 baths 2 beds |
show details | |

|
#47
Reutemann Rd
North Stonington, CT 06359
|
1,296 sq. feet
|
1 baths 3 beds |
show details | |

|
#48
Glasgo Rd Lot 208
Jewett City, CT 06351
|
1,680 sq. feet
|
2 baths 3 beds |
show details | |

|
#49
Kennedy Dr
Colchester, CT 06415
|
1,132 sq. feet
|
2 baths 3 beds |
show details | |

|
Check over 1 million property listings on Foreclosure.com!
|
browse all offers | |||

Household type by relationship:
Households: 261,273- In family households: 214,652 (47,484 male householders, 22,378 female householders)
52,173 spouses, 73,395 children (67,999 natural, 1,935 adopted, 3,461 stepchildren), 4,214 grandchildren, 2,063 brothers or sisters, 2,316 parents, foster children, 2,625 other relatives, 6,387 non-relatives
- In nonfamily households: 46,621 (18,056 male householders (13,616 living alone)), 19,139 female householders (15,978 living alone)), 9,426 nonrelatives
- In group quarters: 12,782 (5,482 institutionalized population)
43,726 married couples with children.
14,569 single-parent households (3,084 men, 11,485 women).
90.7% of residents of Montville speak English at home.
4.7% of residents speak Spanish at home (65% speak English very well, 16% speak English well, 17% speak English not well, 3% don't speak English at all).
2.7% of residents speak other Indo-European language at home (81% speak English very well, 9% speak English well, 9% speak English not well, 1% don't speak English at all).
1.7% of residents speak Asian or Pacific Island language at home (43% speak English very well, 37% speak English well, 20% speak English not well).
0.3% of residents speak other language at home (78% speak English very well, 22% speak English well).
Foreign born population: 1,375 (6.8%)
(68.1% of them are naturalized citizens)
| Here: | 6.6 |
| State: | 6.5 |
| Here: | 4.2 |
| State: | 4.0 |

- Bedrooms in owner-occupied houses and condos in Montville, Connecticut
- 0no bedroom
- 1211 bedroom
- 9202 bedrooms
- 2,6923 bedrooms
- 1,0834 bedrooms
- 1575+ bedrooms

- Bedrooms in renter-occupied apartments in Montville, Connecticut
- 11no bedroom
- 3721 bedroom
- 7872 bedrooms
- 2453 bedrooms
- 384 bedrooms
- 05+ bedrooms

- Cars and other vehicles available in Montville in owner-occupied houses/condos
- 129no vehicle
- 1,2311 vehicle
- 2,3782 vehicles
- 8943 vehicles
- 2254 vehicles
- 1165+ vehicles

- Cars and other vehicles available in Montville in renter-occupied apartments
- 79no vehicle
- 7301 vehicle
- 5562 vehicles
- 643 vehicles
- 184 vehicles
- 65+ vehicles

- Rooms in owner-occupied houses in Montville, Connecticut
- 01 room
- 112 rooms
- 853 rooms
- 4284 rooms
- 1,0815 rooms
- 1,3036 rooms
- 1,0437 rooms
- 5978 rooms
- 4259+ rooms

- Rooms in renter-occupied apartments in Montville, Connecticut
- 111 room
- 1692 rooms
- 2073 rooms
- 5084 rooms
- 2935 rooms
- 1456 rooms
- 747 rooms
- 198 rooms
- 279+ rooms


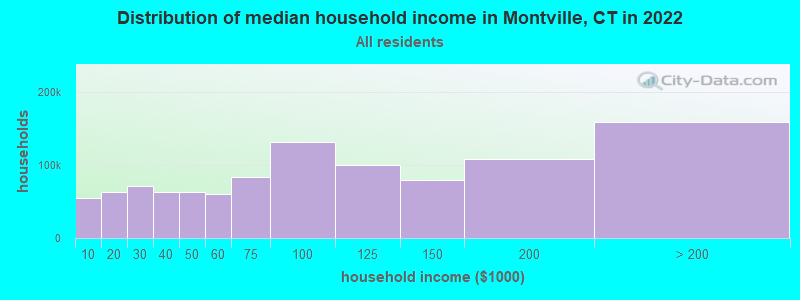
Montville, CT household income distribution

- 54,791Less than $10,000
- 62,440$10,000 to $19,999
- 69,949$20,000 to $29,999
- 61,742$30,000 to $39,999
- 61,971$40,000 to $49,999
- 60,132$50,000 to $59,999
- 82,473$60,000 to $74,999
- 129,559$75,000 to $99,999
- 99,228$100,000 to $124,999
- 79,177$125,000 to $149,999
- 107,795$150,000 to $199,999
- 157,485$200,000 or more
Percentage of workers working in this county: 88.7%
Number of people working at home: 1,626 (16.3% of all workers)
Travel time to work (commute)
- Less than 5 minutes: 251
- 5 to 9 minutes: 752
- 10 to 14 minutes: 1,023
- 15 to 19 minutes: 1,726
- 20 to 24 minutes: 2,004
- 25 to 29 minutes: 939
- 30 to 34 minutes: 892
- 35 to 39 minutes: 135
- 40 to 44 minutes: 141
- 45 to 59 minutes: 339
- 60 to 89 minutes: 393
- 90 or more minutes: 152
Means of transportation to work:
- Drove a car alone: 7,771 (87.3%)
- Carpooled: 834 (9.4%)
- Bus or trolley bus: 28 (0.3%)
- Subway or elevated: 10 (0.1%)
- Taxi: 8 (0.1%)
- Motorcycle: 5 (0.1%)
- Bicycle: 6 (0.1%)
- Walked: 58 (0.7%)
- Other means: 27 (0.3%)
- Worked at home: 153 (1.7%)


- Year of entry for the foreign-born population in Montville, Connecticut
- 1301995 to March 2000
- 1581990 to 1994
- 1181985 to 1989
- 851980 to 1984
- 471975 to 1979
- 481970 to 1974
- 981965 to 1969
- 196Before 1965
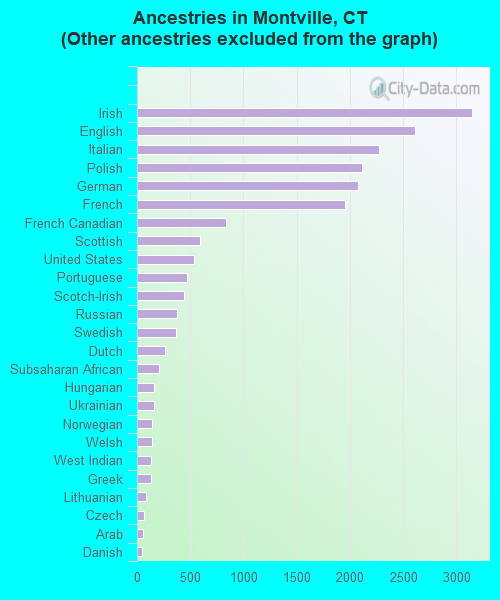
First ancestries reported:
- Other: 3,196 (14.1%)
- Irish: 3,148 (13.9%)
- English: 2,612 (11.5%)
- Italian: 2,276 (10.1%)
- Polish: 2,117 (9.4%)
- German: 2,073 (9.2%)
- French: 1,953 (8.6%)
- French Canadian: 834 (3.7%)
- Scottish: 592 (2.6%)
- United States: 532 (2.4%)
- Portuguese: 467 (2.1%)
- Scotch-Irish: 443 (2.0%)
- Russian: 380 (1.7%)
- Swedish: 367 (1.6%)
- Dutch: 265 (1.2%)
- Subsaharan African: 207 (0.9%)
- Hungarian: 162 (0.7%)
- Ukrainian: 159 (0.7%)
- Norwegian: 145 (0.6%)
- Welsh: 144 (0.6%)
- West Indian: 132 (0.6%)
- Greek: 127 (0.6%)
- Lithuanian: 82 (0.4%)
- Czech: 66 (0.3%)
- Arab: 55 (0.2%)
- Danish: 45 (0.2%)
- Slovak: 42 (0.2%)
- Swiss: 12 (0.05%)
Most common places of birth for foreign-born residents (%):
| Montville: | 14.4% (127) |
| Connecticut: | 4.4% (16,395) |
| Montville: | 9.0% (79) |
| Connecticut: | 1.7% (6,247) |
| Montville: | 8.3% (73) |
| Connecticut: | 0.9% (3,317) |
| Montville: | 8.0% (70) |
| Connecticut: | 2.5% (9,358) |
| Montville: | 6.4% (56) |
| Connecticut: | 0.6% (2,106) |
| Montville: | 4.8% (42) |
| Connecticut: | 1.2% (4,344) |
| Montville: | 4.4% (39) |
| Connecticut: | 1.4% (5,021) |
| Montville: | 4.3% (38) |
| Connecticut: | 3.2% (12,009) |
| Montville: | 4.0% (35) |
| Connecticut: | 7.2% (26,819) |
| Montville: | 3.9% (34) |
| Connecticut: | 6.9% (25,507) |
| Montville: | 3.0% (26) |
| Connecticut: | 0.3% (1,110) |
| Montville: | 2.6% (23) |
| Connecticut: | 0.7% (2,692) |
| Montville: | 2.6% (23) |
| Connecticut: | 0.7% (2,569) |
| Montville: | 2.6% (23) |
| Connecticut: | 5.2% (19,083) |
| Montville: | 2.3% (20) |
| Connecticut: | 3.1% (11,432) |
| Montville: | 1.7% (15) |
| Connecticut: | 2.3% (8,500) |
| Montville: | 1.7% (15) |
| Connecticut: | 0.4% (1,527) |
| Montville: | 1.7% (15) |
| Connecticut: | 7.0% (26,023) |
| Montville: | 1.6% (14) |
| Connecticut: | 3.6% (13,282) |
Place of birth for U.S.-born residents:
- This state: 11,434
- Other state: 5,714
- Northeast: 3,666
- Midwest: 693
- South: 996
- West: 359
57% of Montville residents lived in the same house 5 years ago.
Out of people who lived in different houses, 65% lived in this county.
Out of people who lived in different counties, 45% lived in Connecticut.
Education attainment for males 25 years and older:
- No schooling: 39
- Nursery to 4th grade: 9
- 5th and 6th grade: 55
- 7th and 8th grade: 210
- 9th grade: 137
- 10th grade: 257
- 11th grade: 209
- 12th grade, no diploma: 221
- High school graduate (or equivalency): 2,586
- Less than 1 year of college: 568
- Some college more than 1 year, no degree: 859
- Associate degree: 407
- Bachelor's degree: 667
- Master's degree: 338
- Professional school degree: 79
- Doctorate degree: 20

Education attainment for females 25 years and older:
- No schooling: 12
- Nursery to 4th grade: 14
- 5th and 6th grade: 12
- 7th and 8th grade: 166
- 9th grade: 124
- 10th grade: 186
- 11th grade: 173
- 12th grade, no diploma: 205
- High school graduate (or equivalency): 2,370
- Less than 1 year of college: 423
- Some college more than 1 year, no degree: 657
- Associate degree: 476
- Bachelor's degree: 608
- Master's degree: 414
- Professional school degree: 76
- Doctorate degree: 14


Housing units in structures:
- One, detached: 5,110
- One, attached: 97
- Two: 286
- 3 or 4: 427
- 5 to 9: 229
- 10 to 19: 79
- 20 to 49: 78
- 50 or more: 7
- Mobile homes: 492
Median worth of mobile homes: $50,717
Housing units lacking complete kitchen facilities: 0.2%

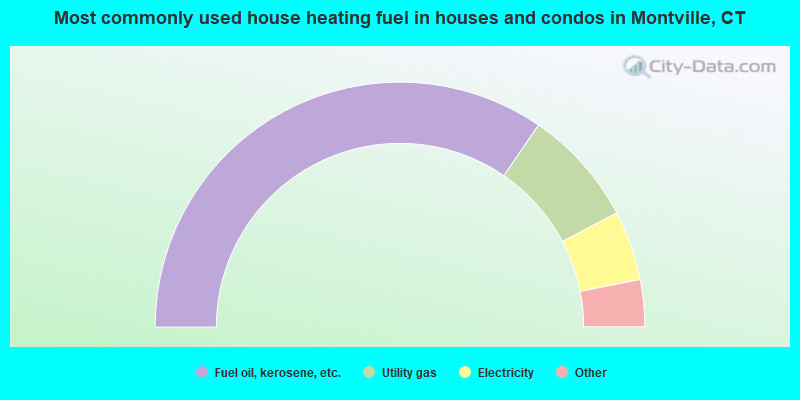
- 69.1%Fuel oil, kerosene, etc.
- 15.4%Utility gas
- 9.2%Electricity
- 3.3%Wood
- 2.7%Bottled, tank, or LP gas
- 0.1%Coal or coke
- 0.1%Other fuel
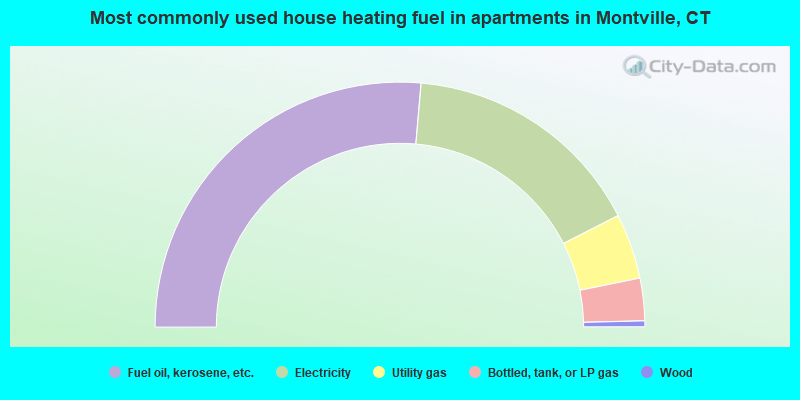
- 52.7%Fuel oil, kerosene, etc.
- 32.2%Electricity
- 8.6%Utility gas
- 5.6%Bottled, tank, or LP gas
- 0.8%Wood
Private vs. public school enrollment:
| Here: | 7.5% |
| Connecticut: | 9.9% |
| Here: | 5.1% |
| Connecticut: | 11.0% |
| Here: | 23.7% |
| Connecticut: | 33.4% |


