Montecito, CA (California) Houses and Residents
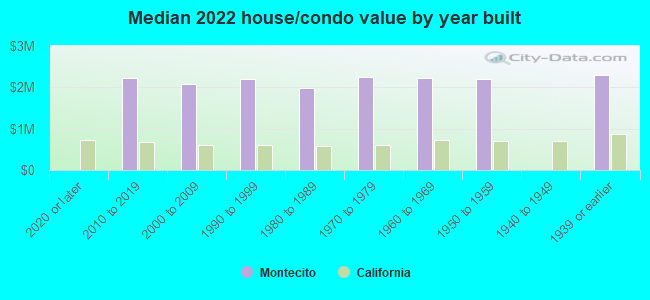
| Montecito: | over $2,083,661 |
| California: | $715,900 |
Mean price in 2022:
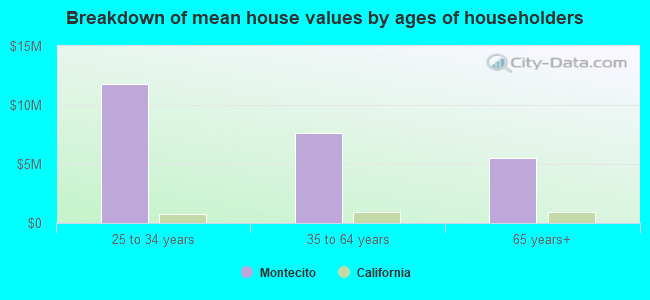
Detached houses: $5,152,196
Here: $5,152,196 State: $988,808 Townhouses or other attached units: $2,116,067
Here: $2,116,067 State: $838,546 In 2-unit structures: $2,774,429
Here: $2,774,429 State: $1,138,100 In 5-or-more-unit structures: $2,088,005
Here: $2,088,005 State: $730,996
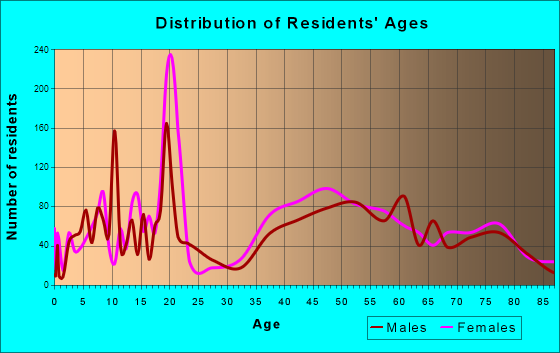
Total population: 8,965 (All urban)
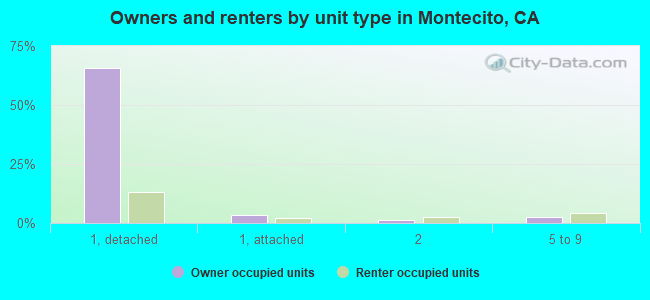
Houses: 4,194 (3,294 occupied: 2,378 owner occupied, 934 renter occupied)
| % of renters here: | 28% |
| State: | 44% |
Housing density: 450 houses/condos per square mile
Median price asked for vacant for-sale houses and condos in 2022: $3,789,388.
Median contract rent in 2022: over $2,000 (lower quartile is over $2,000, upper quartile is over $2,000)
Median rent asked for vacant for-rent units in 2022: $5,005
Median gross rent in Montecito, CA in 2022: over $2,000
Housing units in Montecito with a mortgage: 993 (159 second mortgage, 21 home equity loan, 152 both second mortgage and home equity loan)
Houses without a mortgage: 0
Median household income for houses/condos with a mortgage: $254,424
Median household income for apartments without a mortgage: $194,403
Median monthly housing costs: $3,529
Compare current foreclosures near Montecito, CA:
| Photo | Address | Area | Beds / Baths | Price | Details |
|---|---|---|---|---|---|

|
#1
El Rodeo Rd
Santa Barbara, CA 93110
|
3,264 sq. feet
|
4 baths 4 beds |
show details | |

|
#2
San Andres St
Santa Barbara, CA 93101
|
620 sq. feet
|
2 baths 3 beds |
show details | |

|
#3
Cheltenham Rd
Santa Barbara, CA 93105
|
1,032 sq. feet
|
1 baths 3 beds |
show details | |

|
#4
Santa Rosa Ln
Santa Barbara, CA 93108
|
- sq. feet
|
1 baths 2 beds |
show details | |

|
#5
Del Oro Ave
Santa Barbara, CA 93109
|
- sq. feet
|
3 baths 5 beds |
show details | |

|
#6
Murrell Rd
Santa Barbara, CA 93109
|
1,383 sq. feet
|
2 baths 2 beds |
show details | |

|
#7
Valdivia Dr
Santa Barbara, CA 93110
|
1,403 sq. feet
|
2 baths 4 beds |
show details | |

|
#8
Valdivia Dr
Santa Barbara, CA 93110
|
1,402 sq. feet
|
2 baths 4 beds |
show details | |

|
#9
Rhoads Ave
Santa Barbara, CA 93111
|
1,967 sq. feet
|
3 baths 4 beds |
show details | |

|
#10
Orange Ave
Goleta, CA 93117
|
1,637 sq. feet
|
2 baths 4 beds |
show details |
| Photo | Address | Area | Beds / Baths | Price | Details |
|---|---|---|---|---|---|

|
#11
Santa Ynez Ct
Santa Barbara, CA 93103
|
1,844 sq. feet
|
2 baths 3 beds |
show details | |

|
#12
San Rafael Ave
Santa Barbara, CA 93109
|
1,068 sq. feet
|
1 baths 3 beds |
show details | |

|
#13
San Julio Ave
Santa Barbara, CA 93111
|
- sq. feet
|
2 baths 4 beds |
show details | |

|
#14
Painted Cave Rd
Santa Barbara, CA 93105
|
- sq. feet
|
2 baths 2 beds |
show details | |

|
#15
Saint Marys Ln
Santa Barbara, CA 93111
|
- sq. feet
|
2 baths 4 beds |
show details | |

|
#16
N Fairview Ave Unit 6
Goleta, CA 93117
|
- sq. feet
|
1 baths 2 beds |
show details | |

|
#17
Madrona Dr
Santa Barbara, CA 93105
|
- sq. feet
|
1 baths 2 beds |
show details | |

|
#18
Calle Linares
Santa Barbara, CA 93109
|
- sq. feet
|
4 baths 4 beds |
show details | |

|
#19
Calle Palo Colorado
Santa Barbara, CA 93105
|
- sq. feet
|
2 baths 3 beds |
show details | |

|
#20
Calle Rosales
Santa Barbara, CA 93105
|
- sq. feet
|
2 baths 3 beds |
show details |
| Photo | Address | Area | Beds / Baths | Price | Details |
|---|---|---|---|---|---|

|
#21
Dolores Dr
Santa Barbara, CA 93109
|
- sq. feet
|
2 baths 4 beds |
show details | |

|
#22
W Islay St
Santa Barbara, CA 93101
|
- sq. feet
|
1 baths 2 beds |
show details | |

|
#23
Barling Ter
Goleta, CA 93117
|
- sq. feet
|
2 baths 2 beds |
show details | |

|
#24
Kenwood Rd
Santa Barbara, CA 93109
|
- sq. feet
|
2 baths 3 beds |
show details | |

|
#25
Del Oro Ave
Santa Barbara, CA 93109
|
- sq. feet
|
3 baths 5 beds |
show details | |

|
#26
Elizabeth St
Santa Barbara, CA 93103
|
- sq. feet
|
1 baths 2 beds |
show details | |

|
#27
Anacapa St
Santa Barbara, CA 93105
|
- sq. feet
|
3 baths 3 beds |
show details | |

|
#28
Orange Ave Apt 1
Santa Barbara, CA 93101
|
- sq. feet
|
- baths - beds |
show details | |

|
#29
Christmas Tree Ln
Santa Barbara, CA 93111
|
- sq. feet
|
- baths - beds |
show details | |

|
#30
Ladera St Apt A
Santa Barbara, CA 93101
|
- sq. feet
|
- baths - beds |
show details |
| Photo | Address | Area | Beds / Baths | Price | Details |
|---|---|---|---|---|---|

|
#31
Garden St Apt 3
Santa Barbara, CA 93101
|
- sq. feet
|
- baths - beds |
show details | |

|
#32
Dexter Dr Apt 17
Santa Barbara, CA 93110
|
- sq. feet
|
- baths - beds |
show details | |

|
#33
La Espada Dr
Santa Barbara, CA 93111
|
- sq. feet
|
- baths - beds |
show details | |

|
#34
E Micheltorena St Apt 33
Santa Barbara, CA 93101
|
- sq. feet
|
- baths - beds |
show details | |

|
#35
E Micheltorena St Apt 22
Santa Barbara, CA 93101
|
- sq. feet
|
- baths - beds |
show details | |

|
#36
E Micheltorena St Apt 31
Santa Barbara, CA 93101
|
- sq. feet
|
- baths - beds |
show details | |

|
#37
Encina Rd Apt 101
Goleta, CA 93117
|
- sq. feet
|
- baths - beds |
show details | |

|
#38
E Anapamu St # 256
Santa Barbara, CA 93101
|
- sq. feet
|
- baths - beds |
show details | |

|
#39
Chapala St # 304
Santa Barbara, CA 93101
|
- sq. feet
|
- baths - beds |
show details | |

|
#40
Del Parque Unit F
Santa Barbara, CA 93103
|
- sq. feet
|
- baths - beds |
show details |
| Photo | Address | Area | Beds / Baths | Price | Details |
|---|---|---|---|---|---|

|
#41
Willow Springs Ln Apt 102
Goleta, CA 93117
|
- sq. feet
|
- baths - beds |
show details | |

|
#42
Hollister Ave # 5
Goleta, CA 93117
|
- sq. feet
|
- baths - beds |
show details | |

|
#43
Picasso Rd Apt 12
Goleta, CA 93117
|
- sq. feet
|
- baths - beds |
show details | |

|
#44
Orange Blossom Ln
Goleta, CA 93117
|
- sq. feet
|
- baths - beds |
show details | |

|
#45
San Bergamo Dr
Goleta, CA 93117
|
- sq. feet
|
- baths - beds |
show details | |

|
#46
Santa Barbara St Apt A
Santa Barbara, CA 93101
|
- sq. feet
|
- baths - beds |
show details | |

|
#47
Linden Ave # B
Carpinteria, CA 93013
|
- sq. feet
|
- baths - beds |
show details | |

|
#48
Via Lucero Apt 15
Santa Barbara, CA 93110
|
- sq. feet
|
- baths - beds |
show details | |

|
#49
Dorrance Way
Carpinteria, CA 93013
|
- sq. feet
|
- baths - beds |
show details | |

|
Check over 1 million property listings on Foreclosure.com!
|
browse all offers | |||

Latest news about housing in Montecito, CA collected exclusively by city-data.com from local newspapers, TV, and radio stations


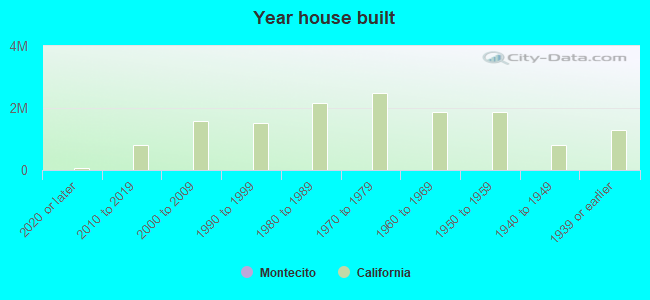
Median year apartment built: 1972
Household type by relationship:
Households: 8,502- Male householders: 1,479 (293 living alone), Female householders: 1,761 (690 living alone)
1,811 spouses (1,804 opposite-sex spouses), 119 unmarried partners, (106 opposite-sex unmarried partners), 1,558 children (1,519 natural, 28 adopted, 9 stepchildren), 106 grandchildren, 32 brothers or sisters, 78 parents, 0 foster children, 134 other relatives, 296 non-relatives
- In group quarters: 1,123
Size of family households: 1,372 2-persons, 215 3-persons, 371 4-persons, 91 5-persons, 8 6-persons, 33 7-or-more-persons.
Size of nonfamily households: 987 1-person, 157 2-persons, 36 3-persons, 22 7-or-more-persons.
851 married couples with children.
165 single-parent households (44 men, 121 women).
85.2% of residents of Montecito speak English at home.
5.1% of residents speak Spanish at home (72% speak English very well, 7% speak English well, 13% speak English not well, 8% don't speak English at all).
8.2% of residents speak other Indo-European language at home (91% speak English very well, 9% speak English well).
2.3% of residents speak Asian or Pacific Island language at home (85% speak English very well, 15% speak English well).
0.1% of residents speak other language at home (100% speak English very well).
Foreign born population: 869 (10.2%)
(84.7% of them are naturalized citizens)
| Here: | 7.4 |
| State: | 6.0 |
| Here: | 4.6 |
| State: | 3.9 |
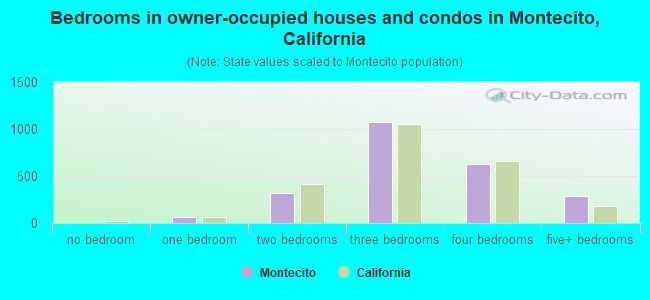
- Bedrooms in owner-occupied houses and condos in Montecito, California
- 5no bedroom
- 591 bedroom
- 3222 bedrooms
- 1,0753 bedrooms
- 6284 bedrooms
- 2895+ bedrooms
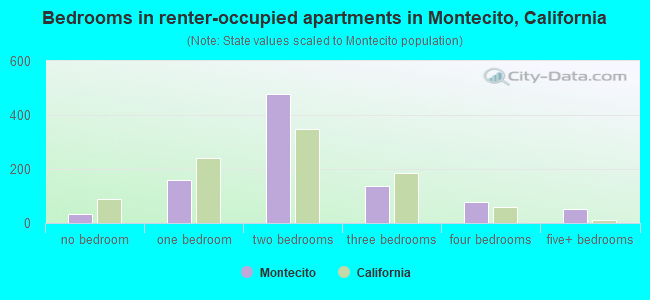
- Bedrooms in renter-occupied apartments in Montecito, California
- 32no bedroom
- 1581 bedroom
- 4792 bedrooms
- 1363 bedrooms
- 794 bedrooms
- 515+ bedrooms
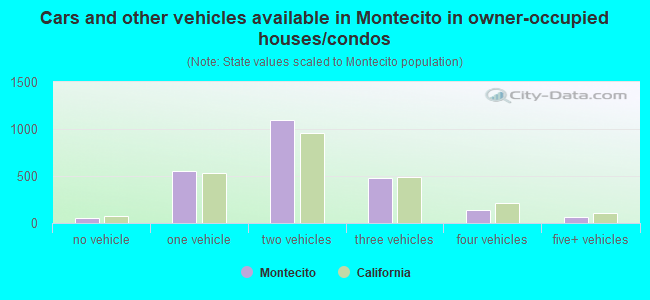
- Cars and other vehicles available in Montecito in owner-occupied houses/condos
- 51no vehicle
- 5541 vehicle
- 1,0952 vehicles
- 4743 vehicles
- 1424 vehicles
- 625+ vehicles
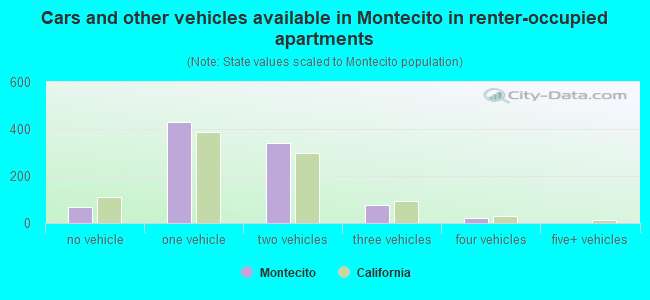
- Cars and other vehicles available in Montecito in renter-occupied apartments
- 70no vehicle
- 4281 vehicle
- 3392 vehicles
- 763 vehicles
- 204 vehicles
- 05+ vehicles
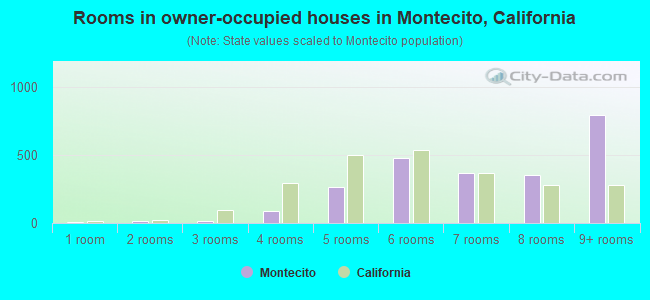
- Rooms in owner-occupied houses in Montecito, California
- 51 room
- 182 rooms
- 153 rooms
- 874 rooms
- 2655 rooms
- 4756 rooms
- 3697 rooms
- 3528 rooms
- 7939+ rooms
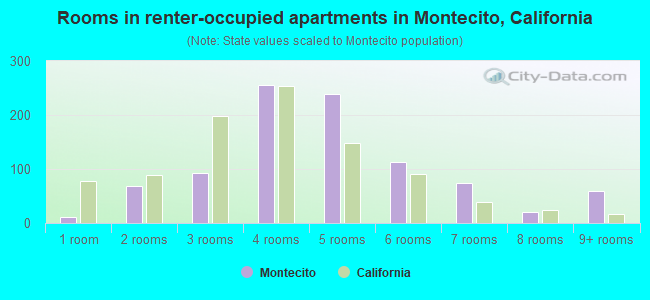
- Rooms in renter-occupied apartments in Montecito, California
- 121 room
- 682 rooms
- 933 rooms
- 2554 rooms
- 2385 rooms
- 1136 rooms
- 757 rooms
- 208 rooms
- 599+ rooms
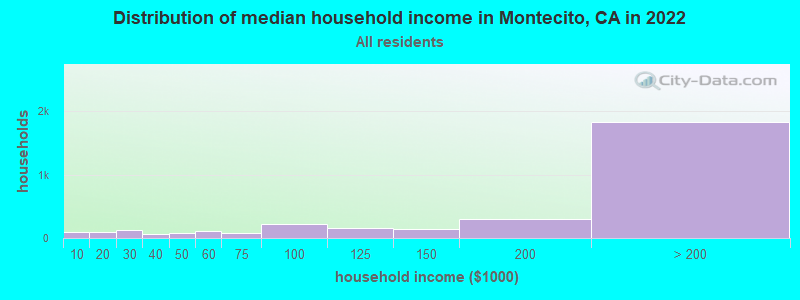
Montecito, CA household income distribution

- 100Less than $10,000
- 97$10,000 to $19,999
- 127$20,000 to $29,999
- 68$30,000 to $39,999
- 79$40,000 to $49,999
- 118$50,000 to $59,999
- 82$60,000 to $74,999
- 214$75,000 to $99,999
- 156$100,000 to $124,999
- 141$125,000 to $149,999
- 304$150,000 to $199,999
- 1,829$200,000 or more
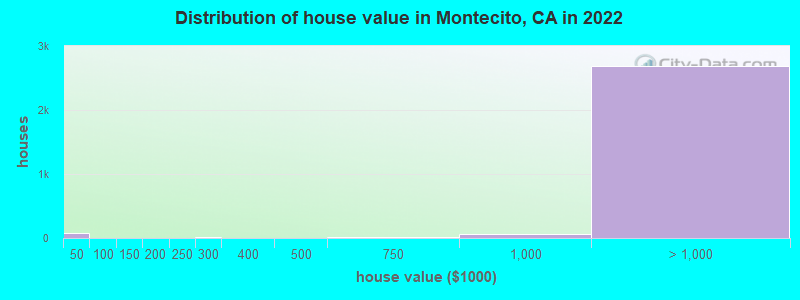
Home value of owner - occupied houses in 2022 in Montecito, CA
-
- 34Less than $10,000
- 28$10,000 to $14,999
- 8$25,000 to $29,999
- 6$100,000 to $124,999
- 5$200,000 to $249,999
- 7$250,000 to $299,999
- 5$300,000 to $399,999
- 2$400,000 to $499,999
- 11$500,000 to $749,999
- 61$750,000 to $999,999
- 131$1,000,000 to $1,499,999
- 124$1,500,000 to $1,999,999
- 2,437$2,000,000 or more
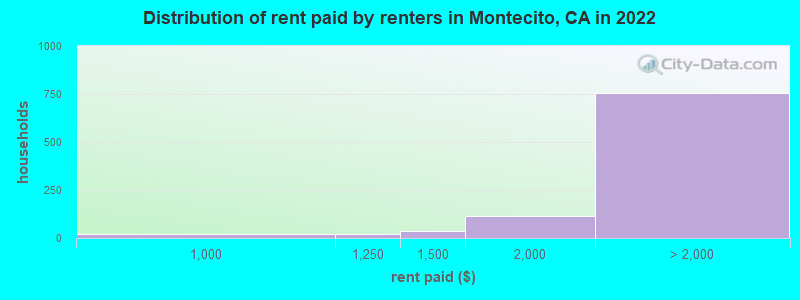
Rent paid by renters in 2022 in Montecito, CA
-
- 5$750 to $799
- 23$900 to $999
- 22$1,000 to $1,249
- 38$1,250 to $1,499
- 116$1,500 to $1,999
- 140$2,000 to $2,499
- 7$2,500 to $2,999
- 78$3,000 to $3,499
- 449$3,500 or more
- 80No cash rent
Percentage of workers working in this county: 92.1%
Number of people working at home: 1,075 (35.7% of all workers)
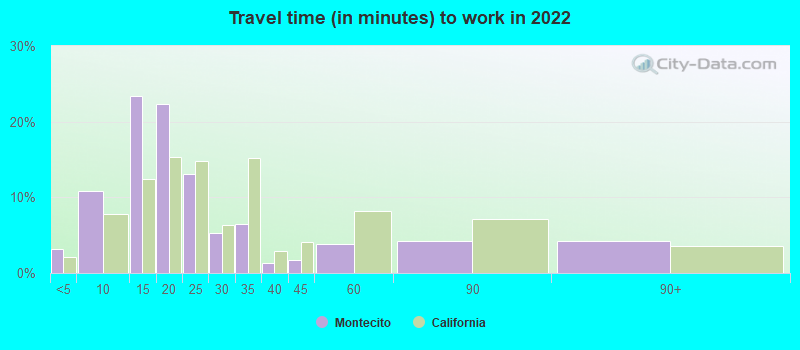
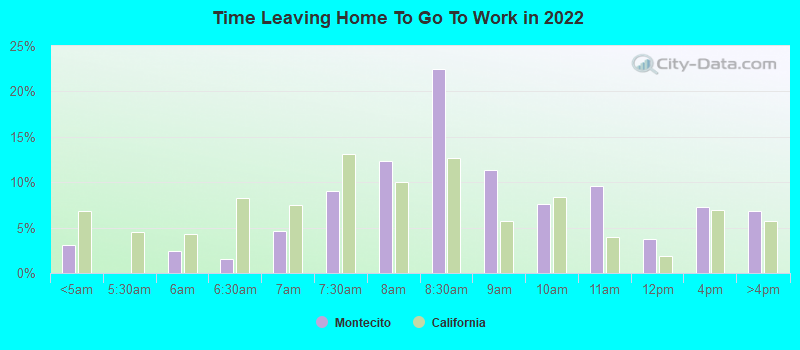
Travel time to work (commute)
- Less than 5 minutes: 219
- 5 to 9 minutes: 420
- 10 to 14 minutes: 430
- 15 to 19 minutes: 507
- 20 to 24 minutes: 154
- 25 to 29 minutes: 68
- 30 to 34 minutes: 34
- 35 to 39 minutes: 3
- 40 to 44 minutes: 48
- 45 to 59 minutes: 111
- 60 to 89 minutes: 2
- 90 or more minutes: 74
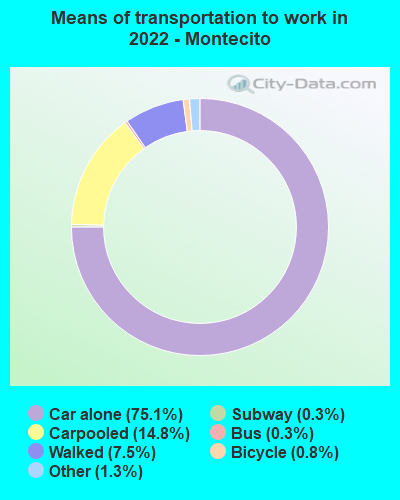
Means of transportation to work:
- Drove a car alone: 2,978 (58.7%)
- Carpooled: 542 (10.7%)
- Bus: 12 (0.2%)
- Long-distance train or commuter rail: 11 (0.2%)
- Taxi: 81 (1.6%)
- Bicycle: 36 (0.7%)
- Walked: 451 (8.9%)
- Worked at home: 1,075 (21.2%)
- Unemployment by race in 2022
- Unemployment rate for White non-Hispanic residents
- 1.2%Males
- 8.3%Females
- Unemployment rate for Asian residents
- 23.3%Males
- 6.9%Females
- Unemployment rate for Hispanic or Latino residents
- 5.1%Females
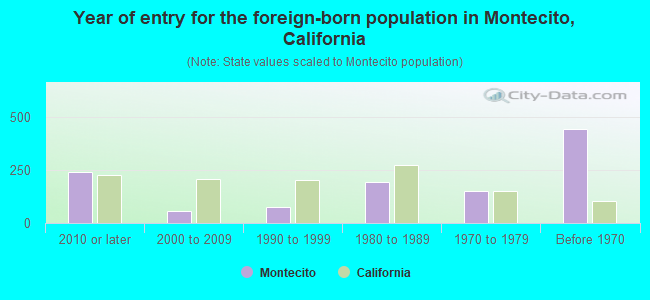
- Year of entry for the foreign-born population in Montecito, California
- 2412010 or later
- 582000 to 2009
- 741990 to 1999
- 1911980 to 1989
- 1501970 to 1979
- 442Before 1970
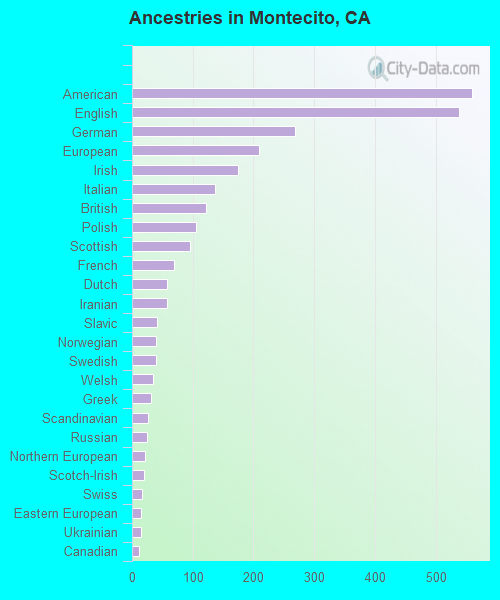
First ancestries reported:
- American: 560 (15.2%)
- English: 539 (14.6%)
- German: 269 (7.3%)
- European: 209 (5.7%)
- Irish: 174 (4.7%)
- Italian: 136 (3.7%)
- British: 122 (3.3%)
- Polish: 106 (2.9%)
- Scottish: 96 (2.6%)
- French: 70 (1.9%)
- Dutch: 58 (1.6%)
- Iranian: 58 (1.6%)
- Slavic: 42 (1.1%)
- Norwegian: 40 (1.1%)
- Swedish: 40 (1.1%)
- Welsh: 35 (0.9%)
- Greek: 31 (0.8%)
- Scandinavian: 26 (0.7%)
- Russian: 24 (0.7%)
- Northern European: 21 (0.6%)
- Scotch-Irish: 19 (0.5%)
- Swiss: 16 (0.4%)
- Eastern European: 15 (0.4%)
- Ukrainian: 15 (0.4%)
- Canadian: 11 (0.3%)
- Romanian: 10 (0.3%)
- Israeli: 10 (0.3%)
- Australian: 7 (0.2%)
- Danish: 7 (0.2%)
- South African: 7 (0.2%)
- Albanian: 7 (0.2%)
- Portuguese: 6 (0.2%)
- Macedonian: 5 (0.1%)
- Lithuanian: 4 (0.1%)
- Bulgarian: 4 (0.1%)
- Hungarian: 4 (0.1%)
- Czechoslovakian: 3 (0.08%)
Most common places of birth for foreign-born residents (%):
| Montecito: | 28.2% (258) |
| California: | 0.2% (16,998) |
| Montecito: | 10.8% (99) |
| California: | 0.6% (60,582) |
| Montecito: | 9.6% (88) |
| California: | 1.2% (127,477) |
| Montecito: | 7.9% (72) |
| California: | 6.6% (684,672) |
| Montecito: | 6.3% (58) |
| California: | 37.2% (3,881,193) |
| Montecito: | 5.0% (46) |
| California: | 0.4% (40,224) |
| Montecito: | 4.8% (44) |
| California: | 2.0% (206,004) |
| Montecito: | 3.3% (30) |
| California: | 0.2% (23,338) |
| Montecito: | 2.8% (26) |
| California: | 0.1% (12,221) |
| Montecito: | 2.6% (24) |
| California: | 5.2% (539,184) |
| Montecito: | 2.0% (18) |
| California: | 0.1% (9,241) |
| Montecito: | 1.9% (17) |
| California: | 0.2% (20,997) |
| Montecito: | 1.9% (17) |
| California: | 0.1% (10,213) |
| Montecito: | 1.7% (16) |
| California: | 0.0% (2,561) |
| Montecito: | 1.6% (15) |
| California: | 0.3% (33,029) |
| Montecito: | 1.6% (15) |
| California: | 0.7% (73,304) |
| Montecito: | 1.6% (15) |
| California: | 0.4% (42,718) |
Place of birth for U.S.-born residents:
- This state: 4,080
- Other state: 3,350
- Northeast: 1,026
- Midwest: 750
- South: 691
- West: 840
78.2% of Montecito residents lived in the same house 1 years ago.
Out of people who lived in different houses, 27.8% lived in this county.
Out of people who lived in different counties, 75.9% lived in California.
| Montecito: | 78.2% |
| State average: | 88.9% |
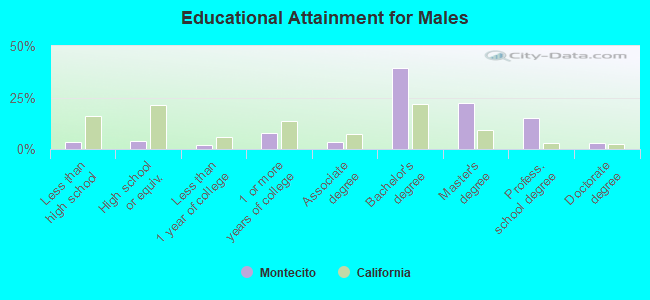
Education attainment for males 25 years and older:
- No schooling: 0
- Nursery to 4th grade: 9
- 5th and 6th grade: 3
- 7th and 8th grade: 0
- 9th grade: 0
- 10th grade: 0
- 11th grade: 49
- 12th grade, no diploma: 30
- High school graduate (or equivalency): 101
- Less than 1 year of college: 56
- Some college more than 1 year, no degree: 206
- Associate degree: 92
- Bachelor's degree: 1,056
- Master's degree: 601
- Professional school degree: 403
- Doctorate degree: 72
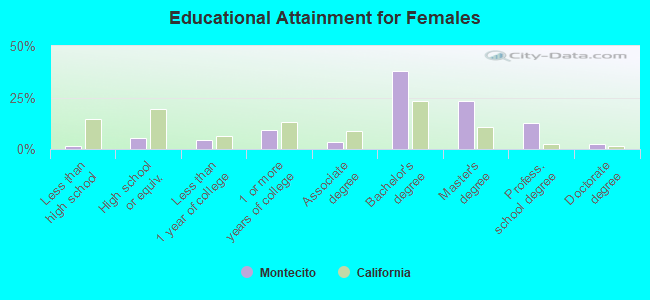
Education attainment for females 25 years and older:
- No schooling: 0
- Nursery to 4th grade: 0
- 5th and 6th grade: 4
- 7th and 8th grade: 0
- 9th grade: 5
- 10th grade: 0
- 11th grade: 9
- 12th grade, no diploma: 29
- High school graduate (or equivalency): 180
- Less than 1 year of college: 147
- Some college more than 1 year, no degree: 304
- Associate degree: 114
- Bachelor's degree: 1,251
- Master's degree: 770
- Professional school degree: 411
- Doctorate degree: 78
Housing units in structures:
- One, detached: 3,176
- One, attached: 401
- Two: 152
- 3 or 4: 50
- 5 to 9: 248
- 10 to 19: 77
- 20 to 49: 9
- 50 or more: 79
Housing units lacking complete kitchen facilities in 2022: 2.9%
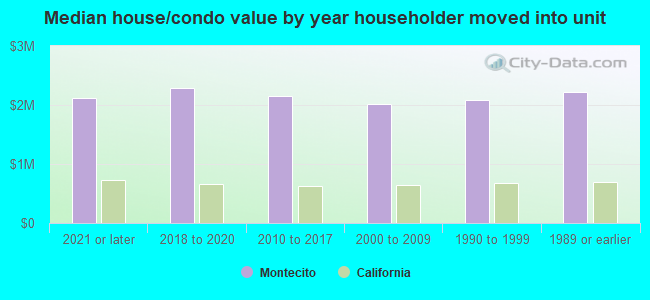
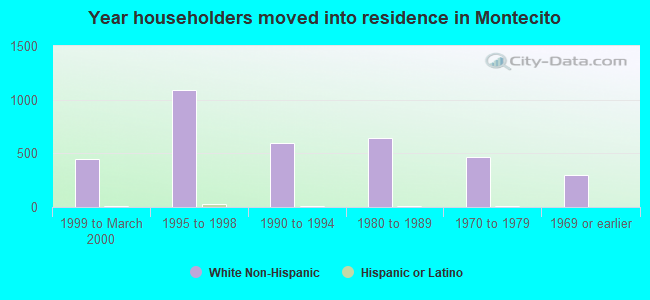
House/condo owner moved in on average 15 years ago
Renter moved in on average 1 years ago
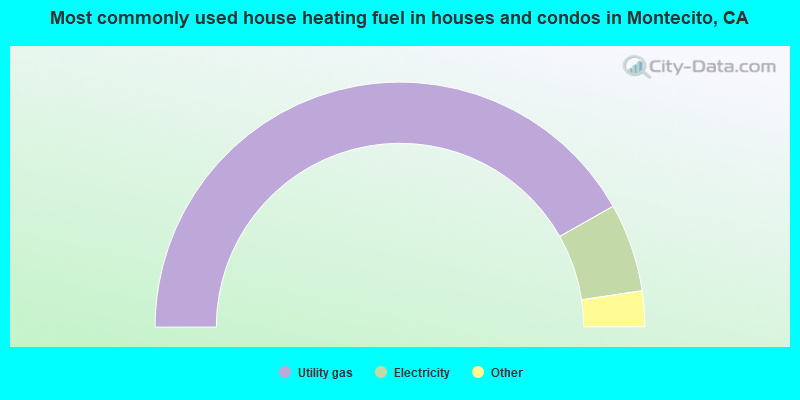
- 83.6%Utility gas
- 11.7%Electricity
- 2.5%Bottled, tank, or LP gas
- 1.5%Solar energy
- 0.6%Wood
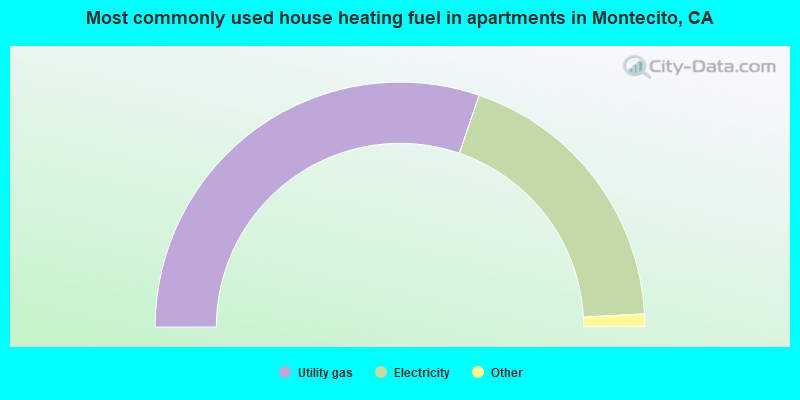
- 60.5%Utility gas
- 37.8%Electricity
- 1.1%Bottled, tank, or LP gas
- 0.5%No fuel used
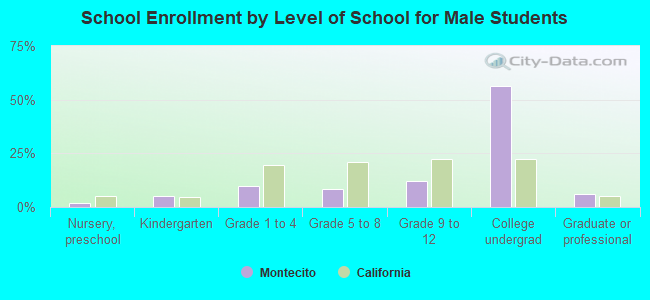
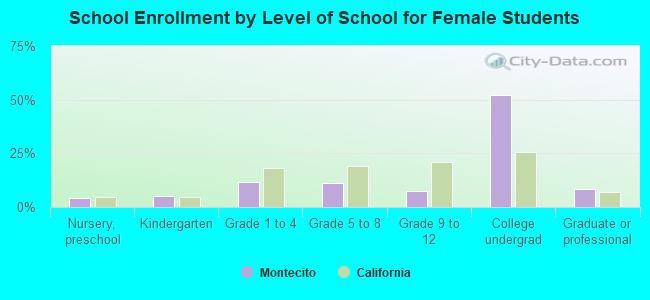
Private vs. public school enrollment:
| Here: | 13.2% |
| California: | 10.5% |
| Here: | 13.5% |
| California: | 8.5% |
| Here: | 50.8% |
| California: | 15.9% |