Montague-Forestburg, TX (Texas) Houses and Residents
| Montague-Forestburg: | $232,919 |
| Texas: | $275,400 |
Total population: 1,811 (Urban population: 0, Rural population: 1,767 (229 farm, 1,538 nonfarm))
Houses: 938 (719 occupied: 602 owner occupied, 117 renter occupied)
| % of renters here: | 16% |
| State: | 38% |
Housing density: 5 houses/condos per square mile
Median price asked for vacant for-sale houses and condos in 2022 in this county: $154,756.
Median contract rent in 2022: $656 (lower quartile is $439, upper quartile is $772)
Median rent asked for vacant for-rent units in 2022: $631
Median gross rent in Montague-Forestburg, TX in 2022: $894
Housing units in Montague-Forestburg with a mortgage: 67 (3 second mortgage, 4 home equity loan, 0 both second mortgage and home equity loan)
Houses without a mortgage: 126


Household type by relationship:
Households: 19,453- In family households: 16,653 (4,146 male householders, 1,402 female householders)
4,410 spouses, 5,110 children (4,616 natural, 118 adopted, 376 stepchildren), 571 grandchildren, 127 brothers or sisters, 134 parents, foster children, 200 other relatives, 415 non-relatives
- In nonfamily households: 2,800 (1,163 male householders (977 living alone)), 1,278 female householders (1,176 living alone)), 359 nonrelatives
- In group quarters: 266 (234 institutionalized population)
3,159 married couples with children.
938 single-parent households (265 men, 673 women).
95.6% of residents of Montague-Forestburg speak English at home.
4.1% of residents speak Spanish at home (64% speak English very well, 19% speak English well, 9% speak English not well, 9% don't speak English at all).
0.2% of residents speak other Indo-European language at home (100% speak English very well).
Foreign born population: 97 (4.0%)
(10.3% of them are naturalized citizens)
| Here: | 6.0 |
| State: | 6.3 |
| Here: | 4.8 |
| State: | 4.0 |

- Bedrooms in owner-occupied houses and condos in Montague-Forestburg, Texas
- 10no bedroom
- 321 bedroom
- 1472 bedrooms
- 3483 bedrooms
- 614 bedrooms
- 45+ bedrooms

- Bedrooms in renter-occupied apartments in Montague-Forestburg, Texas
- 5no bedroom
- 121 bedroom
- 532 bedrooms
- 423 bedrooms
- 54 bedrooms
- 05+ bedrooms

- Cars and other vehicles available in Montague-Forestburg in owner-occupied houses/condos
- 23no vehicle
- 1311 vehicle
- 2372 vehicles
- 1413 vehicles
- 534 vehicles
- 175+ vehicles

- Cars and other vehicles available in Montague-Forestburg in renter-occupied apartments
- 14no vehicle
- 521 vehicle
- 352 vehicles
- 163 vehicles
- 04 vehicles
- 05+ vehicles

- Rooms in owner-occupied houses in Montague-Forestburg, Texas
- 71 room
- 112 rooms
- 273 rooms
- 884 rooms
- 1935 rooms
- 1236 rooms
- 977 rooms
- 318 rooms
- 259+ rooms

- Rooms in renter-occupied apartments in Montague-Forestburg, Texas
- 31 room
- 22 rooms
- 163 rooms
- 274 rooms
- 465 rooms
- 146 rooms
- 97 rooms
- 08 rooms
- 09+ rooms


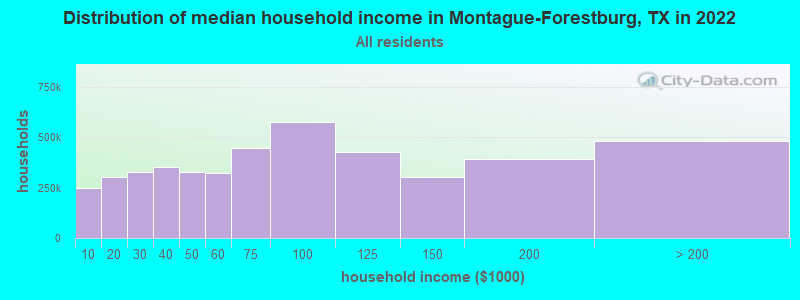
Montague-Forestburg, TX household income distribution

- 73,103Less than $10,000
- 99,383$10,000 to $19,999
- 108,118$20,000 to $29,999
- 113,877$30,000 to $39,999
- 107,438$40,000 to $49,999
- 103,111$50,000 to $59,999
- 142,737$60,000 to $74,999
- 195,440$75,000 to $99,999
- 148,154$100,000 to $124,999
- 109,226$125,000 to $149,999
- 127,018$150,000 to $199,999
- 142,773$200,000 or more
Percentage of workers working in this county: 54.3%
Number of people working at home: 124 (11.1% of all workers)
Travel time to work (commute)
- Less than 5 minutes: 27
- 5 to 9 minutes: 77
- 10 to 14 minutes: 93
- 15 to 19 minutes: 93
- 20 to 24 minutes: 50
- 25 to 29 minutes: 29
- 30 to 34 minutes: 64
- 35 to 39 minutes: 22
- 40 to 44 minutes: 9
- 45 to 59 minutes: 109
- 60 to 89 minutes: 98
- 90 or more minutes: 92
Means of transportation to work:
- Drove a car alone: 564 (68.9%)
- Carpooled: 156 (19.1%)
- Bus or trolley bus: 2 (0.2%)
- Walked: 32 (3.9%)
- Other means: 9 (1.1%)
- Worked at home: 55 (6.7%)


- Year of entry for the foreign-born population in Montague-Forestburg, Texas
- 121995 to March 2000
- 121990 to 1994
- 21985 to 1989
- 101980 to 1984
- 01975 to 1979
- 01970 to 1974
- 01965 to 1969
- 7Before 1965
Most common places of birth for foreign-born residents (%):
| Montague-Forestburg: | 90.7% (39) |
| Texas: | 64.8% (1,879,369) |
| Montague-Forestburg: | 4.7% (2) |
| Texas: | 0.2% (4,590) |
| Montague-Forestburg: | 4.7% (2) |
| Texas: | 1.3% (36,802) |
Place of birth for U.S.-born residents:
- This state: 1,371
- Other state: 351
- Northeast: 28
- Midwest: 101
- South: 149
- West: 73
61% of Montague-Forestburg residents lived in the same house 5 years ago.
Out of people who lived in different houses, 30% lived in this county.
Out of people who lived in different counties, 84% lived in Texas.
Education attainment for males 25 years and older:
- No schooling: 6
- Nursery to 4th grade: 0
- 5th and 6th grade: 14
- 7th and 8th grade: 17
- 9th grade: 37
- 10th grade: 25
- 11th grade: 33
- 12th grade, no diploma: 12
- High school graduate (or equivalency): 256
- Less than 1 year of college: 34
- Some college more than 1 year, no degree: 96
- Associate degree: 16
- Bachelor's degree: 67
- Master's degree: 18
- Professional school degree: 4
- Doctorate degree: 10

Education attainment for females 25 years and older:
- No schooling: 9
- Nursery to 4th grade: 2
- 5th and 6th grade: 5
- 7th and 8th grade: 17
- 9th grade: 10
- 10th grade: 16
- 11th grade: 46
- 12th grade, no diploma: 14
- High school graduate (or equivalency): 289
- Less than 1 year of college: 28
- Some college more than 1 year, no degree: 86
- Associate degree: 17
- Bachelor's degree: 68
- Master's degree: 14
- Professional school degree: 1
- Doctorate degree: 3


Housing units in structures:
- One, detached: 652
- Mobile homes: 268
- Boats, RVs, vans, etc.: 18
Median worth of mobile homes: $100,796
Housing units lacking complete kitchen facilities: 5.5%

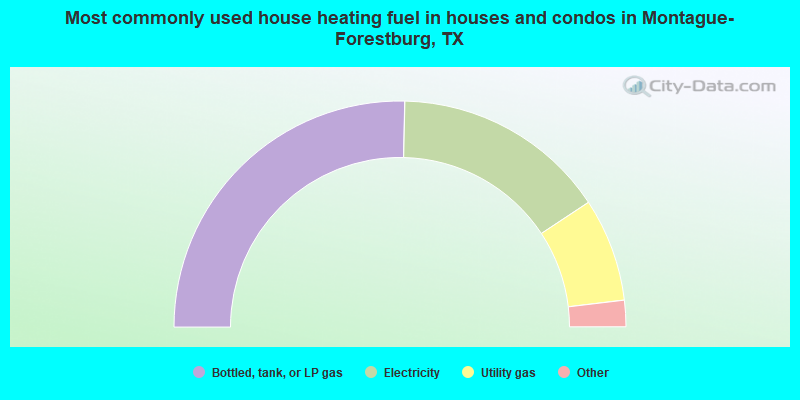
- 50.7%Bottled, tank, or LP gas
- 30.7%Electricity
- 14.8%Utility gas
- 3.2%Wood
- 0.3%Fuel oil, kerosene, etc.
- 0.3%Other fuel
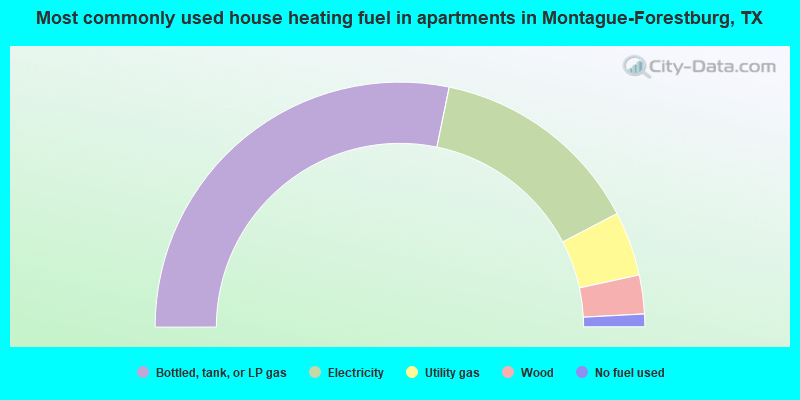
- 56.4%Bottled, tank, or LP gas
- 28.2%Electricity
- 8.5%Utility gas
- 5.1%Wood
- 1.7%No fuel used
Private vs. public school enrollment:
| Here: | 5.6% |
| Texas: | 6.8% |
| Here: | 14.9% |
| Texas: | 6.2% |
| Here: | 7.4% |
| Texas: | 15.4% |


