Minneapolis, MN (Minnesota) Houses and Residents
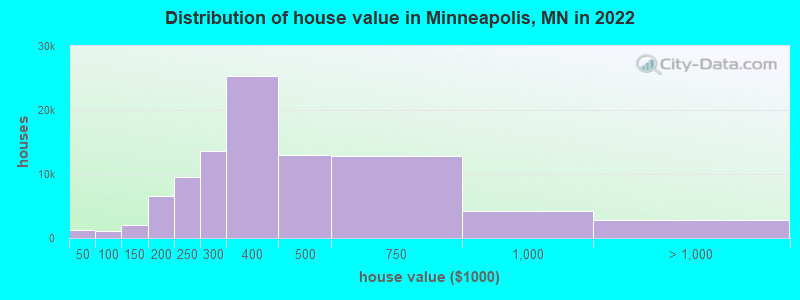
Estimated median house or condo value in 2022: $347,300 (it was $113,700 in 2000 )
Minneapolis:
$347,300Minnesota:
$314,600
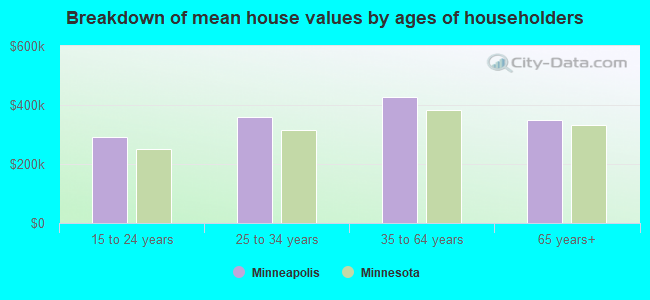
Lower value quartile - upper value quartile: $259,400 - $475,100Mean price in 2022: Detached houses: $445,552 Here:
$445,552State:
$374,552
Townhouses or other attached units: $435,272 Here:
$435,272State:
$312,049
In 2-unit structures: $420,759 Here:
$420,759State:
$323,045
In 3-to-4-unit structures: $431,923 Here:
$431,923State:
$238,971
In 5-or-more-unit structures: $417,671 Here:
$417,671State:
$258,516
Mobile homes: $204,481 Here:
$204,481State:
$94,605
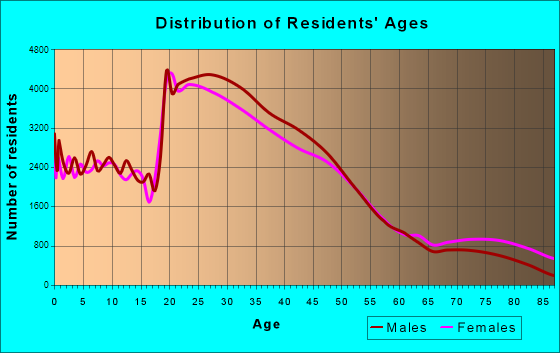
Total population: 407,207 (Urban population: 382,452, Rural population: 0)
Houses: 210,510 (193,694 occupied: 92,192 owner occupied, 101,502 renter occupied )
% of renters here:
52%State:
28%
Housing density: 3,835 houses/condos per square mile
Median price asked for vacant for-sale houses and condos in 2022: $194,660.
Median contract rent in 2022: $1,159 (lower quartile is $889, upper quartile is $1,639)
Median rent asked for vacant for-rent units in 2022: $2,152
Median gross rent in Minneapolis, MN in 2022: $1,265
Housing units in Minneapolis with a mortgage: 66,211 (7,041 second mortgage, 250 home equity loan, 5,565 both second mortgage and home equity loan )Houses without a mortgage: 2,095
Median household income for houses/condos with a mortgage: $123,904
Median household income for apartments without a mortgage: $80,926
Median monthly housing costs: $1,427
Data:
Median house or condo value ($)
Median house or condo value ($ change since 2000)
Median house or condo value ($) - White
Median house or condo value ($) - Black or African American
Median house or condo value ($) - Asian
Median house or condo value ($) - Hispanic or Latino
Median house or condo value ($) - American Indian and Alaska Native
Median house or condo value ($) - Multirace
Median house or condo value ($) - Other Race
Median price asked for mobile homes ($)
Household density (households per square mile)
Mean house or condo value by units in structure - 1, detached ($)
Mean house or condo value by units in structure - 1, attached ($)
Mean house or condo value by units in structure - 2 ($)
Mean house or condo value by units in structure by units in structure - 3 or 4 ($)
Mean house or condo value by units in structure - 5 or more ($)
Mean house or condo value by units in structure - Boat, RV, van, etc. ($)
Mean house or condo value by units in structure - Mobile home ($)
Median contract rent ($)
Median contract rent - Lower quartile ($)
Median contract rent - Upper quartile ($)
Median gross rent ($)
Urban houses (%)
Rural houses (%)
Houses occupied (%)
Houses occupied (% change since 2000)
Houses owner occupied (%)
Houses owner occupied (% change since 2000)
Houses renter occupied (%)
Houses renter occupied (% change since 2000)
Vacant housing units - For rent (%)
Vacant housing units - For rent (% change since 2000)
Vacant housing units - For sale only (%)
Vacant housing units - For sale only (% change since 2000)
Vacant housing units - Rented or sold, not occupied (%)
Vacant housing units - Rented or sold, not occupied (% change since 2000)
Vacant housing units - For seasonal, recreational, or occasional use (%)
Vacant housing units - For seasonal, recreational, or occasional use (% change since 2000)
Vacant housing units - For migrant workers (%)
Vacant housing units - For migrant workers (% change since 2000)
Vacant housing units - Other vacant (%)
Vacant housing units - Other vacant (% change since 2000)
Median monthly housing costs ($)
Median household income for houses/condos with a mortgage ($)
Median household income for houses/condos without a mortgage ($)
Median household income ($)
Median household income ($) - White
Median household income ($) - Black or African American
Median household income ($) - Asian
Median household income ($) - Hispanic or Latino
Median household income ($) - American Indian and Alaska Native
Median household income ($) - Multirace
Median household income ($) - Other Race
Mortgage status - with mortgage (%)
Mortgage status - with second mortgage (%)
Mortgage status - with home equity loan (%)
Mortgage status - with both second mortgage and home equity loan (%)
Mortgage status - without a mortgage (%)
Median year house/condo built
Median year apartment built
Household type by relationship - Male householder living alone (%)
Household type by relationship - Male householder not living alone (%)
Household type by relationship - Female householder living alone (%)
Household type by relationship - Female householder not living alone (%)
Household type by relationship - Opposite-Sex spouse (%)
Household type by relationship - Same-Sex spouse (%)
Household type by relationship - Opposite-Sex unmarried partner (%)
Household type by relationship - Same-Sex unmarried partner (%)
Household type by relationship - In group quarters (%)
Size of family households - 2-person household (%)
Size of family households - 3-person household (%)
Size of family households - 4-person household (%)
Size of family households - 5-person household (%)
Size of family households - 6-person household (%)
Size of family households - 7-or-more-person household (%)
Size of nonfamily households - 1-person household (%)
Size of nonfamily households - 2-person household (%)
Size of nonfamily households - 3-person household (%)
Size of nonfamily households - 4-person household (%)
Size of nonfamily households - 5-person household (%)
Size of nonfamily households - 6-person household (%)
Size of nonfamily households - 7-or-moreperson household (%)
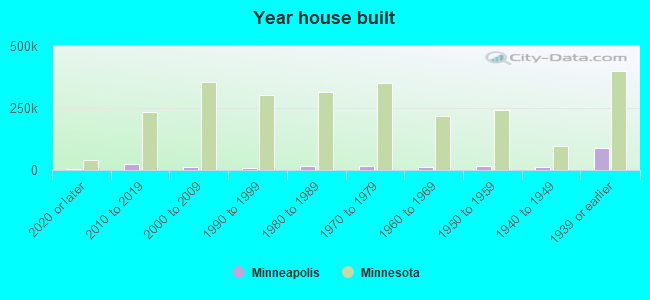
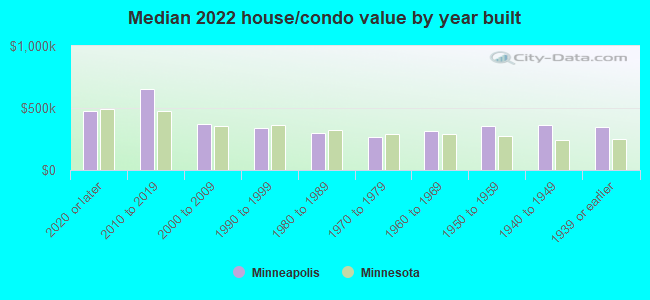
Year house built - Built 2010 or later (%)
Year house built - Built 2000 to 2009 (%)
Year house built - Built 1990 to 1999 (%)
Year house built - Built 1980 to 1989 (%)
Year house built - Built 1970 to 1979 (%)
Year house built - Built 1960 to 1969 (%)
Year house built - Built 1950 to 1959 (%)
Year house built - Built 1940 to 1949 (%)
Year house built - Built 1939 or earlier (%)
Median number of rooms in houses and condos
Median number of rooms in apartments
Median number of bedrooms in owner occupied houses
Mean number of bedrooms in owner occupied houses
Median number of bedrooms in renter occupied houses
Mean number of bedrooms in renter occupied houses
Median number of vehichles in owner occupied houses
Mean number of vehichles in owner occupied houses
Median number of vehichles in renter occupied houses
Mean number of vehichles in renter occupied houses
Rooms in owner-occupied houses - 1 room (%)
Rooms in owner-occupied houses - 2 rooms (%)
Rooms in owner-occupied houses - 3 rooms (%)
Rooms in owner-occupied houses - 4 rooms (%)
Rooms in owner-occupied houses - 5 rooms (%)
Rooms in owner-occupied houses - 6 rooms (%)
Rooms in owner-occupied houses - 7 rooms (%)
Rooms in owner-occupied houses - 8 rooms (%)
Rooms in owner-occupied houses - 9+ rooms (%)
Rooms in renter-occupied houses - 1 room (%)
Rooms in renter-occupied houses - 2 rooms (%)
Rooms in renter-occupied houses - 3 rooms (%)
Rooms in renter-occupied houses - 4 rooms (%)
Rooms in renter-occupied houses - 5 rooms (%)
Rooms in renter-occupied houses - 6 rooms (%)
Rooms in renter-occupied houses - 7 rooms (%)
Rooms in renter-occupied houses - 8 rooms (%)
Rooms in renter-occupied houses - 9+ rooms (%)
Bedrooms in owner-occupied houses - no bedrooms (%)
Bedrooms in owner-occupied houses - 1 bedroom (%)
Bedrooms in owner-occupied houses - 2 bedrooms (%)
Bedrooms in owner-occupied houses - 3 bedrooms (%)
Bedrooms in owner-occupied houses - 4 bedrooms (%)
Bedrooms in owner-occupied houses - 5+ bedrooms (%)
Bedrooms in renter-occupied houses - no bedrooms (%)
Bedrooms in renter-occupied houses - 1 bedroom (%)
Bedrooms in renter-occupied houses - 2 bedrooms (%)
Bedrooms in renter-occupied houses - 3 bedrooms (%)
Bedrooms in renter-occupied houses - 4 bedrooms (%)
Bedrooms in renter-occupied houses - 5+ bedrooms (%)
Vehicles available in owner-occupied houses - no vehicle available (%)
Vehicles available in owner-occupied houses - 1 vehicle available(%)
Vehicles available in owner-occupied houses - 2 Vehicles available (%)
Vehicles available in owner-occupied houses - 3 Vehicles available (%)
Vehicles available in owner-occupied houses - 4 Vehicles available (%)
Vehicles available in owner-occupied houses - 5+ Vehicles available (%)
Vehicles available in renter-occupied houses - no vehicle available (%)
Vehicles available in renter-occupied houses - 1 vehicle available (%)
Vehicles available in renter-occupied houses - 2 Vehicles available (%)
Vehicles available in renter-occupied houses - 3 Vehicles available (%)
Vehicles available in renter-occupied houses - 4 Vehicles available (%)
Vehicles available in renter-occupied houses - 5+ Vehicles available (%)
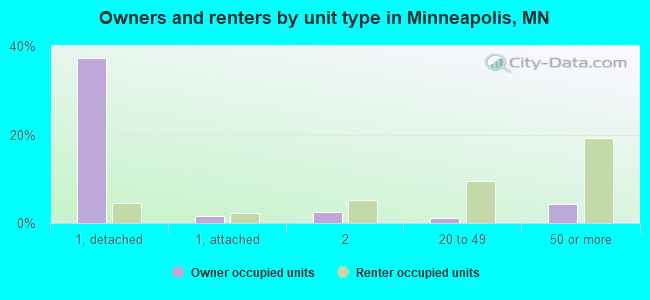
Housing units in structures - 1, detached (%)
Housing units in structures - 1, attached (%)
Housing units in structures - 2 (%)
Housing units in structures - 3 or 4 (%)
Housing units in structures - 5 to 9 (%)
Housing units in structures - 10 to 19 (%)
Housing units in structures - 20 to 49 (%)
Housing units in structures - 50 or more (%)
Housing units in structures - Mobile home (%)
Housing units in structures - Boat, RV, van, etc. (%)
Housing units in structures - Owners - 1, detached (%)
Housing units in structures - Owners - 1, attached (%)
Housing units in structures - Owners - 2 (%)
Housing units in structures - Owners - 3 or 4 (%)
Housing units in structures - Owners - 5 to 9 (%)
Housing units in structures - Owners - 10 to 19 (%)
Housing units in structures - Owners - 20 to 49 (%)
Housing units in structures - Owners - 50 or more (%)
Housing units in structures - Owners - Mobile home (%)
Housing units in structures - Owners - Boat, RV, van, etc. (%)
Housing units in structures - Renters - 1, detached (%)
Housing units in structures - Renters - 1, attached (%)
Housing units in structures - Renters - 2 (%)
Housing units in structures - Renters - 3 or 4 (%)
Housing units in structures - Renters - 5 to 9 (%)
Housing units in structures - Renters - 10 to 19 (%)
Housing units in structures - Renters - 20 to 49 (%)
Housing units in structures - Renters - 50 or more (%)
Housing units in structures - Renters - Mobile home (%)
Housing units in structures - Renters - Boat, RV, van, etc. (%)
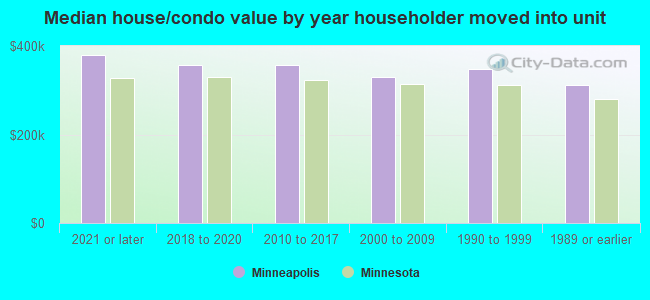
House/condo owner moved in on average (years ago)
Renter moved in on average (years ago)
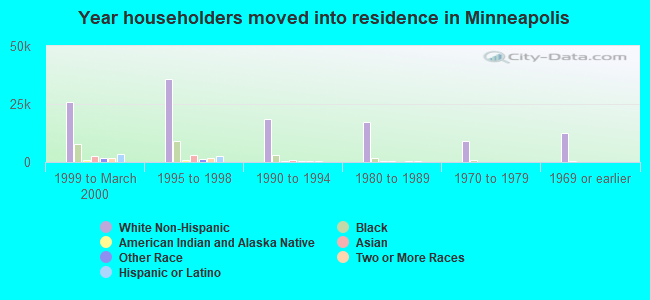
Year householder moved into unit - Moved in 1999 to March 2000 (%)
Year householder moved into unit - Moved in 1999 to March 2000 (%) - White
Year householder moved into unit - Moved in 1999 to March 2000 (%) - Black or African American
Year householder moved into unit - Moved in 1999 to March 2000 (%) - Asian
Year householder moved into unit - Moved in 1999 to March 2000 (%) - Hispanic or Latino
Year householder moved into unit - Moved in 1999 to March 2000 (%) - American Indian and Alaska Native
Year householder moved into unit - Moved in 1999 to March 2000 (%) - Multirace
Year householder moved into unit - Moved in 1999 to March 2000 (%) - Other Race
Year householder moved into unit - Moved in 1995 to 1998 (%)
Year householder moved into unit - Moved in 1995 to 1998 (%) - White
Year householder moved into unit - Moved in 1995 to 1998 (%) - Black or African American
Year householder moved into unit - Moved in 1995 to 1998 (%) - Asian
Year householder moved into unit - Moved in 1995 to 1998 (%) - Hispanic or Latino
Year householder moved into unit - Moved in 1995 to 1998 (%) - American Indian and Alaska Native
Year householder moved into unit - Moved in 1995 to 1998 (%) - Multirace
Year householder moved into unit - Moved in 1995 to 1998 (%) - Other Race
Year householder moved into unit - Moved in 1990 to 1994 (%)
Year householder moved into unit - Moved in 1990 to 1994 (%) - White
Year householder moved into unit - Moved in 1990 to 1994 (%) - Black or African American
Year householder moved into unit - Moved in 1990 to 1994 (%) - Asian
Year householder moved into unit - Moved in 1990 to 1994 (%) - Hispanic or Latino
Year householder moved into unit - Moved in 1990 to 1994 (%) - American Indian and Alaska Native
Year householder moved into unit - Moved in 1990 to 1994 (%) - Multirace
Year householder moved into unit - Moved in 1990 to 1994 (%) - Other Race
Year householder moved into unit - Moved in 1980 to 1989 (%)
Year householder moved into unit - Moved in 1980 to 1989 (%) - White
Year householder moved into unit - Moved in 1980 to 1989 (%) - Black or African American
Year householder moved into unit - Moved in 1980 to 1989 (%) - Asian
Year householder moved into unit - Moved in 1980 to 1989 (%) - Hispanic or Latino
Year householder moved into unit - Moved in 1980 to 1989 (%) - American Indian and Alaska Native
Year householder moved into unit - Moved in 1980 to 1989 (%) - Multirace
Year householder moved into unit - Moved in 1980 to 1989 (%) - Other Race
Year householder moved into unit - Moved in 1970 to 1979 (%)
Year householder moved into unit - Moved in 1970 to 1979 (%) - White
Year householder moved into unit - Moved in 1970 to 1979 (%) - Black or African American
Year householder moved into unit - Moved in 1970 to 1979 (%) - Asian
Year householder moved into unit - Moved in 1970 to 1979 (%) - Hispanic or Latino
Year householder moved into unit - Moved in 1970 to 1979 (%) - American Indian and Alaska Native
Year householder moved into unit - Moved in 1970 to 1979 (%) - Multirace
Year householder moved into unit - Moved in 1970 to 1979 (%) - Other Race
Year householder moved into unit - Moved in 1969 or earlier (%)
Year householder moved into unit - Moved in 1969 or earlier (%) - White
Year householder moved into unit - Moved in 1969 or earlier (%) - Black or African American
Year householder moved into unit - Moved in 1969 or earlier (%) - Asian
Year householder moved into unit - Moved in 1969 or earlier (%) - Hispanic or Latino
Year householder moved into unit - Moved in 1969 or earlier (%) - American Indian and Alaska Native
Year householder moved into unit - Moved in 1969 or earlier (%) - Multirace
Year householder moved into unit - Moved in 1969 or earlier (%) - Other Race
Housing units lacking complete plumbing facilities (%)
Housing units lacking complete kitchen facilities (%)
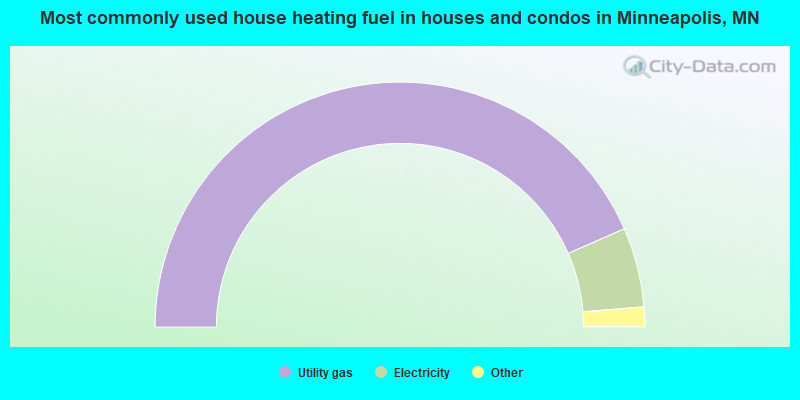
House heating fuel used in houses and condos - Utility gas (%)
House heating fuel used in houses and condos - Bottled, tank, or LP gas (%)
House heating fuel used in houses and condos - Electricity (%)
House heating fuel used in houses and condos - Fuel oil, kerosene, etc. (%)
House heating fuel used in houses and condos - Coal or coke (%)
House heating fuel used in houses and condos - Wood (%)
House heating fuel used in houses and condos - Solar energy (%)
House heating fuel used in houses and condos - Other fuel (%)
House heating fuel used in houses and condos - No fuel used (%)
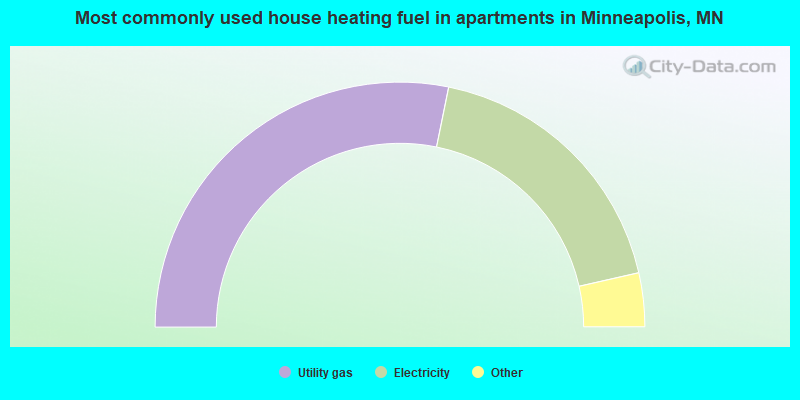
House heating fuel used in apartments - Utility gas (%)
House heating fuel used in apartments - Bottled, tank, or LP gas (%)
House heating fuel used in apartments - Electricity (%)
House heating fuel used in apartments - Fuel oil, kerosene, etc. (%)
House heating fuel used in apartments - Coal or coke (%)
House heating fuel used in apartments - Wood (%)
House heating fuel used in apartments - Solar energy (%)
House heating fuel used in apartments - Other fuel (%)
House heating fuel used in apartments - No fuel used (%)
Latest news about housing in Minneapolis, MN collected exclusively by city-data.com from local newspapers, TV, and radio stations
Median year house/condo built: 1938Median year apartment built: 1972Household type by relationship:
Households: 425,104
Male householders: 97,275 (44,164 living alone ), Female householders: 96,419 (40,186 living alone )57,895 spouses (55,679 opposite-sex spouses ), 17,695 unmarried partners , (15,726 opposite-sex unmarried partners ), 90,820 children (86,145 natural , 2,408 adopted , 2,267 stepchildren ), 4,576 grandchildren , 4,884 brothers or sisters , 2,326 parents , 316 foster children , 4,990 other relatives , 29,055 non-relatives In group quarters: 18,853
Size of family households: 37,610 2-persons , 19,011 3-persons , 14,678 4-persons , 6,014 5-persons , 1,963 6-persons , 2,540 7-or-more-persons .
Size of nonfamily households: 84,350 1-person , 20,880 2-persons , 4,035 3-persons , 1,469 4-persons , 442 5-persons , 223 6-persons , 479 7-or-more-persons .
49,962 married couples with children. single-parent households (5,093 men , 16,549 women ).
78.1% of residents of Minneapolis speak English at home. of residents speak Spanish at home (51% speak English very well , 26% speak English well , 18% speak English not well , 5% don't speak English at all ).of residents speak other Indo-European language at home (77% speak English very well , 17% speak English well , 3% speak English not well , 4% don't speak English at all ).of residents speak Asian or Pacific Island language at home (63% speak English very well , 19% speak English well , 12% speak English not well , 6% don't speak English at all ).of residents speak other language at home (63% speak English very well , 22% speak English well , 13% speak English not well , 3% don't speak English at all ).
Foreign born population: 62,668 (14.7%)of them are naturalized citizens )
Median number of rooms in houses and condos:
Median number of rooms in apartments
Owner-occupied Renter-occupied
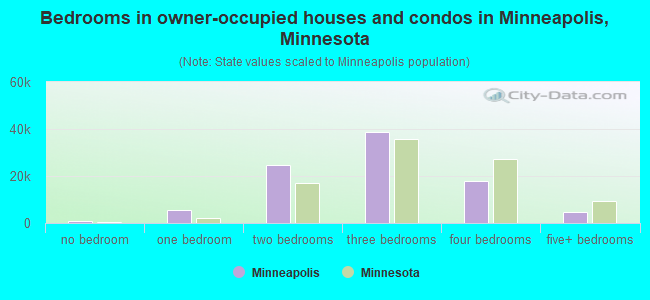
Bedrooms in owner-occupied houses and condos in Minneapolis, Minnesota
913 no bedroom 5,693 1 bedroom 24,633 2 bedrooms 38,571 3 bedrooms 17,701 4 bedrooms 4,681 5+ bedrooms
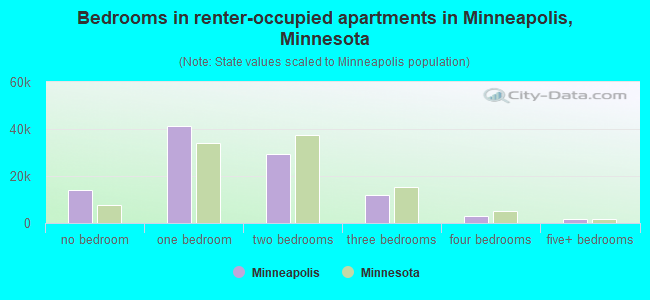
Bedrooms in renter-occupied apartments in Minneapolis, Minnesota
14,253 no bedroom 41,146 1 bedroom 29,500 2 bedrooms 11,725 3 bedrooms 3,164 4 bedrooms 1,714 5+ bedrooms
Owner-occupied Renter-occupied
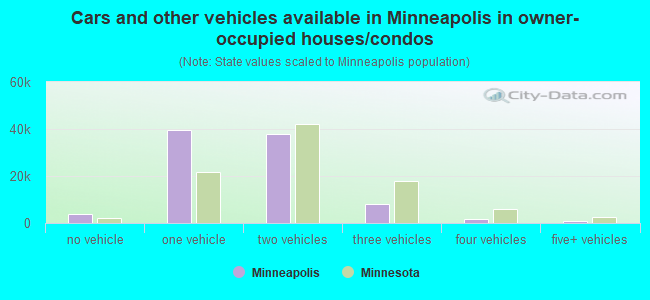
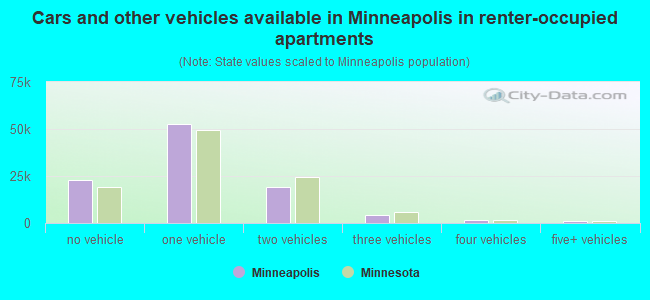
Cars and other vehicles available in Minneapolis in owner-occupied houses/condos
4,015 no vehicle 39,778 1 vehicle 37,892 2 vehicles 7,881 3 vehicles 1,684 4 vehicles 942 5+ vehicles
Cars and other vehicles available in Minneapolis in renter-occupied apartments
23,038 no vehicle 52,726 1 vehicle 18,911 2 vehicles 4,498 3 vehicles 1,426 4 vehicles 903 5+ vehicles
Owner-occupied Renter-occupied
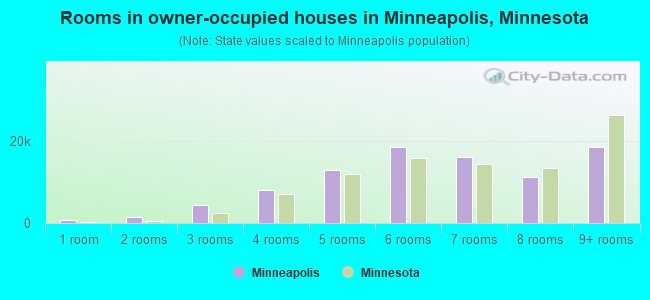
Rooms in owner-occupied houses in Minneapolis, Minnesota
792 1 room 1,490 2 rooms 4,457 3 rooms 8,138 4 rooms 12,922 5 rooms 18,519 6 rooms 16,137 7 rooms 11,200 8 rooms 18,537 9+ rooms
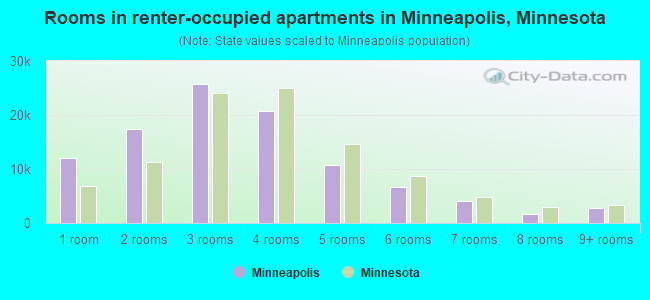
Rooms in renter-occupied apartments in Minneapolis, Minnesota
11,974 1 room 17,382 2 rooms 25,652 3 rooms 20,760 4 rooms 10,732 5 rooms 6,624 6 rooms 4,025 7 rooms 1,607 8 rooms 2,746 9+ rooms
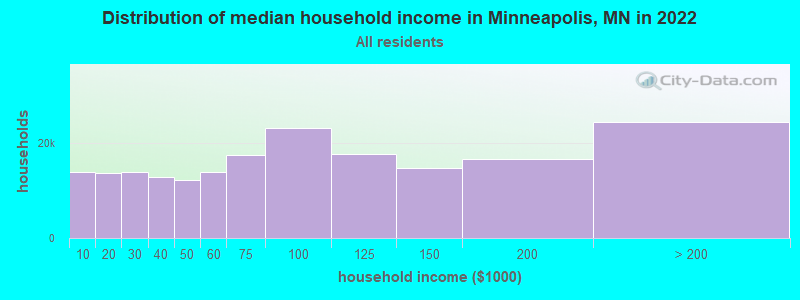
Minneapolis, MN household income distribution 13,818 Less than $10,00013,695 $10,000 to $19,99913,868 $20,000 to $29,99912,695 $30,000 to $39,99912,215 $40,000 to $49,99913,824 $50,000 to $59,99917,393 $60,000 to $74,99923,040 $75,000 to $99,99917,532 $100,000 to $124,99914,742 $125,000 to $149,99916,570 $150,000 to $199,99924,302 $200,000 or more
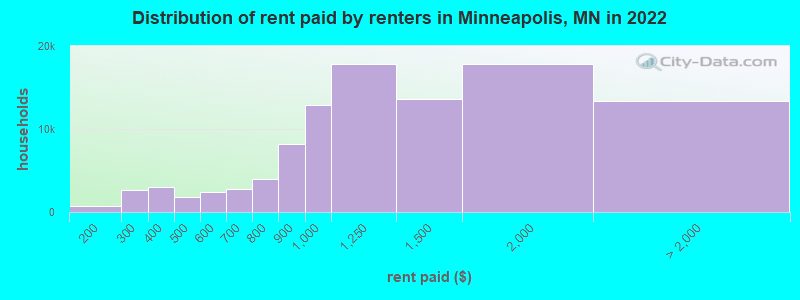
Home value of owner - occupied houses in 2022 in Minneapolis, MN 463 Less than $10,000122 $10,000 to $14,99964 $15,000 to $19,999173 $20,000 to $24,999222 $25,000 to $29,99938 $35,000 to $39,999190 $40,000 to $49,999117 $50,000 to $59,999314 $70,000 to $79,999380 $80,000 to $89,999162 $90,000 to $99,9991,473 $100,000 to $124,999631 $125,000 to $149,9993,863 $150,000 to $174,9992,677 $175,000 to $199,9999,589 $200,000 to $249,99913,646 $250,000 to $299,99925,321 $300,000 to $399,99912,909 $400,000 to $499,99912,885 $500,000 to $749,9994,167 $750,000 to $999,9991,763 $1,000,000 to $1,499,999673 $1,500,000 to $1,999,999350 $2,000,000 or moreRent paid by renters in 2022 in Minneapolis, MN 155 Less than $10080 $100 to $149700 $150 to $1991,318 $200 to $2491,281 $250 to $2992,017 $300 to $3491,040 $350 to $399634 $400 to $4491,149 $450 to $4991,104 $500 to $5491,361 $550 to $5991,853 $600 to $649972 $650 to $6991,193 $700 to $7492,826 $750 to $7998,192 $800 to $89912,941 $900 to $99917,843 $1,000 to $1,24913,638 $1,250 to $1,49917,878 $1,500 to $1,9997,503 $2,000 to $2,4992,398 $2,500 to $2,9991,205 $3,000 to $3,4991,071 $3,500 or more1,150 No cash rent
Percentage of workers working in this county: 81.1%Number of people working at home: 59,021 (24.4% of all workers )
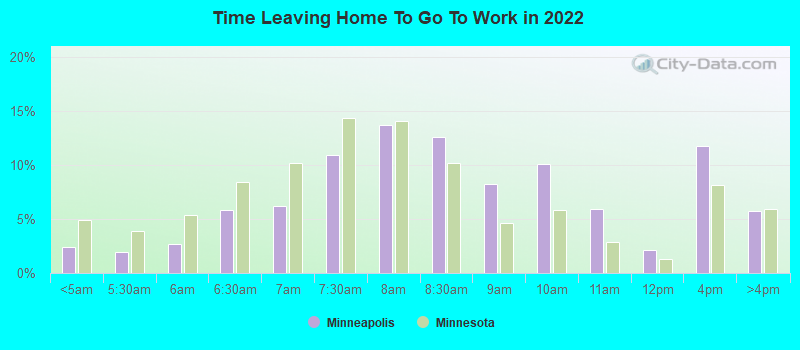
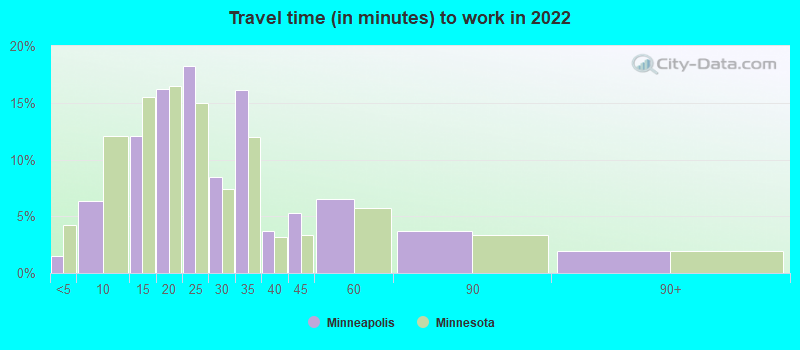
Travel time to work (commute)
Less than 5 minutes: 3,1105 to 9 minutes: 13,14810 to 14 minutes: 30,35315 to 19 minutes: 40,28820 to 24 minutes: 36,65625 to 29 minutes: 14,20330 to 34 minutes: 23,08635 to 39 minutes: 3,52240 to 44 minutes: 4,84945 to 59 minutes: 5,02560 to 89 minutes: 6,59690 or more minutes: 2,014
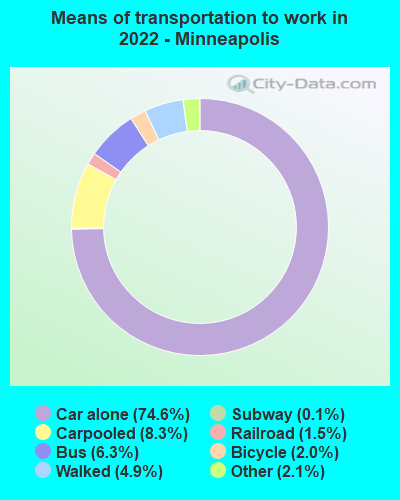
Means of transportation to work:
Drove a car alone: 182,986 (60.1%)Carpooled: 20,445 (6.7%)Bus : 15,535 (5.1%)Subway or elevated rail : 181 (0.1%)Long-distance train or commuter rail : 355 (0.1%)Light rail, streetcar or trolley : 3,645 (1.2%)Ferryboat: 75 (0.0%)Taxi: 5,275 (1.7%)Bicycle: 4,920 (1.6%)Walked: 11,979 (3.9%)Worked at home: 59,021 (19.4%)
Unemployment by race in 2022
Unemployment rate for White non-Hispanic residents 3.2% Males1.7% FemalesUnemployment rate for Black residents 9.0% Males14.2% FemalesUnemployment rate for American Indian and Alaska Native residents 10.5% Males19.6% FemalesUnemployment rate for Asian residents 4.1% Males5.1% FemalesUnemployment rate for other race residents 14.0% Males7.4% FemalesUnemployment rate for two or more race residents 8.0% Males2.7% FemalesUnemployment rate for Hispanic or Latino residents 11.1% Males3.2% Females
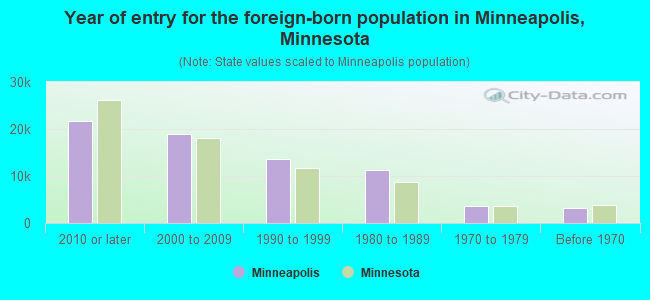
Year of entry for the foreign-born population in Minneapolis, Minnesota
21,628 2010 or later 18,974 2000 to 2009 13,571 1990 to 1999 11,247 1980 to 1989 3,635 1970 to 1979 3,117 Before 1970
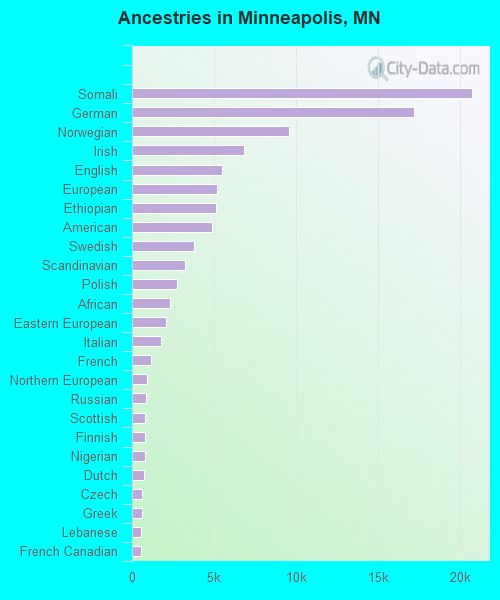
First ancestries reported:
Somali: 20,742 (11.7%)
German: 17,227 (9.7%)
Norwegian: 9,604 (5.4%)
Irish: 6,813 (3.8%)
English: 5,500 (3.1%)
European: 5,156 (2.9%)
Ethiopian: 5,123 (2.9%)
American: 4,895 (2.7%)
Swedish: 3,778 (2.1%)
Scandinavian: 3,231 (1.8%)
Polish: 2,724 (1.5%)
African: 2,323 (1.3%)
Eastern European: 2,059 (1.2%)
Italian: 1,794 (1.0%)
French: 1,163 (0.7%)
Northern European: 929 (0.5%)
Russian: 849 (0.5%)
Scottish: 820 (0.5%)
Finnish: 770 (0.4%)
Nigerian: 765 (0.4%)
Dutch: 736 (0.4%)
Czech: 639 (0.4%)
Greek: 594 (0.3%)
Lebanese: 569 (0.3%)
French Canadian: 561 (0.3%)
Ukrainian: 440 (0.2%)
Canadian: 364 (0.2%)
Latvian: 351 (0.2%)
Scotch-Irish: 339 (0.2%)
Iranian: 317 (0.2%)
Danish: 295 (0.2%)
Swiss: 274 (0.2%)
Jamaican: 261 (0.1%)
British: 258 (0.1%)
Liberian: 220 (0.1%)
Trinidadian and Tobagonian: 211 (0.1%)
Arab: 190 (0.1%)
Ugandan: 187 (0.1%)
German Russian: 181 (0.1%)
Yugoslavian: 181 (0.1%)
Haitian: 179 (0.1%)
Moroccan: 178 (0.10%)
Bahamian: 177 (0.10%)
Czechoslovakian: 173 (0.10%)
Sierra Leonean: 173 (0.10%)
Brazilian: 159 (0.09%)
Welsh: 143 (0.08%)
Austrian: 139 (0.08%)
Belgian: 139 (0.08%)
Kenyan: 134 (0.08%)
Slovak: 134 (0.08%)
Romanian: 130 (0.07%)
Guyanese: 126 (0.07%)
Turkish: 123 (0.07%)
Hungarian: 120 (0.07%)
Ghanaian: 120 (0.07%)
Egyptian: 104 (0.06%)
Australian: 102 (0.06%)
Luxembourger: 93 (0.05%)
Lithuanian: 88 (0.05%)
Albanian: 87 (0.05%)
Jordanian: 83 (0.05%)
Syrian: 82 (0.05%)
Icelander: 70 (0.04%)
Cajun: 69 (0.04%)
Croatian: 61 (0.03%)
Serbian: 59 (0.03%)
Slovene: 54 (0.03%)
Iraqi: 54 (0.03%)
West Indian: 49 (0.03%)
Armenian: 48 (0.03%)
Carpatho Rusyn: 47 (0.03%)
Cypriot: 47 (0.03%)
Israeli: 47 (0.03%)
Bulgarian: 46 (0.03%)
Belizean: 46 (0.03%)
Portuguese: 43 (0.02%)
Slavic: 40 (0.02%)
Palestinian: 38 (0.02%)
Cape Verdean: 29 (0.02%)
Sudanese: 26 (0.01%)
South African: 24 (0.01%)
Estonian: 19 (0.01%)
Pennsylvania German: 18 (0.01%)
Alsatian: 14 (0.01%)
Macedonian: 12 (0.01%)
Most common places of birth for foreign-born residents (%): Somalia Minneapolis:
23.6% (15,093)Minnesota:
8.0% (38,461)
Mexico Minneapolis:
12.3% (7,844)Minnesota:
12.1% (58,312)
Ethiopia Minneapolis:
7.3% (4,665)Minnesota:
5.1% (24,630)
Ecuador Minneapolis:
7.2% (4,604)Minnesota:
1.8% (8,438)
Kenya Minneapolis:
4.4% (2,830)Minnesota:
3.3% (15,701)
India Minneapolis:
3.6% (2,277)Minnesota:
6.7% (32,141)
Laos Minneapolis:
3.1% (1,989)Minnesota:
5.1% (24,591)
China, excluding Hong Kong and Taiwan Minneapolis:
2.9% (1,828)Minnesota:
3.6% (17,119)
Korea Minneapolis:
2.5% (1,602)Minnesota:
2.4% (11,675)
Canada Minneapolis:
1.8% (1,169)Minnesota:
2.5% (11,939)
Vietnam Minneapolis:
1.7% (1,098)Minnesota:
3.8% (18,442)
Thailand Minneapolis:
1.7% (1,073)Minnesota:
4.0% (19,333)
Place of birth for U.S.-born residents:
This state: 220,605Other state: 135,378Northeast: 15,689Midwest: 76,901South: 25,500West: 17,288 77.5% of Minneapolis residents lived in the same house 1 years ago.
Out of people who lived in different houses, 35.1% lived in this county.
Out of people who lived in different counties, 46.5% lived in Minnesota.
Minneapolis:
77.5%State average:
87.4%
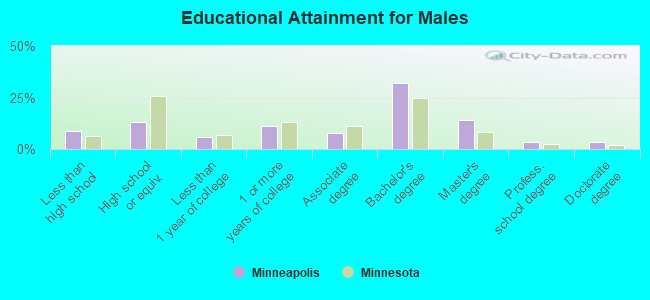
Education attainment for males 25 years and older:
No schooling: 4,481Nursery to 4th grade: 1,3695th and 6th grade: 6457th and 8th grade: 9499th grade: 77410th grade: 46511th grade: 1,16412th grade, no diploma: 2,921High school graduate (or equivalency): 19,580Less than 1 year of college: 9,011Some college more than 1 year, no degree: 16,784Associate degree: 11,891Bachelor's degree: 47,310Master's degree: 21,217Professional school degree: 5,173Doctorate degree: 4,875
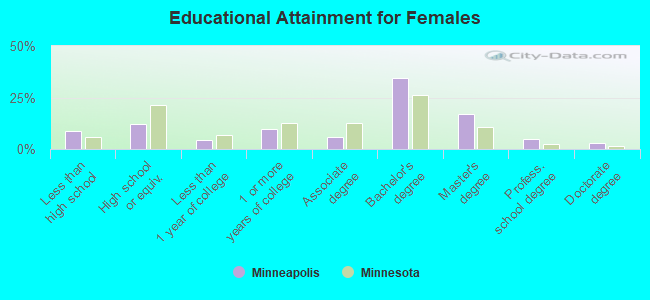
Education attainment for females 25 years and older:
No schooling: 4,435Nursery to 4th grade: 4685th and 6th grade: 1,2567th and 8th grade: 8829th grade: 10810th grade: 97511th grade: 1,56212th grade, no diploma: 2,463High school graduate (or equivalency): 17,138Less than 1 year of college: 5,768Some college more than 1 year, no degree: 13,219Associate degree: 8,247Bachelor's degree: 47,501Master's degree: 23,679Professional school degree: 6,745Doctorate degree: 4,093
Housing units in structures:
One, detached: 82,491One, attached: 7,205Two: 19,5983 or 4: 7,2745 to 9: 7,61310 to 19: 14,27220 to 49: 20,15450 or more: 51,379Mobile homes: 524Housing units lacking complete plumbing facilities in 2022: 0.6%Housing units lacking complete kitchen facilities in 2022: 1.4%House/condo owner moved in on average 10 years ago
Renter moved in on average 1 years ago
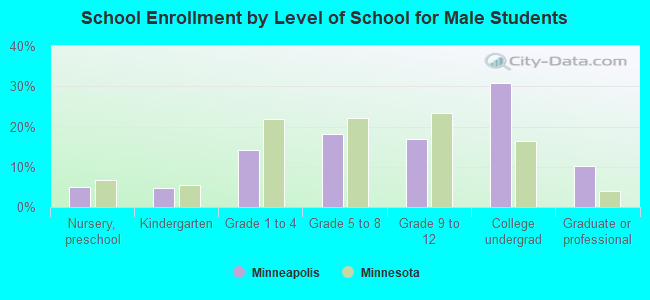
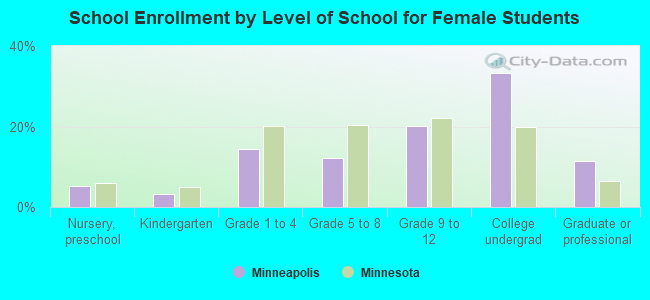
Private vs. public school enrollment:
Students in private schools in grades 1 to 8 (elementary and middle school): 4,732 Here:
14.5%Minnesota:
12.9%
Students in private schools in grades 9 to 12 (high school): 2,919 Students in private undergraduate colleges: 5,960 Here:
16.8%Minnesota:
26.2%