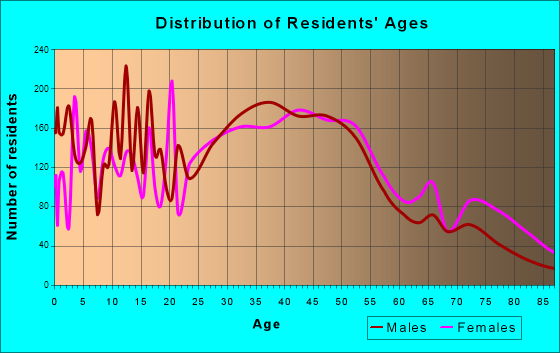
Milwaukie, OR (Oregon) Houses and Residents
Estimated median house or condo value in 2022: $511,333 (it was $153,800 in 2000 )
Milwaukie:
$511,333Oregon:
$475,600
Lower value quartile - upper value quartile: $415,441 - $577,772Mean price in 2022: Detached houses: $513,460 Here:
$513,460State:
$562,872
Townhouses or other attached units: $363,304 Here:
$363,304State:
$463,029
In 5-or-more-unit structures: $245,159 Here:
$245,159State:
$420,389
Mobile homes: $180,843 Here:
$180,843State:
$214,044
Total population: 20,640 (All urban)
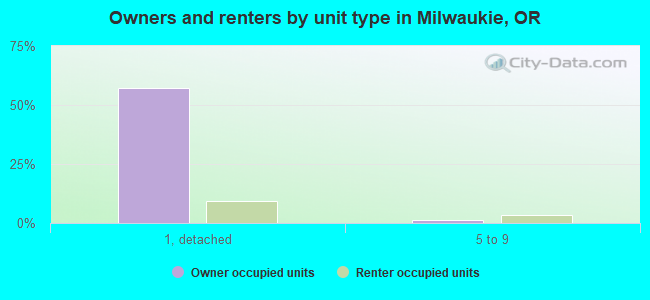
Houses: 9,898 (9,483 occupied: 5,535 owner occupied, 3,913 renter occupied )
% of renters here:
41%State:
37%
Housing density: 2,056 houses/condos per square mile
Median price asked for vacant for-sale houses and condos in 2022 in this county: $788,071.
Median contract rent in 2022: $1,298 (lower quartile is $1,041, upper quartile is $1,529)
Median rent asked for vacant for-rent units in 2022: $1,887
Median gross rent in Milwaukie, OR in 2022: $1,441
Housing units in Milwaukie with a mortgage: 4,223 (232 second mortgage, 1 home equity loan, 200 both second mortgage and home equity loan )Houses without a mortgage: 78
Median household income for houses/condos with a mortgage: $133,151
Median household income for apartments without a mortgage: $74,336
Median monthly housing costs: $1,621
Data:
Median house or condo value ($)
Median house or condo value ($ change since 2000)
Median house or condo value ($) - White
Median house or condo value ($) - Black or African American
Median house or condo value ($) - Asian
Median house or condo value ($) - Hispanic or Latino
Median house or condo value ($) - American Indian and Alaska Native
Median house or condo value ($) - Multirace
Median house or condo value ($) - Other Race
Median price asked for mobile homes ($)
Household density (households per square mile)
Mean house or condo value by units in structure - 1, detached ($)
Mean house or condo value by units in structure - 1, attached ($)
Mean house or condo value by units in structure - 2 ($)
Mean house or condo value by units in structure by units in structure - 3 or 4 ($)
Mean house or condo value by units in structure - 5 or more ($)
Mean house or condo value by units in structure - Boat, RV, van, etc. ($)
Mean house or condo value by units in structure - Mobile home ($)
Median contract rent ($)
Median contract rent - Lower quartile ($)
Median contract rent - Upper quartile ($)
Median gross rent ($)
Urban houses (%)
Rural houses (%)
Houses occupied (%)
Houses occupied (% change since 2000)
Houses owner occupied (%)
Houses owner occupied (% change since 2000)
Houses renter occupied (%)
Houses renter occupied (% change since 2000)
Vacant housing units - For rent (%)
Vacant housing units - For rent (% change since 2000)
Vacant housing units - For sale only (%)
Vacant housing units - For sale only (% change since 2000)
Vacant housing units - Rented or sold, not occupied (%)
Vacant housing units - Rented or sold, not occupied (% change since 2000)
Vacant housing units - For seasonal, recreational, or occasional use (%)
Vacant housing units - For seasonal, recreational, or occasional use (% change since 2000)
Vacant housing units - For migrant workers (%)
Vacant housing units - For migrant workers (% change since 2000)
Vacant housing units - Other vacant (%)
Vacant housing units - Other vacant (% change since 2000)
Median monthly housing costs ($)
Median household income for houses/condos with a mortgage ($)
Median household income for houses/condos without a mortgage ($)
Median household income ($)
Median household income ($) - White
Median household income ($) - Black or African American
Median household income ($) - Asian
Median household income ($) - Hispanic or Latino
Median household income ($) - American Indian and Alaska Native
Median household income ($) - Multirace
Median household income ($) - Other Race
Mortgage status - with mortgage (%)
Mortgage status - with second mortgage (%)
Mortgage status - with home equity loan (%)
Mortgage status - with both second mortgage and home equity loan (%)
Mortgage status - without a mortgage (%)
Median year house/condo built
Median year apartment built
Household type by relationship - Male householder living alone (%)
Household type by relationship - Male householder not living alone (%)
Household type by relationship - Female householder living alone (%)
Household type by relationship - Female householder not living alone (%)
Household type by relationship - Opposite-Sex spouse (%)
Household type by relationship - Same-Sex spouse (%)
Household type by relationship - Opposite-Sex unmarried partner (%)
Household type by relationship - Same-Sex unmarried partner (%)
Household type by relationship - In group quarters (%)
Size of family households - 2-person household (%)
Size of family households - 3-person household (%)
Size of family households - 4-person household (%)
Size of family households - 5-person household (%)
Size of family households - 6-person household (%)
Size of family households - 7-or-more-person household (%)
Size of nonfamily households - 1-person household (%)
Size of nonfamily households - 2-person household (%)
Size of nonfamily households - 3-person household (%)
Size of nonfamily households - 4-person household (%)
Size of nonfamily households - 5-person household (%)
Size of nonfamily households - 6-person household (%)
Size of nonfamily households - 7-or-moreperson household (%)
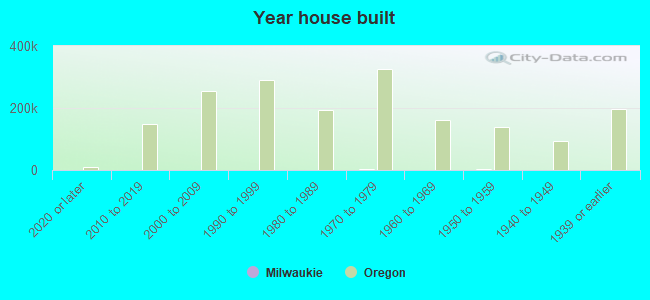
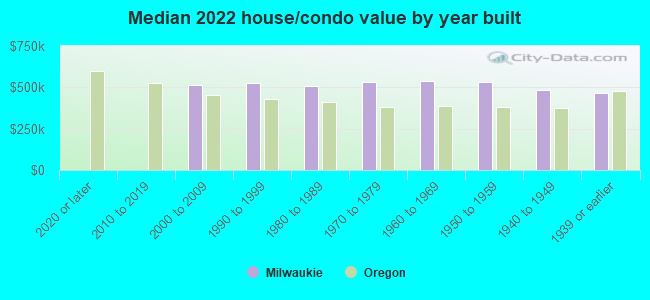
Year house built - Built 2010 or later (%)
Year house built - Built 2000 to 2009 (%)
Year house built - Built 1990 to 1999 (%)
Year house built - Built 1980 to 1989 (%)
Year house built - Built 1970 to 1979 (%)
Year house built - Built 1960 to 1969 (%)
Year house built - Built 1950 to 1959 (%)
Year house built - Built 1940 to 1949 (%)
Year house built - Built 1939 or earlier (%)
Median number of rooms in houses and condos
Median number of rooms in apartments
Median number of bedrooms in owner occupied houses
Mean number of bedrooms in owner occupied houses
Median number of bedrooms in renter occupied houses
Mean number of bedrooms in renter occupied houses
Median number of vehichles in owner occupied houses
Mean number of vehichles in owner occupied houses
Median number of vehichles in renter occupied houses
Mean number of vehichles in renter occupied houses
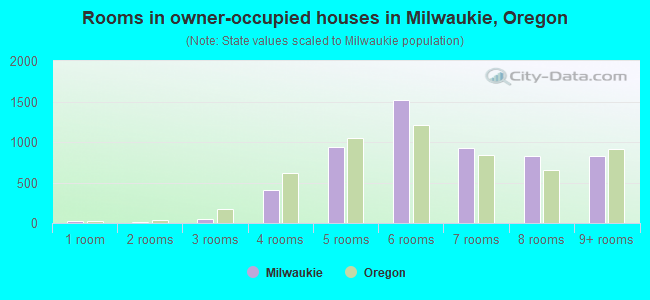
Rooms in owner-occupied houses - 1 room (%)
Rooms in owner-occupied houses - 2 rooms (%)
Rooms in owner-occupied houses - 3 rooms (%)
Rooms in owner-occupied houses - 4 rooms (%)
Rooms in owner-occupied houses - 5 rooms (%)
Rooms in owner-occupied houses - 6 rooms (%)
Rooms in owner-occupied houses - 7 rooms (%)
Rooms in owner-occupied houses - 8 rooms (%)
Rooms in owner-occupied houses - 9+ rooms (%)
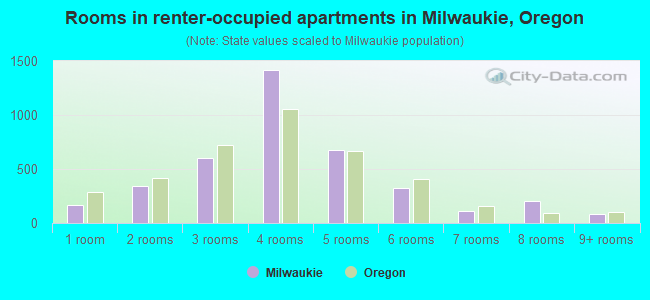
Rooms in renter-occupied houses - 1 room (%)
Rooms in renter-occupied houses - 2 rooms (%)
Rooms in renter-occupied houses - 3 rooms (%)
Rooms in renter-occupied houses - 4 rooms (%)
Rooms in renter-occupied houses - 5 rooms (%)
Rooms in renter-occupied houses - 6 rooms (%)
Rooms in renter-occupied houses - 7 rooms (%)
Rooms in renter-occupied houses - 8 rooms (%)
Rooms in renter-occupied houses - 9+ rooms (%)
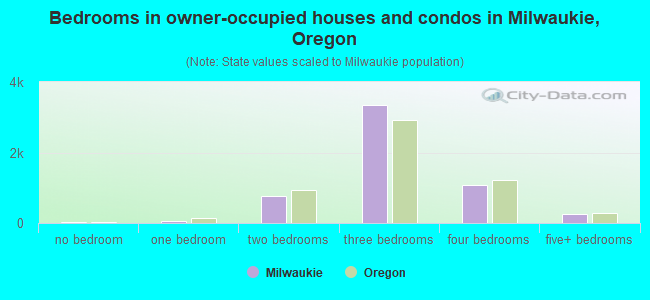
Bedrooms in owner-occupied houses - no bedrooms (%)
Bedrooms in owner-occupied houses - 1 bedroom (%)
Bedrooms in owner-occupied houses - 2 bedrooms (%)
Bedrooms in owner-occupied houses - 3 bedrooms (%)
Bedrooms in owner-occupied houses - 4 bedrooms (%)
Bedrooms in owner-occupied houses - 5+ bedrooms (%)
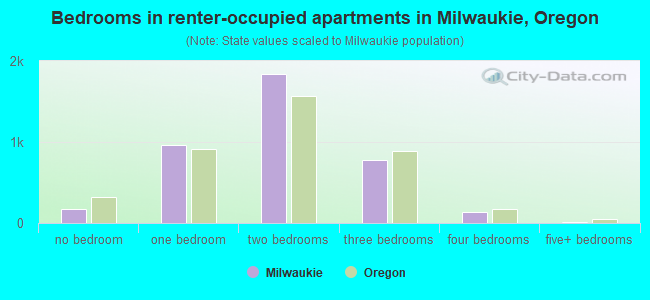
Bedrooms in renter-occupied houses - no bedrooms (%)
Bedrooms in renter-occupied houses - 1 bedroom (%)
Bedrooms in renter-occupied houses - 2 bedrooms (%)
Bedrooms in renter-occupied houses - 3 bedrooms (%)
Bedrooms in renter-occupied houses - 4 bedrooms (%)
Bedrooms in renter-occupied houses - 5+ bedrooms (%)
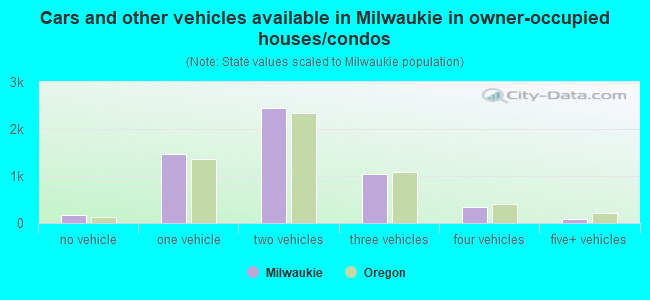
Vehicles available in owner-occupied houses - no vehicle available (%)
Vehicles available in owner-occupied houses - 1 vehicle available(%)
Vehicles available in owner-occupied houses - 2 Vehicles available (%)
Vehicles available in owner-occupied houses - 3 Vehicles available (%)
Vehicles available in owner-occupied houses - 4 Vehicles available (%)
Vehicles available in owner-occupied houses - 5+ Vehicles available (%)
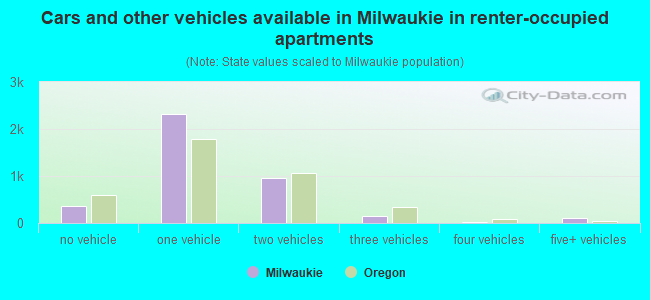
Vehicles available in renter-occupied houses - no vehicle available (%)
Vehicles available in renter-occupied houses - 1 vehicle available (%)
Vehicles available in renter-occupied houses - 2 Vehicles available (%)
Vehicles available in renter-occupied houses - 3 Vehicles available (%)
Vehicles available in renter-occupied houses - 4 Vehicles available (%)
Vehicles available in renter-occupied houses - 5+ Vehicles available (%)
Housing units in structures - 1, detached (%)
Housing units in structures - 1, attached (%)
Housing units in structures - 2 (%)
Housing units in structures - 3 or 4 (%)
Housing units in structures - 5 to 9 (%)
Housing units in structures - 10 to 19 (%)
Housing units in structures - 20 to 49 (%)
Housing units in structures - 50 or more (%)
Housing units in structures - Mobile home (%)
Housing units in structures - Boat, RV, van, etc. (%)
Housing units in structures - Owners - 1, detached (%)
Housing units in structures - Owners - 1, attached (%)
Housing units in structures - Owners - 2 (%)
Housing units in structures - Owners - 3 or 4 (%)
Housing units in structures - Owners - 5 to 9 (%)
Housing units in structures - Owners - 10 to 19 (%)
Housing units in structures - Owners - 20 to 49 (%)
Housing units in structures - Owners - 50 or more (%)
Housing units in structures - Owners - Mobile home (%)
Housing units in structures - Owners - Boat, RV, van, etc. (%)
Housing units in structures - Renters - 1, detached (%)
Housing units in structures - Renters - 1, attached (%)
Housing units in structures - Renters - 2 (%)
Housing units in structures - Renters - 3 or 4 (%)
Housing units in structures - Renters - 5 to 9 (%)
Housing units in structures - Renters - 10 to 19 (%)
Housing units in structures - Renters - 20 to 49 (%)
Housing units in structures - Renters - 50 or more (%)
Housing units in structures - Renters - Mobile home (%)
Housing units in structures - Renters - Boat, RV, van, etc. (%)
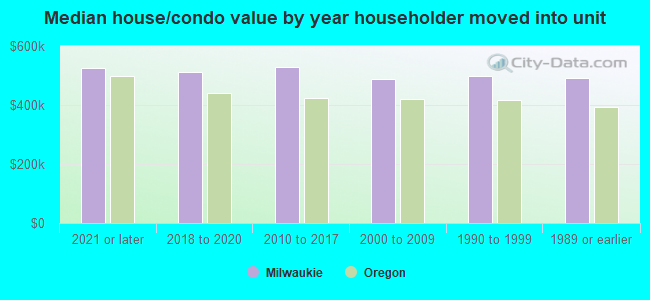
House/condo owner moved in on average (years ago)
Renter moved in on average (years ago)
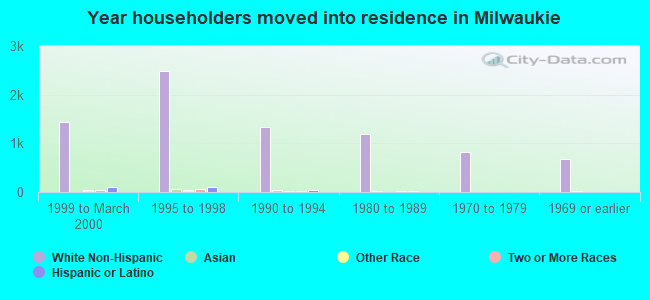
Year householder moved into unit - Moved in 1999 to March 2000 (%)
Year householder moved into unit - Moved in 1999 to March 2000 (%) - White
Year householder moved into unit - Moved in 1999 to March 2000 (%) - Black or African American
Year householder moved into unit - Moved in 1999 to March 2000 (%) - Asian
Year householder moved into unit - Moved in 1999 to March 2000 (%) - Hispanic or Latino
Year householder moved into unit - Moved in 1999 to March 2000 (%) - American Indian and Alaska Native
Year householder moved into unit - Moved in 1999 to March 2000 (%) - Multirace
Year householder moved into unit - Moved in 1999 to March 2000 (%) - Other Race
Year householder moved into unit - Moved in 1995 to 1998 (%)
Year householder moved into unit - Moved in 1995 to 1998 (%) - White
Year householder moved into unit - Moved in 1995 to 1998 (%) - Black or African American
Year householder moved into unit - Moved in 1995 to 1998 (%) - Asian
Year householder moved into unit - Moved in 1995 to 1998 (%) - Hispanic or Latino
Year householder moved into unit - Moved in 1995 to 1998 (%) - American Indian and Alaska Native
Year householder moved into unit - Moved in 1995 to 1998 (%) - Multirace
Year householder moved into unit - Moved in 1995 to 1998 (%) - Other Race
Year householder moved into unit - Moved in 1990 to 1994 (%)
Year householder moved into unit - Moved in 1990 to 1994 (%) - White
Year householder moved into unit - Moved in 1990 to 1994 (%) - Black or African American
Year householder moved into unit - Moved in 1990 to 1994 (%) - Asian
Year householder moved into unit - Moved in 1990 to 1994 (%) - Hispanic or Latino
Year householder moved into unit - Moved in 1990 to 1994 (%) - American Indian and Alaska Native
Year householder moved into unit - Moved in 1990 to 1994 (%) - Multirace
Year householder moved into unit - Moved in 1990 to 1994 (%) - Other Race
Year householder moved into unit - Moved in 1980 to 1989 (%)
Year householder moved into unit - Moved in 1980 to 1989 (%) - White
Year householder moved into unit - Moved in 1980 to 1989 (%) - Black or African American
Year householder moved into unit - Moved in 1980 to 1989 (%) - Asian
Year householder moved into unit - Moved in 1980 to 1989 (%) - Hispanic or Latino
Year householder moved into unit - Moved in 1980 to 1989 (%) - American Indian and Alaska Native
Year householder moved into unit - Moved in 1980 to 1989 (%) - Multirace
Year householder moved into unit - Moved in 1980 to 1989 (%) - Other Race
Year householder moved into unit - Moved in 1970 to 1979 (%)
Year householder moved into unit - Moved in 1970 to 1979 (%) - White
Year householder moved into unit - Moved in 1970 to 1979 (%) - Black or African American
Year householder moved into unit - Moved in 1970 to 1979 (%) - Asian
Year householder moved into unit - Moved in 1970 to 1979 (%) - Hispanic or Latino
Year householder moved into unit - Moved in 1970 to 1979 (%) - American Indian and Alaska Native
Year householder moved into unit - Moved in 1970 to 1979 (%) - Multirace
Year householder moved into unit - Moved in 1970 to 1979 (%) - Other Race
Year householder moved into unit - Moved in 1969 or earlier (%)
Year householder moved into unit - Moved in 1969 or earlier (%) - White
Year householder moved into unit - Moved in 1969 or earlier (%) - Black or African American
Year householder moved into unit - Moved in 1969 or earlier (%) - Asian
Year householder moved into unit - Moved in 1969 or earlier (%) - Hispanic or Latino
Year householder moved into unit - Moved in 1969 or earlier (%) - American Indian and Alaska Native
Year householder moved into unit - Moved in 1969 or earlier (%) - Multirace
Year householder moved into unit - Moved in 1969 or earlier (%) - Other Race
Housing units lacking complete plumbing facilities (%)
Housing units lacking complete kitchen facilities (%)
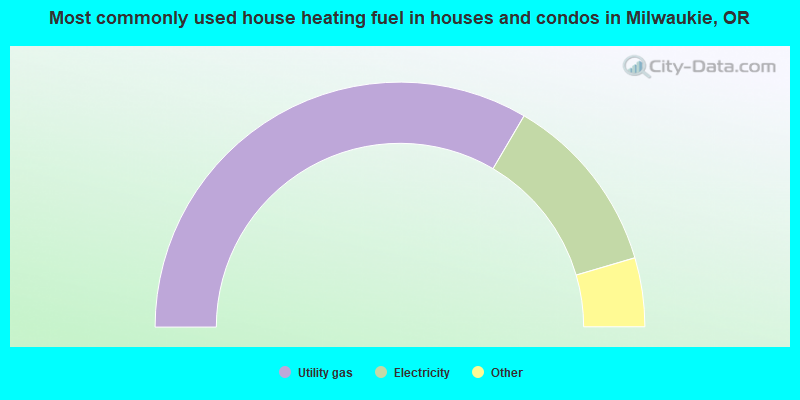
House heating fuel used in houses and condos - Utility gas (%)
House heating fuel used in houses and condos - Bottled, tank, or LP gas (%)
House heating fuel used in houses and condos - Electricity (%)
House heating fuel used in houses and condos - Fuel oil, kerosene, etc. (%)
House heating fuel used in houses and condos - Coal or coke (%)
House heating fuel used in houses and condos - Wood (%)
House heating fuel used in houses and condos - Solar energy (%)
House heating fuel used in houses and condos - Other fuel (%)
House heating fuel used in houses and condos - No fuel used (%)
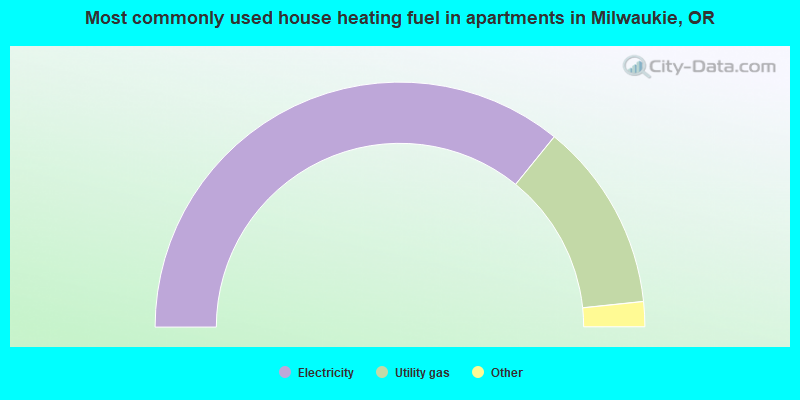
House heating fuel used in apartments - Utility gas (%)
House heating fuel used in apartments - Bottled, tank, or LP gas (%)
House heating fuel used in apartments - Electricity (%)
House heating fuel used in apartments - Fuel oil, kerosene, etc. (%)
House heating fuel used in apartments - Coal or coke (%)
House heating fuel used in apartments - Wood (%)
House heating fuel used in apartments - Solar energy (%)
House heating fuel used in apartments - Other fuel (%)
House heating fuel used in apartments - No fuel used (%)
Latest news about housing in Milwaukie, OR collected exclusively by city-data.com from local newspapers, TV, and radio stations
Median year house/condo built: 1960Median year apartment built: 1976Household type by relationship:
Households: 21,308
Male householders: 4,332 (1,478 living alone ), Female householders: 5,003 (1,515 living alone )3,823 spouses (3,762 opposite-sex spouses ), 710 unmarried partners , (683 opposite-sex unmarried partners ), 4,982 children (4,743 natural , 122 adopted , 116 stepchildren ), 326 grandchildren , 175 brothers or sisters , 159 parents , 44 foster children , 318 other relatives , 1,084 non-relatives In group quarters: 345
Size of family households: 2,859 2-persons , 999 3-persons , 1,012 4-persons , 302 5-persons , 123 6-persons , 42 7-or-more-persons .
Size of nonfamily households: 2,983 1-person , 889 2-persons , 153 3-persons , 27 4-persons .
2,313 married couples with children. single-parent households (288 men , 708 women ).
92.6% of residents of Milwaukie speak English at home. of residents speak Spanish at home (86% speak English very well , 10% speak English well , 5% speak English not well ).of residents speak other Indo-European language at home (86% speak English very well , 2% speak English well , 12% speak English not well ).of residents speak Asian or Pacific Island language at home (47% speak English very well , 24% speak English well , 12% speak English not well , 17% don't speak English at all ).
Foreign born population: 911 (4.3%)of them are naturalized citizens )
Median number of rooms in houses and condos:
Median number of rooms in apartments
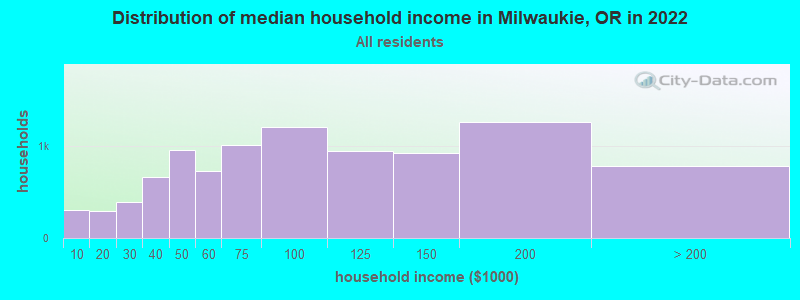
Milwaukie, OR household income distribution 307 Less than $10,000292 $10,000 to $19,999387 $20,000 to $29,999659 $30,000 to $39,999950 $40,000 to $49,999722 $50,000 to $59,9991,006 $60,000 to $74,9991,201 $75,000 to $99,999937 $100,000 to $124,999923 $125,000 to $149,9991,256 $150,000 to $199,999776 $200,000 or more
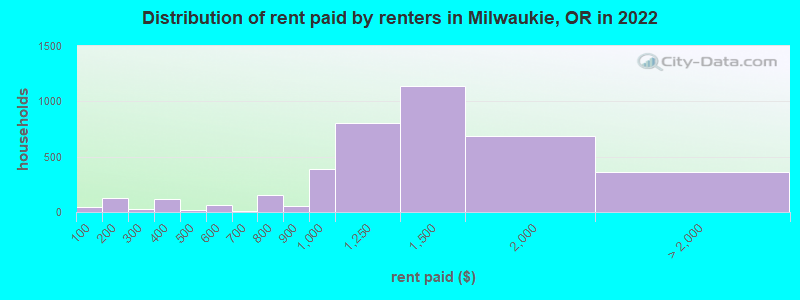
Home value of owner - occupied houses in 2022 in Milwaukie, OR 12 Less than $10,00031 $35,000 to $39,99910 $80,000 to $89,9997 $125,000 to $149,99910 $150,000 to $174,999105 $200,000 to $249,999155 $250,000 to $299,999600 $300,000 to $399,9991,986 $400,000 to $499,9991,242 $500,000 to $749,999234 $750,000 to $999,99969 $1,000,000 to $1,499,999103 $2,000,000 or moreRent paid by renters in 2022 in Milwaukie, OR 40 Less than $100126 $150 to $19923 $200 to $2492 $300 to $349116 $350 to $39916 $450 to $49946 $500 to $54917 $550 to $5997 $600 to $64996 $700 to $74959 $750 to $79953 $800 to $899389 $900 to $999802 $1,000 to $1,2491,142 $1,250 to $1,499682 $1,500 to $1,999267 $2,000 to $2,49914 $3,500 or more75 No cash rent
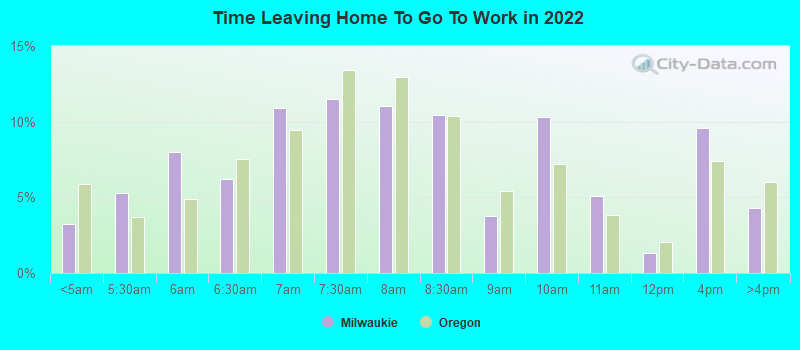
Percentage of workers working in this county: 56.5%Number of people working at home: 2,868 (23.4% of all workers )
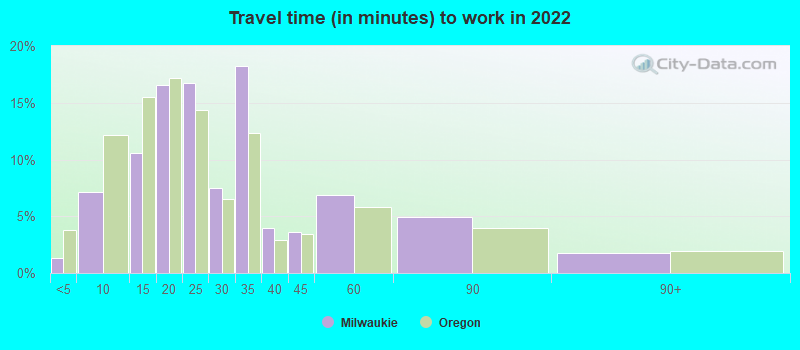
Travel time to work (commute)
Less than 5 minutes: 2405 to 9 minutes: 63110 to 14 minutes: 1,20815 to 19 minutes: 1,36420 to 24 minutes: 1,55025 to 29 minutes: 80330 to 34 minutes: 1,86235 to 39 minutes: 37340 to 44 minutes: 34245 to 59 minutes: 61960 to 89 minutes: 37390 or more minutes: 85
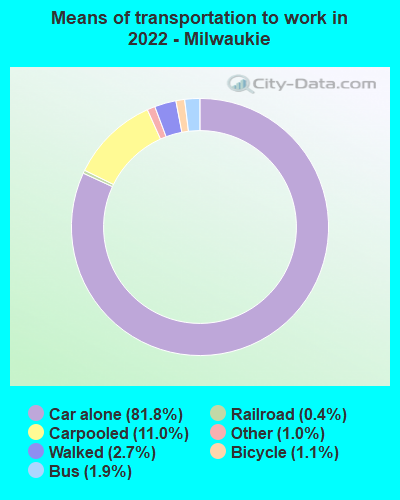
Means of transportation to work:
Drove a car alone: 9,787 (64.5%)Carpooled: 1,271 (8.4%)Bus : 258 (1.7%)Long-distance train or commuter rail : 8 (0.1%)Light rail, streetcar or trolley : 101 (0.7%)Taxi: 112 (0.7%)Bicycle: 181 (1.2%)Walked: 403 (2.7%)Worked at home: 2,868 (18.9%)
Unemployment by race in 2022
Unemployment rate for White non-Hispanic residents 3.3% Males3.2% FemalesUnemployment rate for Black residents 28.9% FemalesUnemployment rate for American Indian and Alaska Native residents 100.0% Males22.0% FemalesUnemployment rate for other race residents 5.7% FemalesUnemployment rate for two or more race residents 9.2% MalesUnemployment rate for Hispanic or Latino residents 6.3% Males4.2% Females
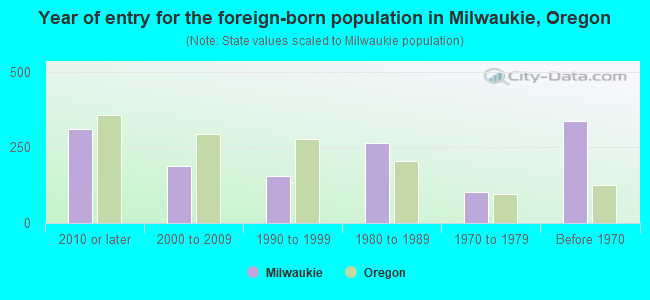
Year of entry for the foreign-born population in Milwaukie, Oregon
310 2010 or later 188 2000 to 2009 156 1990 to 1999 265 1980 to 1989 102 1970 to 1979 337 Before 1970
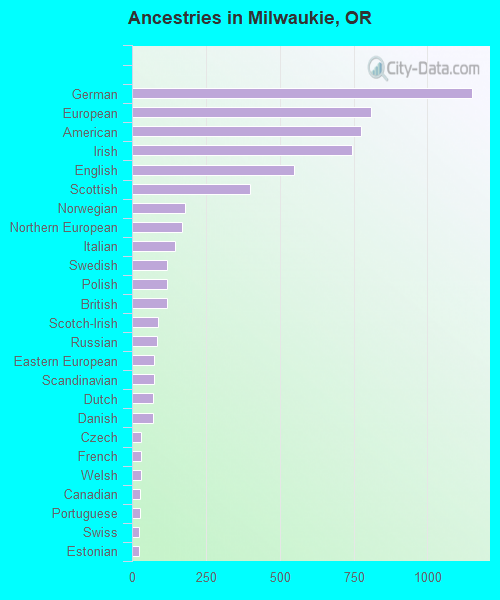
First ancestries reported:
German: 1,151 (13.0%)
European: 810 (9.2%)
American: 774 (8.8%)
Irish: 746 (8.4%)
English: 549 (6.2%)
Scottish: 401 (4.5%)
Norwegian: 178 (2.0%)
Northern European: 168 (1.9%)
Italian: 145 (1.6%)
Swedish: 120 (1.4%)
Polish: 119 (1.3%)
British: 117 (1.3%)
Scotch-Irish: 89 (1.0%)
Russian: 85 (1.0%)
Eastern European: 75 (0.8%)
Scandinavian: 75 (0.8%)
Dutch: 71 (0.8%)
Danish: 70 (0.8%)
Czech: 32 (0.4%)
French: 29 (0.3%)
Welsh: 29 (0.3%)
Canadian: 28 (0.3%)
Portuguese: 26 (0.3%)
Swiss: 25 (0.3%)
Estonian: 24 (0.3%)
Finnish: 16 (0.2%)
Latvian: 16 (0.2%)
Czechoslovakian: 10 (0.1%)
French Canadian: 10 (0.1%)
Ukrainian: 8 (0.09%)
Iraqi: 7 (0.08%)
West Indian: 5 (0.06%)
Slovak: 3 (0.03%) Most common places of birth for foreign-born residents (%): Mexico Milwaukie:
12.2% (121)Oregon:
33.9% (140,109)
England Milwaukie:
10.7% (106)Oregon:
1.5% (6,313)
India Milwaukie:
8.0% (79)Oregon:
4.7% (19,604)
Venezuela Milwaukie:
8.0% (79)Oregon:
0.4% (1,568)
Fiji Milwaukie:
7.2% (71)Oregon:
0.4% (1,762)
Thailand Milwaukie:
5.9% (58)Oregon:
0.8% (3,190)
Canada Milwaukie:
4.8% (48)Oregon:
3.7% (15,229)
United Kingdom, excluding England and Scotland Milwaukie:
3.7% (37)Oregon:
1.2% (5,082)
Other Eastern Europe Milwaukie:
3.5% (35)Oregon:
0.3% (1,202)
Russia Milwaukie:
3.1% (31)Oregon:
1.3% (5,229)
Germany Milwaukie:
3.0% (30)Oregon:
1.9% (8,005)
Philippines Milwaukie:
2.8% (28)Oregon:
3.5% (14,530)
Korea Milwaukie:
2.5% (25)Oregon:
2.8% (11,450)
Micronesia Milwaukie:
2.4% (24)Oregon:
0.5% (1,921)
China, excluding Hong Kong and Taiwan Milwaukie:
2.3% (23)Oregon:
5.2% (21,429)
Cuba Milwaukie:
2.0% (20)Oregon:
0.5% (2,247)
Romania Milwaukie:
1.8% (18)Oregon:
1.0% (4,043)
Japan Milwaukie:
1.7% (17)Oregon:
1.5% (6,259)
Place of birth for U.S.-born residents:
This state: 11,195Other state: 8,937Northeast: 979Midwest: 1,681South: 1,047West: 5,199 86.6% of Milwaukie residents lived in the same house 1 years ago.
Out of people who lived in different houses, 20.5% lived in this county.
Out of people who lived in different counties, 74.9% lived in Oregon.
Milwaukie:
86.6%State average:
85.5%
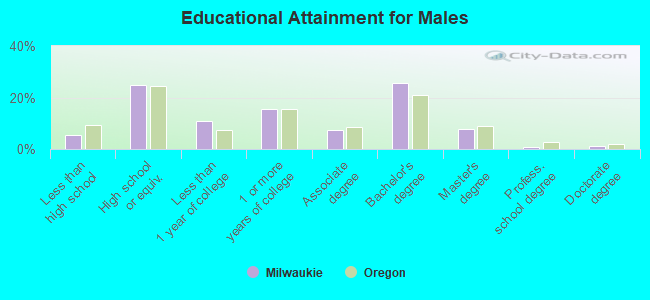
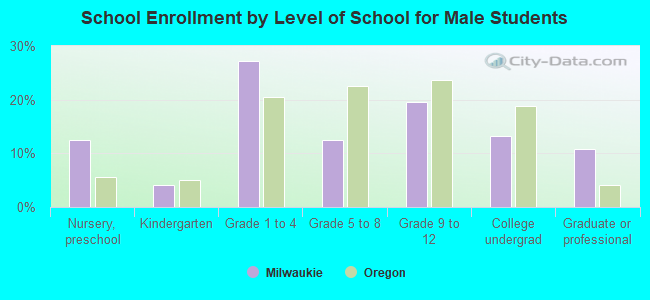
Education attainment for males 25 years and older:
No schooling: 114Nursery to 4th grade: 65th and 6th grade: 07th and 8th grade: 289th grade: 5510th grade: 6411th grade: 4312th grade, no diploma: 122High school graduate (or equivalency): 1,957Less than 1 year of college: 860Some college more than 1 year, no degree: 1,229Associate degree: 592Bachelor's degree: 2,013Master's degree: 618Professional school degree: 60Doctorate degree: 99
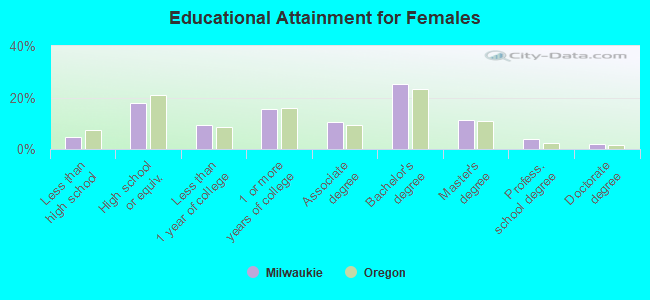
Education attainment for females 25 years and older:
No schooling: 109Nursery to 4th grade: 45th and 6th grade: 07th and 8th grade: 649th grade: 1710th grade: 1811th grade: 4912th grade, no diploma: 107High school graduate (or equivalency): 1,461Less than 1 year of college: 746Some college more than 1 year, no degree: 1,259Associate degree: 858Bachelor's degree: 2,065Master's degree: 933Professional school degree: 305Doctorate degree: 167
Housing units in structures:
One, detached: 6,693One, attached: 304Two: 1963 or 4: 3615 to 9: 57210 to 19: 39920 to 49: 41550 or more: 842Mobile homes: 113Housing units lacking complete kitchen facilities in 2022: 0.7%House/condo owner moved in on average 10 years ago
Renter moved in on average 2 years ago
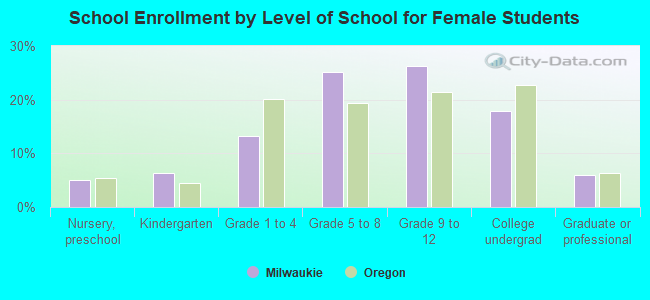
Private vs. public school enrollment:
Students in private schools in grades 1 to 8 (elementary and middle school): 97 Students in private schools in grades 9 to 12 (high school): 73 Students in private undergraduate colleges: 246