Housing density: 252 houses/condos per square mile
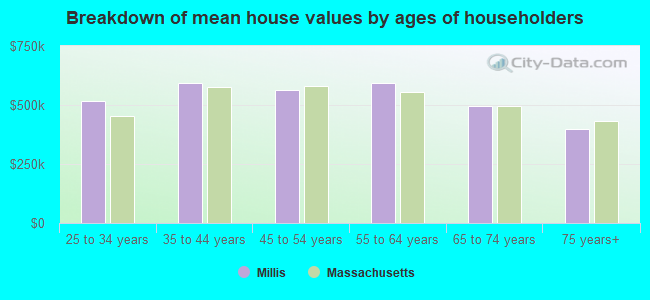
Median price asked for vacant for-sale houses and condos in 2022 in this county: $751,928.
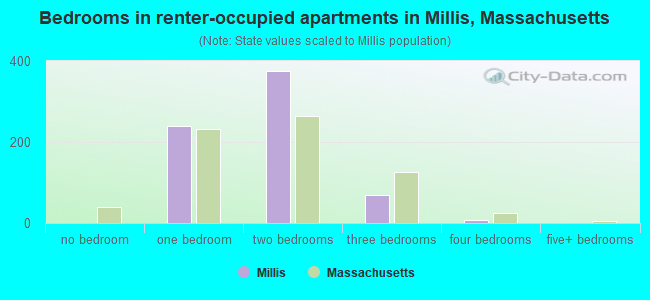
Median contract rent in 2022: $1,798 (lower quartile is $1,387, upper quartile is $1,975)
Median rent asked for vacant for-rent units in 2022: $1,460
Median gross rent in Millis, MA in 2022: $1,885
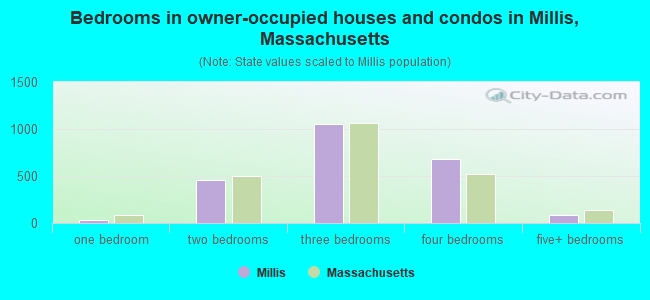
Housing units in Millis with a mortgage: 1,629 (138 second mortgage, 218 home equity loan, 9 both second mortgage and home equity loan) Houses without a mortgage: 427
In family households: 540,608 (116,996 male householders, 51,907 female householders)
134,066 spouses, 197,825 children (189,784 natural, 4,588 adopted, 3,453 stepchildren), 7,406 grandchildren, 6,062 brothers or sisters, 7,064 parents, foster children, 5,893 other relatives, 9,006 non-relatives
In nonfamily households: 112,631 (36,559 male householders (27,334 living alone)), 52,452 female householders (43,798 living alone)), 23,620 nonrelatives
In group quarters: 17,611 (8,991 institutionalized population)
123,500 married couples with children.
20,654 single-parent households (3,498 men, 17,156 women).
92.0% of residents of Millis speak English at home.
2.0% of residents speak Spanish at home (72% speak English very well, 17% speak English well, 12% speak English not well).
5.2% of residents speak other Indo-European language at home (66% speak English very well, 25% speak English well, 3% speak English not well, 6% don't speak English at all).
0.5% of residents speak Asian or Pacific Island language at home (24% speak English well, 76% speak English not well).
0.2% of residents speak other language at home (41% speak English well, 59% speak English not well).
Foreign born population: 836 (9.5%)
(70.3% of them are naturalized citizens)
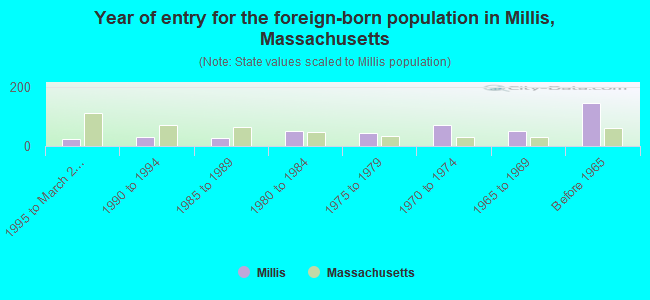
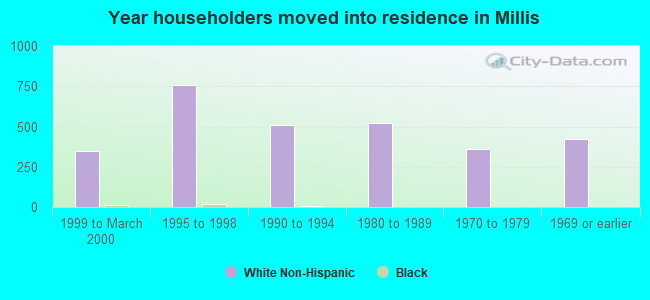
Year of entry for the foreign-born population in Millis, Massachusetts
251995 to March 2000
321990 to 1994
261985 to 1989
511980 to 1984
451975 to 1979
731970 to 1974
501965 to 1969
145Before 1965
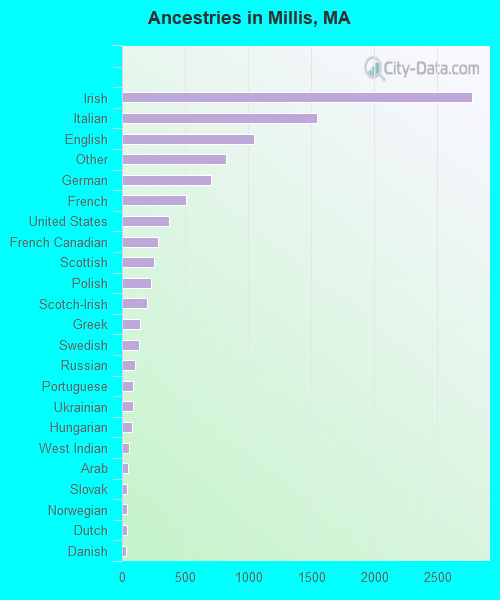
First ancestries reported:
Irish: 2,771 (28.6%)
Italian: 1,542 (15.9%)
English: 1,045 (10.8%)
Other: 827 (8.5%)
German: 709 (7.3%)
French: 507 (5.2%)
United States: 376 (3.9%)
French Canadian: 289 (3.0%)
Scottish: 252 (2.6%)
Polish: 227 (2.3%)
Scotch-Irish: 197 (2.0%)
Greek: 144 (1.5%)
Swedish: 131 (1.4%)
Russian: 104 (1.1%)
Portuguese: 87 (0.9%)
Ukrainian: 86 (0.9%)
Hungarian: 76 (0.8%)
West Indian: 57 (0.6%)
Arab: 49 (0.5%)
Slovak: 42 (0.4%)
Norwegian: 41 (0.4%)
Dutch: 36 (0.4%)
Danish: 29 (0.3%)
Czech: 24 (0.2%)
Lithuanian: 20 (0.2%)
Swiss: 8 (0.08%)
Most common places of birth for foreign-born residents (%):
Canada
Millis:
13.9% (62)
Massachusetts:
5.2% (40,247)
United Kingdom
Millis:
9.2% (41)
Massachusetts:
3.3% (25,403)
Brazil
Millis:
7.6% (34)
Massachusetts:
4.7% (36,669)
Greece
Millis:
6.5% (29)
Massachusetts:
1.7% (12,975)
Haiti
Millis:
6.0% (27)
Massachusetts:
4.4% (33,862)
Lebanon
Millis:
5.8% (26)
Massachusetts:
0.9% (6,691)
France
Millis:
5.4% (24)
Massachusetts:
0.8% (5,895)
Czechoslovakia (includes Czech Republic and Slovakia)
Millis:
4.7% (21)
Massachusetts:
0.3% (1,943)
Russia
Millis:
4.5% (20)
Massachusetts:
2.3% (17,449)
China, excluding Hong Kong and Taiwan
Millis:
4.3% (19)
Massachusetts:
5.1% (39,255)
Philippines
Millis:
4.0% (18)
Massachusetts:
1.0% (7,414)
Poland
Millis:
3.6% (16)
Massachusetts:
1.8% (13,543)
Mexico
Millis:
3.6% (16)
Massachusetts:
1.0% (7,867)
Italy
Millis:
3.1% (14)
Massachusetts:
3.7% (28,319)
Other Eastern Europe
Millis:
3.1% (14)
Massachusetts:
1.6% (12,350)
Other Northern Europe
Millis:
2.9% (13)
Massachusetts:
0.4% (3,051)
Ireland
Millis:
2.2% (10)
Massachusetts:
2.3% (17,987)
Vietnam
Millis:
2.2% (10)
Massachusetts:
3.9% (30,457)
Israel
Millis:
2.2% (10)
Massachusetts:
0.4% (3,319)
Portugal
Millis:
2.0% (9)
Massachusetts:
8.6% (66,627)
India
Millis:
1.8% (8)
Massachusetts:
3.6% (28,086)
Place of birth for U.S.-born residents:
This state: 5,992
Other state: 1,444
Northeast: 851
Midwest: 272
South: 208
West: 113
65% of Millis residents lived in the same house 5 years ago. Out of people who lived in different houses, 56% lived in this county. Out of people who lived in different counties, 78% lived in Massachusetts.
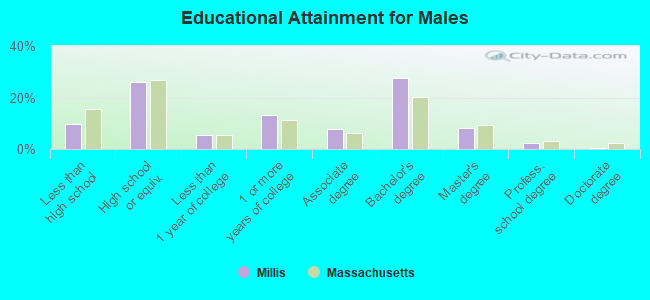
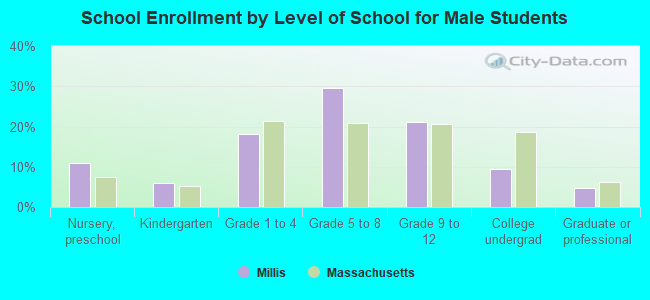
Education attainment for males 25 years and older:
No schooling: 0
Nursery to 4th grade: 16
5th and 6th grade: 27
7th and 8th grade: 20
9th grade: 11
10th grade: 82
11th grade: 49
12th grade, no diploma: 40
High school graduate (or equivalency): 658
Less than 1 year of college: 137
Some college more than 1 year, no degree: 331
Associate degree: 202
Bachelor's degree: 700
Master's degree: 204
Professional school degree: 57
Doctorate degree: 9
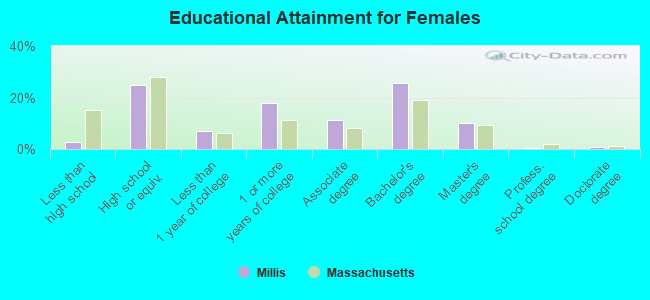
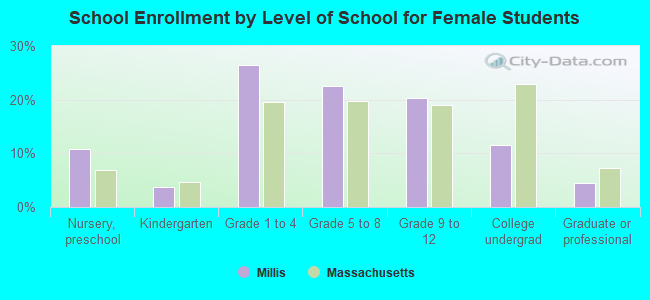
Education attainment for females 25 years and older:
No schooling: 5
Nursery to 4th grade: 0
5th and 6th grade: 18
7th and 8th grade: 7
9th grade: 20
10th grade: 0
11th grade: 0
12th grade, no diploma: 23
High school graduate (or equivalency): 709
Less than 1 year of college: 195
Some college more than 1 year, no degree: 506
Associate degree: 323
Bachelor's degree: 733
Master's degree: 293
Professional school degree: 15
Doctorate degree: 17
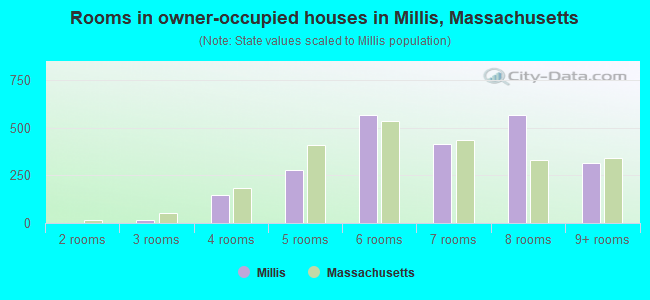
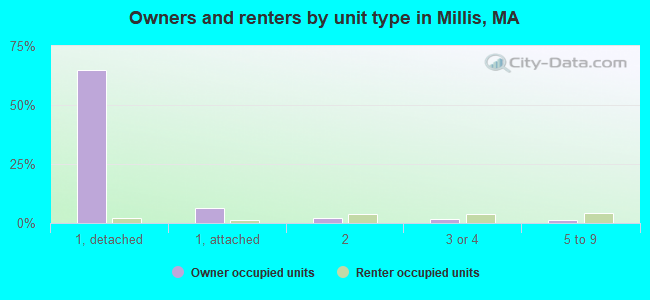
Housing units in structures:
One, detached: 2,034
One, attached: 234
Two: 213
3 or 4: 169
5 to 9: 174
10 to 19: 160
20 to 49: 38
50 or more: 44
Housing units lacking complete plumbing facilities: 0.3%