Housing density: 2,703 houses/condos per square mile
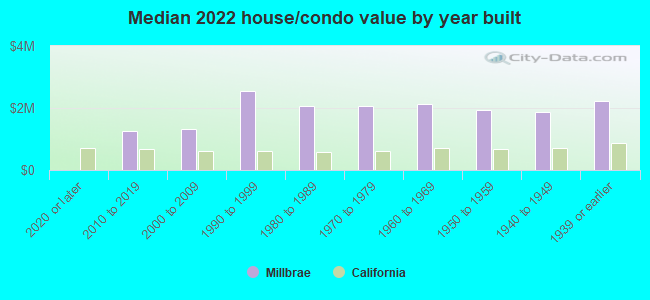
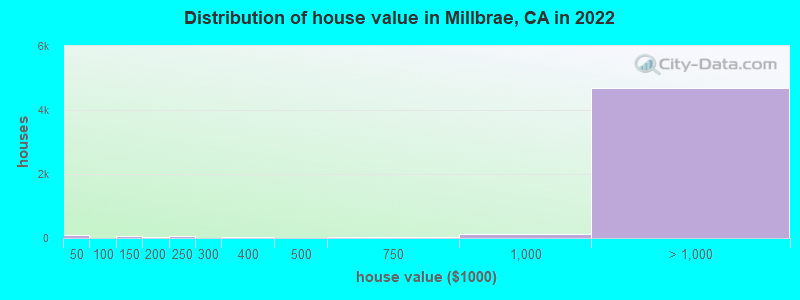
Median price asked for vacant for-sale houses and condos in 2022: $2,039,156.
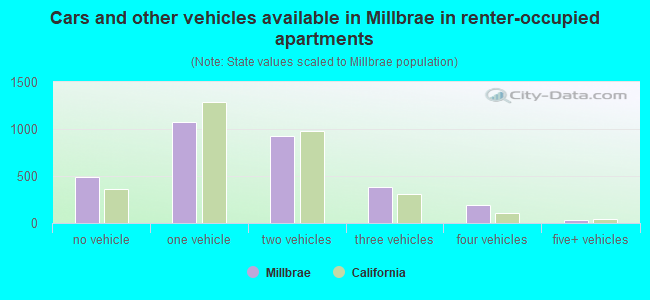
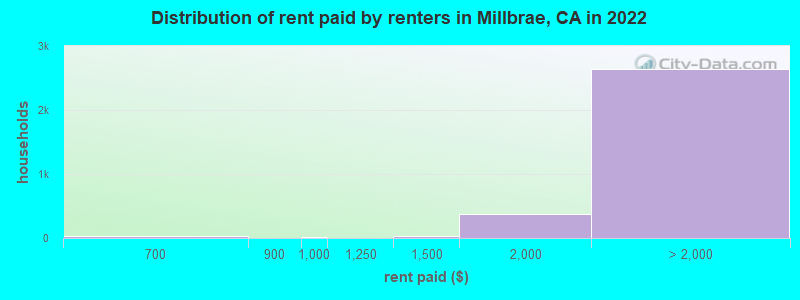
Median contract rent in 2022: over $2,000 (lower quartile is over $2,000, upper quartile is over $2,000)
Median rent asked for vacant for-rent units in 2022: $4,390
Median gross rent in Millbrae, CA in 2022: over $2,000
Housing units in Millbrae with a mortgage: 2,811 (327 second mortgage, 3 home equity loan, 308 both second mortgage and home equity loan) Houses without a mortgage: 46
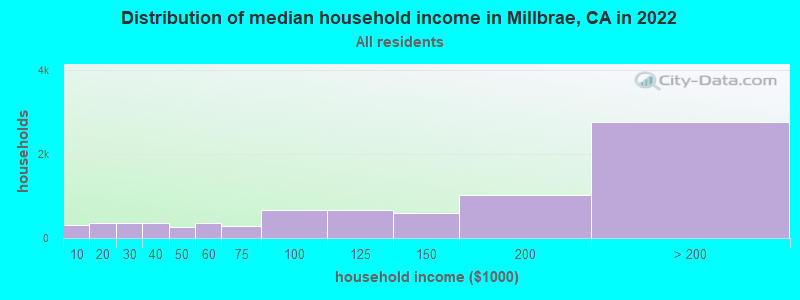
Median household income for houses/condos with a mortgage: $218,420
Median household income for apartments without a mortgage: $104,672
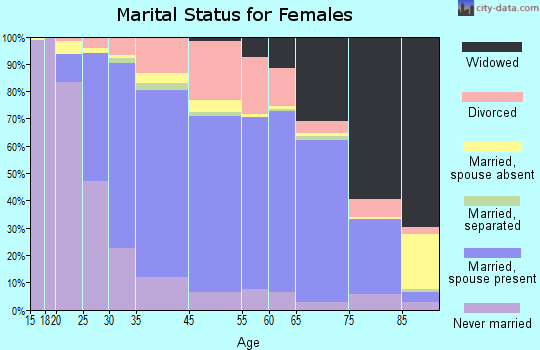
3,066 married couples with children.
522 single-parent households (151 men, 371 women).
52.9% of residents of Millbrae speak English at home.
5.5% of residents speak Spanish at home (64% speak English very well, 25% speak English well, 10% speak English not well, 1% don't speak English at all).
6.5% of residents speak other Indo-European language at home (61% speak English very well, 21% speak English well, 12% speak English not well, 5% don't speak English at all).
33.7% of residents speak Asian or Pacific Island language at home (56% speak English very well, 28% speak English well, 13% speak English not well, 3% don't speak English at all).
2.1% of residents speak other language at home (86% speak English very well, 14% speak English well).
Foreign born population: 8,925 (40.4%)
(70.7% of them are naturalized citizens)
Percentage of workers working in this county: 71.6% Number of people working at home: 2,587 (24.3% of all workers)
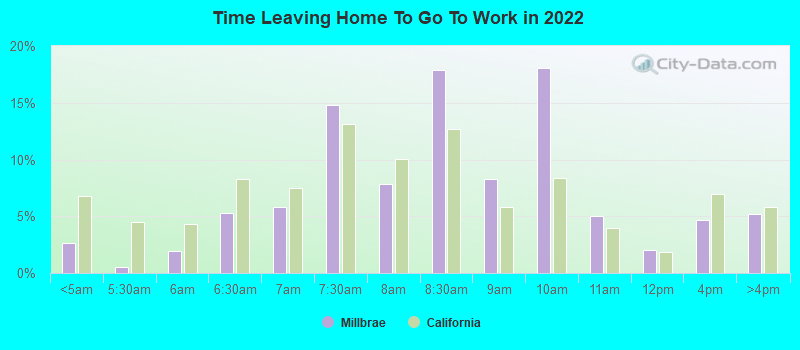
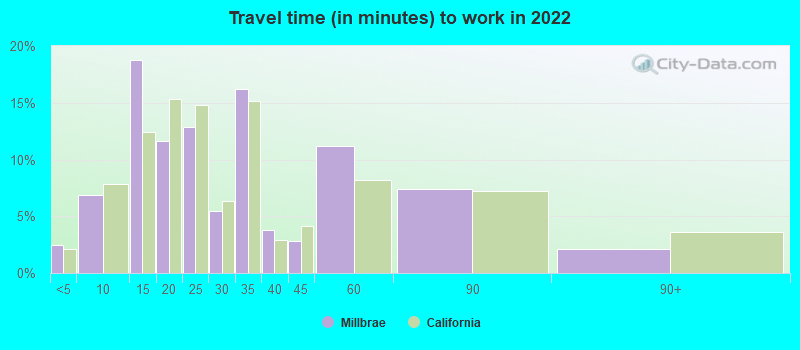
Travel time to work (commute)
Less than 5 minutes: 129
5 to 9 minutes: 560
10 to 14 minutes: 907
15 to 19 minutes: 1,492
20 to 24 minutes: 1,106
25 to 29 minutes: 398
30 to 34 minutes: 1,147
35 to 39 minutes: 566
40 to 44 minutes: 441
45 to 59 minutes: 720
60 to 89 minutes: 367
90 or more minutes: 136
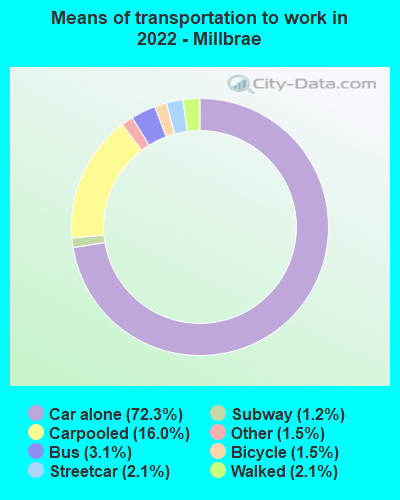
Means of transportation to work:
Drove a car alone: 3,850 (49.9%)
Carpooled: 931 (12.1%)
Bus: 148 (1.9%)
Subway or elevated rail: 89 (1.2%)
Long-distance train or commuter rail: 67 (0.9%)
Taxi: 66 (0.9%)
Bicycle: 94 (1.2%)
Walked: 126 (1.6%)
Worked at home: 2,587 (33.5%)
Unemployment by race in 2022
Unemployment rate for White non-Hispanic residents
2.8%Males
4.4%Females
Unemployment rate for Black residents
6.4%Males
Unemployment rate for American Indian and Alaska Native residents
100.0%Females
Unemployment rate for Asian residents
2.8%Males
3.4%Females
Unemployment rate for other race residents
8.9%Males
35.3%Females
Unemployment rate for two or more race residents
4.6%Males
Unemployment rate for Hispanic or Latino residents
4.5%Males
12.6%Females
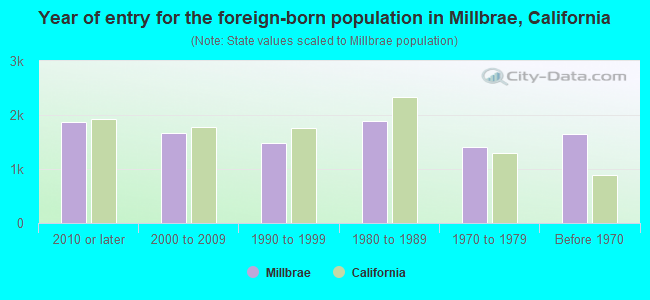
Year of entry for the foreign-born population in Millbrae, California
1,8752010 or later
1,6592000 to 2009
1,4881990 to 1999
1,8981980 to 1989
1,4061970 to 1979
1,645Before 1970
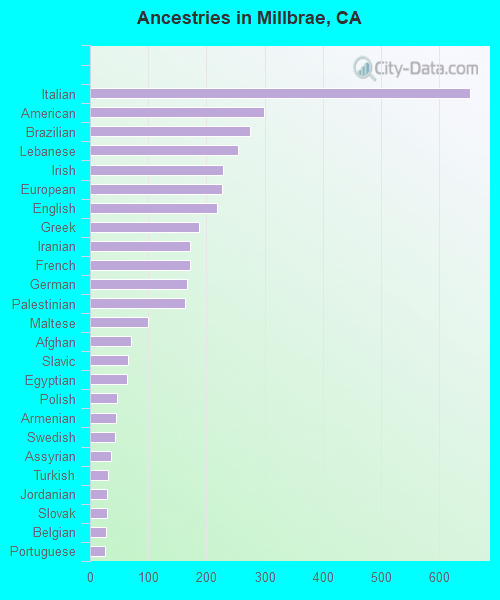
First ancestries reported:
Italian: 653 (4.7%)
American: 299 (2.2%)
Brazilian: 275 (2.0%)
Lebanese: 255 (1.8%)
Irish: 228 (1.6%)
European: 226 (1.6%)
English: 219 (1.6%)
Greek: 188 (1.4%)
Iranian: 171 (1.2%)
French: 171 (1.2%)
German: 167 (1.2%)
Palestinian: 164 (1.2%)
Maltese: 99 (0.7%)
Afghan: 71 (0.5%)
Slavic: 66 (0.5%)
Egyptian: 64 (0.5%)
Polish: 46 (0.3%)
Armenian: 44 (0.3%)
Swedish: 43 (0.3%)
Assyrian: 36 (0.3%)
Turkish: 31 (0.2%)
Jordanian: 30 (0.2%)
Slovak: 30 (0.2%)
Belgian: 28 (0.2%)
Portuguese: 26 (0.2%)
Scottish: 25 (0.2%)
Danish: 19 (0.1%)
Ukrainian: 18 (0.1%)
Czech: 17 (0.1%)
Russian: 16 (0.1%)
Eastern European: 15 (0.1%)
Ethiopian: 14 (0.1%)
Swiss: 13 (0.09%)
Northern European: 11 (0.08%)
Croatian: 10 (0.07%)
British: 8 (0.06%)
French Canadian: 8 (0.06%)
Finnish: 8 (0.06%)
Dutch: 7 (0.05%)
Lithuanian: 7 (0.05%)
Yugoslavian: 6 (0.04%)
Hungarian: 4 (0.03%)
Slovene: 2 (0.01%)
Most common places of birth for foreign-born residents (%):
China, excluding Hong Kong and Taiwan
Millbrae:
30.3% (2,736)
California:
6.6% (684,672)
Hong Kong
Millbrae:
12.6% (1,137)
California:
1.0% (105,215)
Philippines
Millbrae:
6.6% (593)
California:
7.8% (818,297)
Taiwan
Millbrae:
6.2% (556)
California:
1.7% (176,274)
India
Millbrae:
3.8% (344)
California:
5.2% (539,184)
Brazil
Millbrae:
2.9% (258)
California:
0.5% (53,222)
Korea
Millbrae:
2.5% (227)
California:
3.0% (315,248)
Vietnam
Millbrae:
2.1% (191)
California:
4.9% (512,335)
Mexico
Millbrae:
1.9% (170)
California:
37.2% (3,881,193)
El Salvador
Millbrae:
1.7% (156)
California:
4.2% (440,287)
France
Millbrae:
1.7% (150)
California:
0.4% (40,224)
Burma (Myanmar)
Millbrae:
1.7% (150)
California:
0.3% (28,176)
Place of birth for U.S.-born residents:
This state: 10,446
Other state: 2,427
Northeast: 912
Midwest: 610
South: 418
West: 473
89.1% of Millbrae residents lived in the same house 1 years ago. Out of people who lived in different houses, 37.3% lived in this county. Out of people who lived in different counties, 81.7% lived in California.
Millbrae:
89.1%
State average:
88.9%
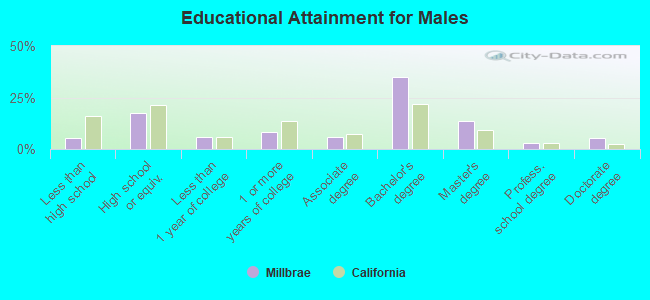
Education attainment for males 25 years and older:
No schooling: 119
Nursery to 4th grade: 40
5th and 6th grade: 38
7th and 8th grade: 52
9th grade: 26
10th grade: 18
11th grade: 19
12th grade, no diploma: 96
High school graduate (or equivalency): 1,358
Less than 1 year of college: 461
Some college more than 1 year, no degree: 651
Associate degree: 452
Bachelor's degree: 2,686
Master's degree: 1,038
Professional school degree: 225
Doctorate degree: 396
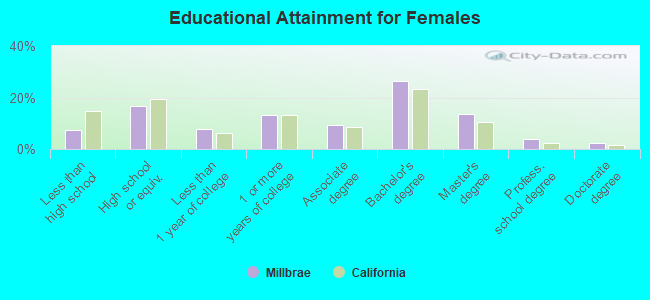
Education attainment for females 25 years and older:
No schooling: 110
Nursery to 4th grade: 180
5th and 6th grade: 117
7th and 8th grade: 0
9th grade: 40
10th grade: 46
11th grade: 12
12th grade, no diploma: 146
High school graduate (or equivalency): 1,462
Less than 1 year of college: 675
Some college more than 1 year, no degree: 1,160
Associate degree: 804
Bachelor's degree: 2,328
Master's degree: 1,203
Professional school degree: 330
Doctorate degree: 188
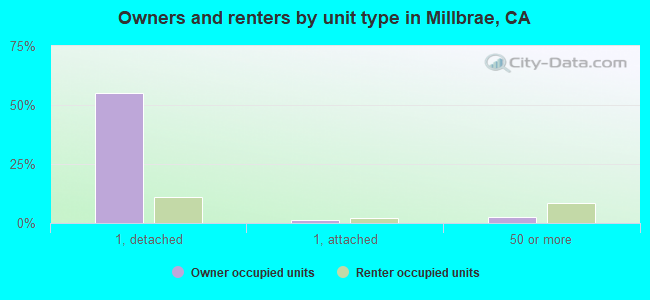
Housing units in structures:
One, detached: 5,557
One, attached: 308
Two: 117
3 or 4: 247
5 to 9: 471
10 to 19: 535
20 to 49: 396
50 or more: 1,025
Mobile homes: 6
Boats, RVs, vans, etc.: 22
Housing units lacking complete plumbing facilities in 2022: 0.1%
Housing units lacking complete kitchen facilities in 2022: 0.8%
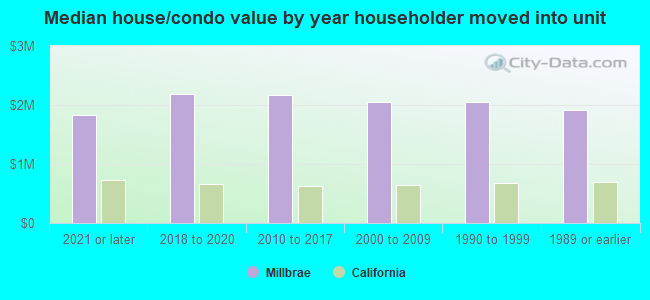
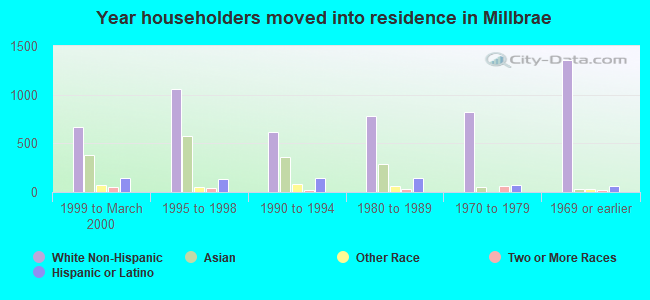
House/condo owner moved in on average 21 years ago