Midvale, UT (Utah) Houses and Residents
| Midvale: | $434,577 |
| Utah: | $499,500 |
Mean price in 2022:
Detached houses: $438,004
Here: $438,004 State: $607,750 Townhouses or other attached units: $453,121
Here: $453,121 State: $444,505 In 2-unit structures: $224,960
Here: $224,960 State: $433,540 In 3-to-4-unit structures: $441,294
Here: $441,294 State: $362,850 In 5-or-more-unit structures: $290,758
Here: $290,758 State: $412,810 Mobile homes: $77,653
Here: $77,653 State: $113,475
Total population: 31,725 (Urban population: 27,039, Rural population: 0)
Houses: 16,555 (15,573 occupied: 6,998 owner occupied, 8,479 renter occupied)
| % of renters here: | 55% |
| State: | 29% |
Housing density: 2,834 houses/condos per square mile
Median price asked for vacant for-sale houses and condos in 2022: $388,008.
Median contract rent in 2022: $1,333 (lower quartile is $1,058, upper quartile is $1,590)
Median rent asked for vacant for-rent units in 2022: $1,478
Median gross rent in Midvale, UT in 2022: $1,424
Housing units in Midvale with a mortgage: 5,233 (667 second mortgage, 37 home equity loan, 577 both second mortgage and home equity loan)
Houses without a mortgage: 100
Median household income for houses/condos with a mortgage: $99,662
Median household income for apartments without a mortgage: $67,707
Median monthly housing costs: $1,402
Compare current foreclosures in Midvale, UT:
| Photo | Address | Area | Beds / Baths | Price | Details |
|---|---|---|---|---|---|

|
#1
Greenwood Ave
Midvale, UT 84047
|
2,105 sq. feet
|
2 baths 3 beds |
show details | |

|
#2
E Shadow Ridge Dr Apt 3c
Midvale, UT 84047
|
810 sq. feet
|
2 baths 2 beds |
show details | |

|
#3
S Grant St
Midvale, UT 84047
|
2,135 sq. feet
|
2 baths 3 beds |
show details | |

|
#4
E Sandy Woods Ln
Midvale, UT 84047
|
1,821 sq. feet
|
3 baths 4 beds |
show details | |

|
#5
W Wasatch St
Midvale, UT 84047
|
1,210 sq. feet
|
1 baths 3 beds |
show details | |

|
#6
E Cobblestone Dr
Midvale, UT 84047
|
1,436 sq. feet
|
4 baths 2 beds |
show details | |

|
#7
S Birch St
Midvale, UT 84047
|
2,882 sq. feet
|
5 baths 8 beds |
show details | |

|
#8
S 520 E
Midvale, UT 84047
|
1,452 sq. feet
|
2 baths 3 beds |
show details | |

|
#9
E 7800 S
Midvale, UT 84047
|
1,025 sq. feet
|
1 baths 3 beds |
show details | |

|
#10
E Timbercraft Ln
Midvale, UT 84047
|
2,087 sq. feet
|
2 baths 3 beds |
show details |
| Photo | Address | Area | Beds / Baths | Price | Details |
|---|---|---|---|---|---|

|
#11
S Ivy Dr
Midvale, UT 84047
|
1,710 sq. feet
|
1 baths 4 beds |
show details | |

|
#12
S 580 E
Midvale, UT 84047
|
2,392 sq. feet
|
3 baths 4 beds |
show details | |

|
#13
W California Dr
Midvale, UT 84047
|
1,586 sq. feet
|
1 baths 3 beds |
show details | |

|
#14
E 7060 S
Midvale, UT 84047
|
2,315 sq. feet
|
2 baths 6 beds |
show details | |

|
#15
S Oak St
Midvale, UT 84047
|
1,184 sq. feet
|
3 baths 4 beds |
show details | |

|
#16
W Mountain View Dr
Midvale, UT 84047
|
1,652 sq. feet
|
2 baths 4 beds |
show details | |

|
#17
S Roosevelt St
Midvale, UT 84047
|
928 sq. feet
|
1 baths 2 beds |
show details | |

|
#18
S 200 E
Midvale, UT 84047
|
990 sq. feet
|
1 baths 2 beds |
show details | |

|
#19
E Angie Cir
Midvale, UT 84047
|
1,915 sq. feet
|
2 baths 4 beds |
show details | |

|
#20
W Cannara Way
Midvale, UT 84047
|
- sq. feet
|
- baths - beds |
show details |
| Photo | Address | Area | Beds / Baths | Price | Details |
|---|---|---|---|---|---|

|
#21
S State St Apt 1204
Midvale, UT 84047
|
- sq. feet
|
- baths - beds |
show details | |

|
#22
S 745 E Apt G
Midvale, UT 84047
|
- sq. feet
|
- baths - beds |
show details | |

|
#23
3rd Ave
Midvale, UT 84047
|
- sq. feet
|
- baths - beds |
show details | |

|
#24
S 840 E
Midvale, UT 84047
|
- sq. feet
|
- baths - beds |
show details | |

|
#25
E Fort Union Blvd # 480
Midvale, UT 84047
|
- sq. feet
|
- baths - beds |
show details | |

|
#26
S Pamela Way # 10a
Midvale, UT 84047
|
- sq. feet
|
- baths - beds |
show details | |

|
#27
S Village River Ln Apt 1
Midvale, UT 84047
|
- sq. feet
|
- baths - beds |
show details | |

|
#28
S Candlestick Ln Apt 101
Midvale, UT 84047
|
- sq. feet
|
- baths - beds |
show details | |

|
#29
W Tuscany View Rd Unit C14
Midvale, UT 84047
|
- sq. feet
|
- baths - beds |
show details | |

|
#30
E Fort Union Blvd Apt 319
Midvale, UT 84047
|
- sq. feet
|
- baths - beds |
show details |
| Photo | Address | Area | Beds / Baths | Price | Details |
|---|---|---|---|---|---|

|
#31
S Monroe St
Midvale, UT 84047
|
- sq. feet
|
- baths - beds |
show details | |

|
#32
W Alta View Dr
Midvale, UT 84047
|
- sq. feet
|
- baths - beds |
show details | |

|
#33
S Seghini Dr
Midvale, UT 84047
|
- sq. feet
|
- baths - beds |
show details | |

|
#34
E Well Wood Rd Apt 28p
Midvale, UT 84047
|
- sq. feet
|
- baths - beds |
show details | |

|
#35
W Wasatch St
Midvale, UT 84047
|
- sq. feet
|
- baths - beds |
show details | |

|
#36
W Plumtree Ln Apt 5c
Midvale, UT 84047
|
- sq. feet
|
- baths - beds |
show details | |

|
#37
W Inglenook Dr Apt 703
Midvale, UT 84047
|
- sq. feet
|
- baths - beds |
show details | |

|
#38
S Rope Key Dr Apt L303
Midvale, UT 84047
|
- sq. feet
|
- baths - beds |
show details | |

|
#39
S Village River Ln Apt I1
Midvale, UT 84047
|
- sq. feet
|
- baths - beds |
show details | |

|
#40
W Marquette Dr
Midvale, UT 84047
|
- sq. feet
|
- baths - beds |
show details |
| Photo | Address | Area | Beds / Baths | Price | Details |
|---|---|---|---|---|---|

|
#41
W San Lorenzo Way Apt G101
Midvale, UT 84047
|
- sq. feet
|
- baths - beds |
show details | |

|
#42
S High Tech Dr Apt 13
Midvale, UT 84047
|
- sq. feet
|
- baths - beds |
show details | |

|
#43
E Ridge Hill Ln
Midvale, UT 84047
|
- sq. feet
|
- baths - beds |
show details | |

|
#44
S Allen St
Midvale, UT 84047
|
- sq. feet
|
- baths - beds |
show details | |

|
#45
S 700 W Apt K202
Midvale, UT 84047
|
- sq. feet
|
- baths - beds |
show details | |

|
#46
W Inglenook Dr Apt 2207
Midvale, UT 84047
|
- sq. feet
|
- baths - beds |
show details | |

|
#47
W Tuscany View Rd Unit B33
Midvale, UT 84047
|
- sq. feet
|
- baths - beds |
show details | |

|
#48
W Center St, Apt 320
Midvale, UT 84047
|
- sq. feet
|
- baths - beds |
show details | |

|
#49
E Well Spring Rd Apt 21h
Midvale, UT 84047
|
- sq. feet
|
- baths - beds |
show details | |

|
Check over 1 million property listings on Foreclosure.com!
|
browse all offers | |||

Latest news about housing in Midvale, UT collected exclusively by city-data.com from local newspapers, TV, and radio stations

 | Best apartments in SLC metro for $1000 or less? (3 replies) |
| Are homes in West Valley City the most affordable in the Salt Lake City metro area ? (7 replies) |
| Black in SLC (154 replies) |
| Bus reliability in Midvale-Cottonwood Heights area? (11 replies) |
| Apartment recommendations near West Jordan with/near dog park (15 replies) |
| Techie Texans Looking To Move to Utah (33 replies) |

Median year apartment built: 1992
Household type by relationship:
Households: 35,778- Male householders: 7,422 (2,236 living alone), Female householders: 7,519 (2,534 living alone)
5,686 spouses (5,618 opposite-sex spouses), 1,687 unmarried partners, (1,652 opposite-sex unmarried partners), 9,788 children (9,153 natural, 382 adopted, 252 stepchildren), 220 grandchildren, 720 brothers or sisters, 591 parents, 0 foster children, 554 other relatives, 1,113 non-relatives
- In group quarters: 473
Size of family households: 3,995 2-persons, 2,251 3-persons, 1,819 4-persons, 845 5-persons, 123 6-persons, 151 7-or-more-persons.
Size of nonfamily households: 4,827 1-person, 1,363 2-persons, 113 3-persons.
4,424 married couples with children.
2,901 single-parent households (792 men, 2,109 women).
77.4% of residents of Midvale speak English at home.
13.0% of residents speak Spanish at home (58% speak English very well, 15% speak English well, 18% speak English not well, 9% don't speak English at all).
4.0% of residents speak other Indo-European language at home (58% speak English very well, 29% speak English well, 13% speak English not well).
4.4% of residents speak Asian or Pacific Island language at home (64% speak English very well, 26% speak English well, 9% speak English not well).
2.2% of residents speak other language at home (71% speak English very well, 5% speak English well, 24% speak English not well).
Foreign born population: 5,029 (14.1%)
(44.1% of them are naturalized citizens)
| Here: | 6.6 |
| State: | 7.6 |
| Here: | 3.9 |
| State: | 4.3 |
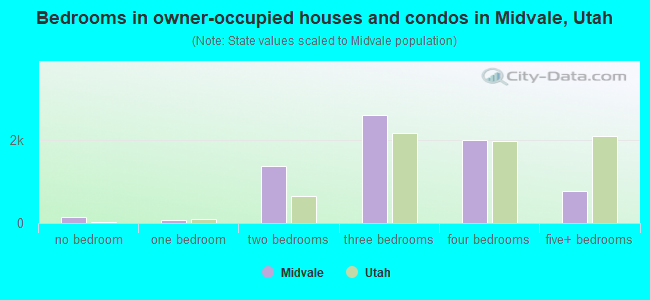
- Bedrooms in owner-occupied houses and condos in Midvale, Utah
- 154no bedroom
- 801 bedroom
- 1,3832 bedrooms
- 2,6023 bedrooms
- 1,9984 bedrooms
- 7815+ bedrooms
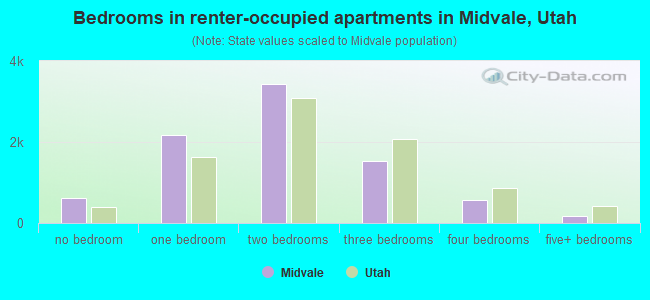
- Bedrooms in renter-occupied apartments in Midvale, Utah
- 614no bedroom
- 2,1671 bedroom
- 3,4392 bedrooms
- 1,5193 bedrooms
- 5794 bedrooms
- 1625+ bedrooms
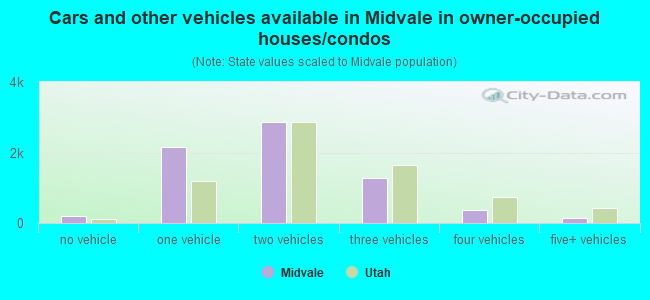
- Cars and other vehicles available in Midvale in owner-occupied houses/condos
- 196no vehicle
- 2,1501 vehicle
- 2,8682 vehicles
- 1,2723 vehicles
- 3794 vehicles
- 1335+ vehicles
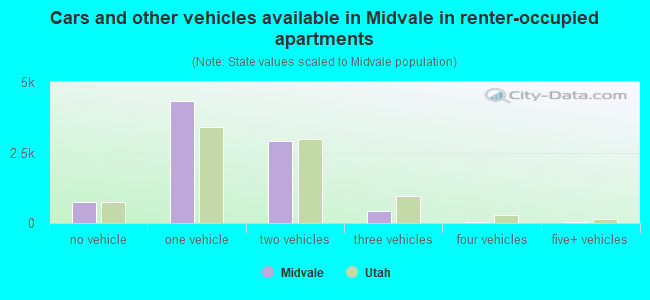
- Cars and other vehicles available in Midvale in renter-occupied apartments
- 760no vehicle
- 4,3131 vehicle
- 2,9042 vehicles
- 4113 vehicles
- 444 vehicles
- 485+ vehicles
- Rooms in owner-occupied houses in Midvale, Utah
- 1541 room
- 212 rooms
- 3683 rooms
- 5644 rooms
- 1,0525 rooms
- 1,2246 rooms
- 8877 rooms
- 1,0378 rooms
- 1,6919+ rooms
- Rooms in renter-occupied apartments in Midvale, Utah
- 4911 room
- 9212 rooms
- 2,1783 rooms
- 1,7794 rooms
- 1,5155 rooms
- 6746 rooms
- 1777 rooms
- 5408 rooms
- 2039+ rooms
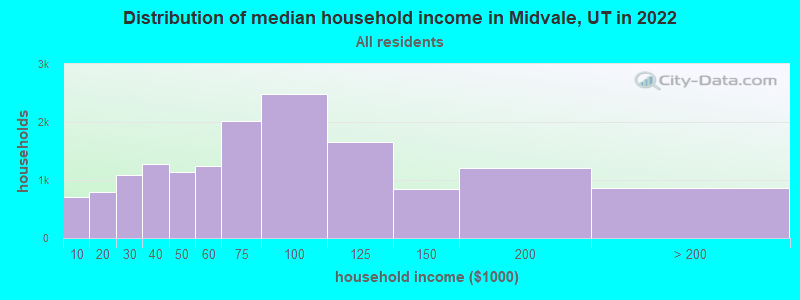
Midvale, UT household income distribution

- 709Less than $10,000
- 800$10,000 to $19,999
- 1,081$20,000 to $29,999
- 1,279$30,000 to $39,999
- 1,136$40,000 to $49,999
- 1,243$50,000 to $59,999
- 2,015$60,000 to $74,999
- 2,486$75,000 to $99,999
- 1,652$100,000 to $124,999
- 847$125,000 to $149,999
- 1,215$150,000 to $199,999
- 866$200,000 or more
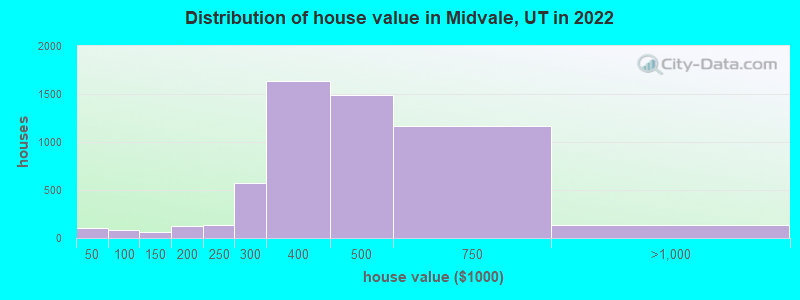
Home value of owner - occupied houses in 2022 in Midvale, UT
-
- 79Less than $10,000
- 16$20,000 to $24,999
- 9$30,000 to $34,999
- 22$50,000 to $59,999
- 18$60,000 to $69,999
- 10$70,000 to $79,999
- 18$80,000 to $89,999
- 15$90,000 to $99,999
- 60$100,000 to $124,999
- 5$125,000 to $149,999
- 5$150,000 to $174,999
- 123$175,000 to $199,999
- 135$200,000 to $249,999
- 577$250,000 to $299,999
- 1,631$300,000 to $399,999
- 1,489$400,000 to $499,999
- 1,171$500,000 to $749,999
- 113$750,000 to $999,999
- 21$2,000,000 or more
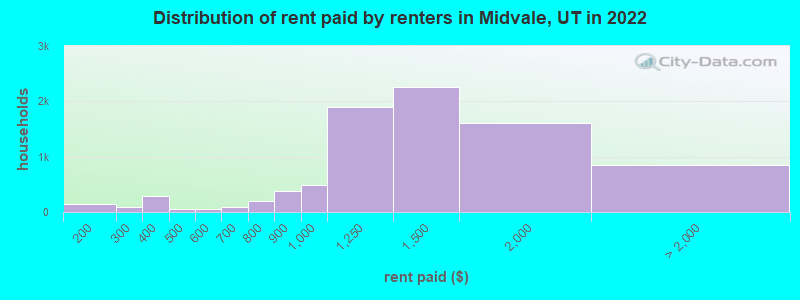
Rent paid by renters in 2022 in Midvale, UT
-
- 16Less than $100
- 144$100 to $149
- 8$150 to $199
- 77$200 to $249
- 16$250 to $299
- 147$300 to $349
- 137$350 to $399
- 16$400 to $449
- 38$450 to $499
- 45$500 to $549
- 53$600 to $649
- 45$650 to $699
- 122$700 to $749
- 69$750 to $799
- 382$800 to $899
- 490$900 to $999
- 1,903$1,000 to $1,249
- 2,262$1,250 to $1,499
- 1,615$1,500 to $1,999
- 652$2,000 to $2,499
- 65$2,500 to $2,999
- 126No cash rent
Percentage of workers working in this county: 91.4%
Number of people working at home: 3,483 (16.4% of all workers)
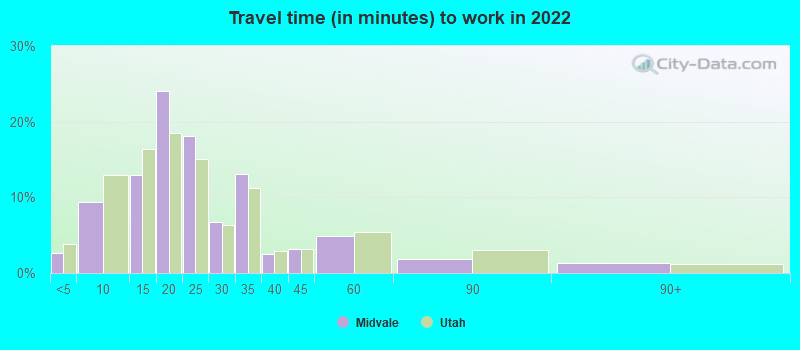
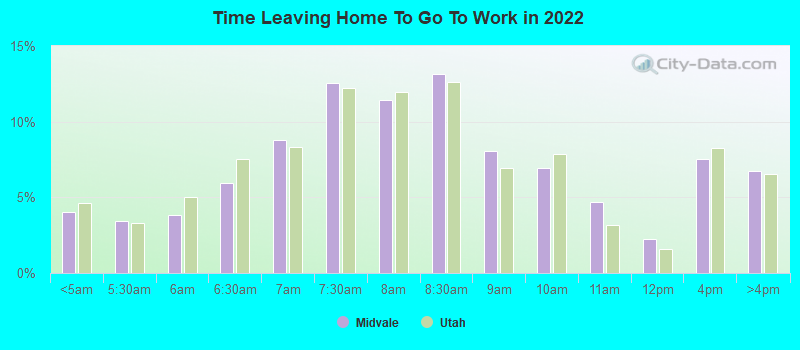
Travel time to work (commute)
- Less than 5 minutes: 325
- 5 to 9 minutes: 1,887
- 10 to 14 minutes: 2,720
- 15 to 19 minutes: 3,467
- 20 to 24 minutes: 3,604
- 25 to 29 minutes: 1,521
- 30 to 34 minutes: 1,869
- 35 to 39 minutes: 304
- 40 to 44 minutes: 768
- 45 to 59 minutes: 696
- 60 to 89 minutes: 359
- 90 or more minutes: 72
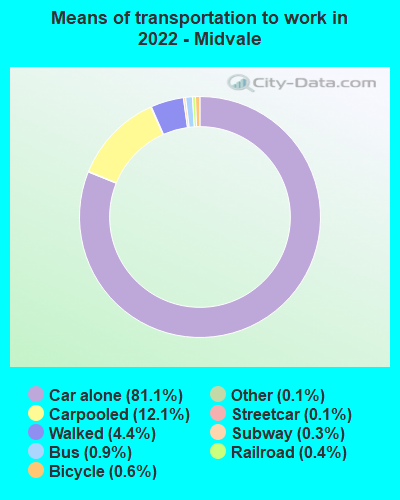
Means of transportation to work:
- Drove a car alone: 12,376 (66.3%)
- Carpooled: 1,979 (10.6%)
- Bus: 99 (0.5%)
- Subway or elevated rail: 10 (0.1%)
- Long-distance train or commuter rail: 30 (0.2%)
- Light rail, streetcar or trolley: 41 (0.2%)
- Taxi: 16 (0.1%)
- Bicycle: 86 (0.5%)
- Walked: 689 (3.7%)
- Worked at home: 3,483 (18.7%)
- Unemployment by race in 2022
- Unemployment rate for White non-Hispanic residents
- 2.0%Males
- 1.7%Females
- Unemployment rate for Black residents
- 1.6%Males
- Unemployment rate for other race residents
- 6.4%Females
- Unemployment rate for two or more race residents
- 2.2%Males
- 1.4%Females
- Unemployment rate for Hispanic or Latino residents
- 1.0%Males
- 3.3%Females
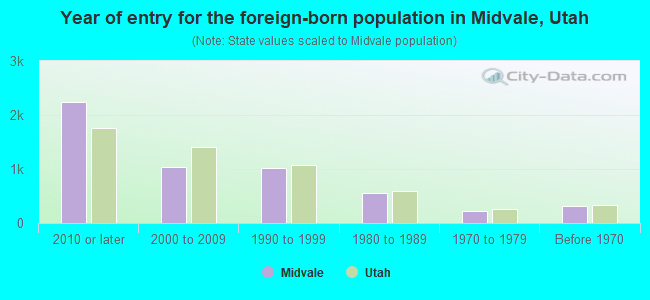
- Year of entry for the foreign-born population in Midvale, Utah
- 2,2392010 or later
- 1,0452000 to 2009
- 1,0261990 to 1999
- 5631980 to 1989
- 2301970 to 1979
- 324Before 1970
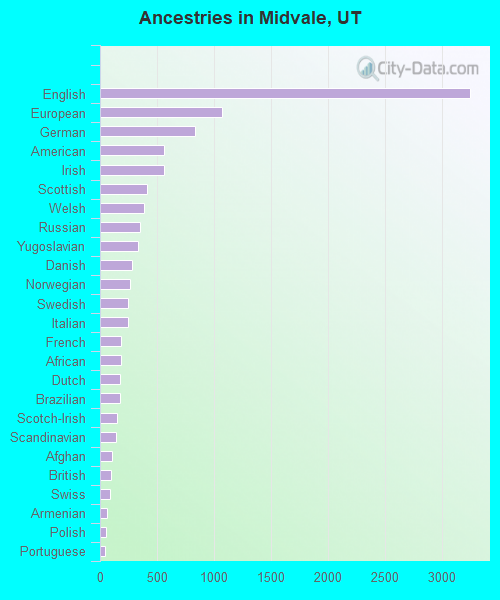
First ancestries reported:
- English: 3,252 (17.2%)
- European: 1,070 (5.6%)
- German: 831 (4.4%)
- American: 566 (3.0%)
- Irish: 566 (3.0%)
- Scottish: 416 (2.2%)
- Welsh: 383 (2.0%)
- Russian: 347 (1.8%)
- Yugoslavian: 336 (1.8%)
- Danish: 280 (1.5%)
- Norwegian: 263 (1.4%)
- Swedish: 250 (1.3%)
- Italian: 244 (1.3%)
- French: 187 (1.0%)
- African: 186 (1.0%)
- Dutch: 177 (0.9%)
- Brazilian: 174 (0.9%)
- Scotch-Irish: 150 (0.8%)
- Scandinavian: 137 (0.7%)
- Afghan: 107 (0.6%)
- British: 100 (0.5%)
- Swiss: 90 (0.5%)
- Armenian: 62 (0.3%)
- Polish: 57 (0.3%)
- Portuguese: 48 (0.3%)
- Iraqi: 47 (0.2%)
- Jamaican: 44 (0.2%)
- Basque: 40 (0.2%)
- Icelander: 40 (0.2%)
- Eastern European: 39 (0.2%)
- South African: 36 (0.2%)
- Finnish: 27 (0.1%)
- Haitian: 24 (0.1%)
- Serbian: 23 (0.1%)
- Croatian: 22 (0.1%)
- Romanian: 22 (0.1%)
- Northern European: 20 (0.1%)
- Moroccan: 16 (0.08%)
- Lebanese: 14 (0.07%)
- Greek: 12 (0.06%)
- Australian: 7 (0.04%)
- Arab: 6 (0.03%)
- Czech: 1 (0.01%)
Most common places of birth for foreign-born residents (%):
| Midvale: | 24.8% (1,259) |
| Utah: | 36.1% (99,740) |
| Midvale: | 14.1% (717) |
| Utah: | 3.2% (8,804) |
| Midvale: | 5.6% (287) |
| Utah: | 2.9% (8,017) |
| Midvale: | 5.1% (259) |
| Utah: | 2.8% (7,644) |
| Midvale: | 4.3% (221) |
| Utah: | 0.3% (917) |
| Midvale: | 3.5% (177) |
| Utah: | 1.6% (4,524) |
| Midvale: | 3.1% (157) |
| Utah: | 0.6% (1,700) |
| Midvale: | 2.9% (147) |
| Utah: | 2.7% (7,472) |
| Midvale: | 2.6% (131) |
| Utah: | 0.2% (627) |
| Midvale: | 1.8% (92) |
| Utah: | 0.1% (141) |
| Midvale: | 1.6% (82) |
| Utah: | 0.4% (1,021) |
Place of birth for U.S.-born residents:
- This state: 20,432
- Other state: 9,962
- Northeast: 816
- Midwest: 1,385
- South: 1,444
- West: 6,220
78.4% of Midvale residents lived in the same house 1 years ago.
Out of people who lived in different houses, 40.1% lived in this county.
Out of people who lived in different counties, 39.9% lived in Utah.
| Midvale: | 78.4% |
| State average: | 85.7% |
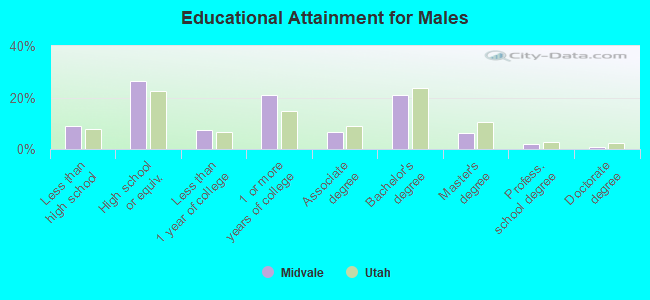
Education attainment for males 25 years and older:
- No schooling: 200
- Nursery to 4th grade: 61
- 5th and 6th grade: 233
- 7th and 8th grade: 22
- 9th grade: 87
- 10th grade: 20
- 11th grade: 76
- 12th grade, no diploma: 372
- High school graduate (or equivalency): 3,204
- Less than 1 year of college: 879
- Some college more than 1 year, no degree: 2,533
- Associate degree: 808
- Bachelor's degree: 2,548
- Master's degree: 764
- Professional school degree: 217
- Doctorate degree: 108
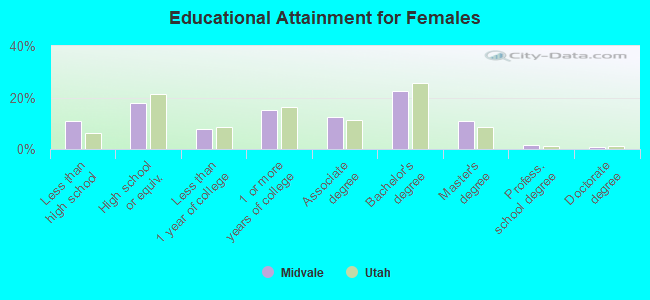
Education attainment for females 25 years and older:
- No schooling: 268
- Nursery to 4th grade: 50
- 5th and 6th grade: 264
- 7th and 8th grade: 69
- 9th grade: 106
- 10th grade: 39
- 11th grade: 173
- 12th grade, no diploma: 351
- High school graduate (or equivalency): 2,170
- Less than 1 year of college: 949
- Some college more than 1 year, no degree: 1,813
- Associate degree: 1,480
- Bachelor's degree: 2,718
- Master's degree: 1,302
- Professional school degree: 182
- Doctorate degree: 107


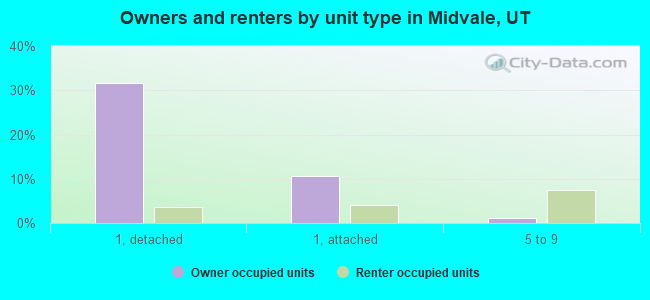
Housing units in structures:
- One, detached: 6,292
- One, attached: 1,917
- Two: 394
- 3 or 4: 1,055
- 5 to 9: 1,500
- 10 to 19: 2,248
- 20 to 49: 1,856
- 50 or more: 1,152
- Mobile homes: 136
Median worth of mobile homes: $105,558
Housing units lacking complete kitchen facilities in 2022: 0.3%
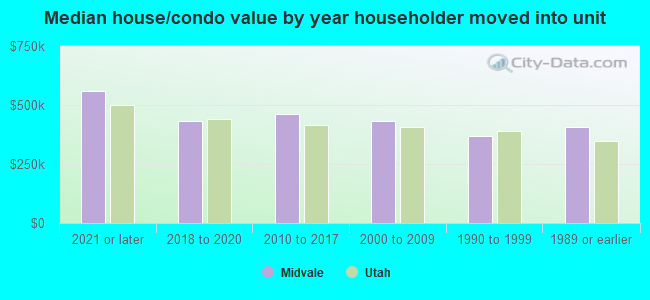
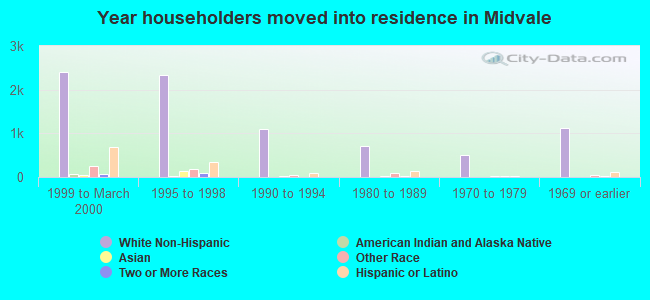
House/condo owner moved in on average 9 years ago
Renter moved in on average 3 years ago
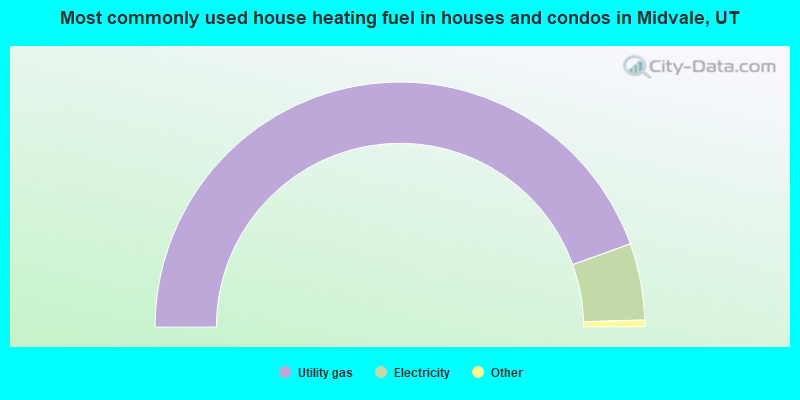
- 89.0%Utility gas
- 10.1%Electricity
- 0.6%Bottled, tank, or LP gas
- 0.1%Wood
- 0.1%No fuel used
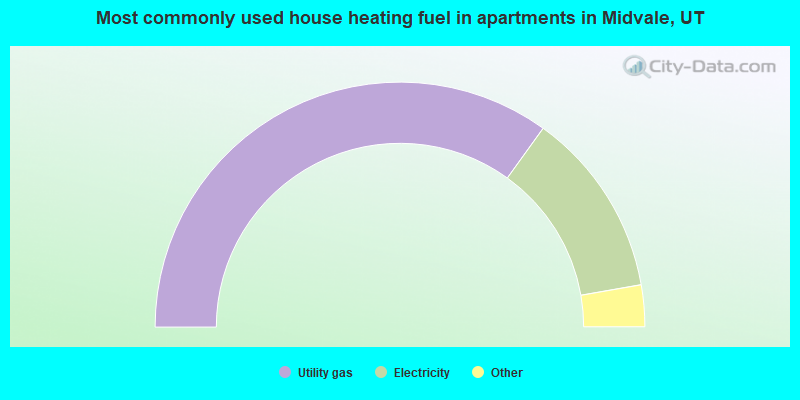
- 69.9%Utility gas
- 24.6%Electricity
- 3.2%Bottled, tank, or LP gas
- 1.6%No fuel used
- 0.3%Fuel oil, kerosene, etc.
- 0.2%Wood
- 0.2%Other fuel
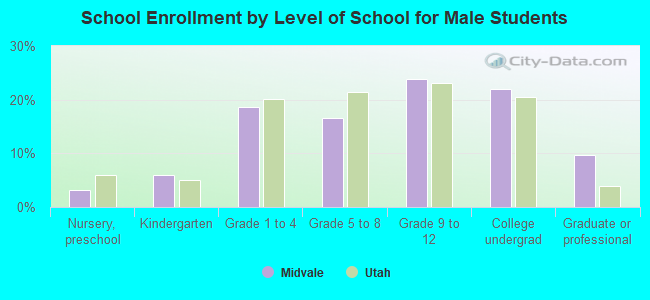
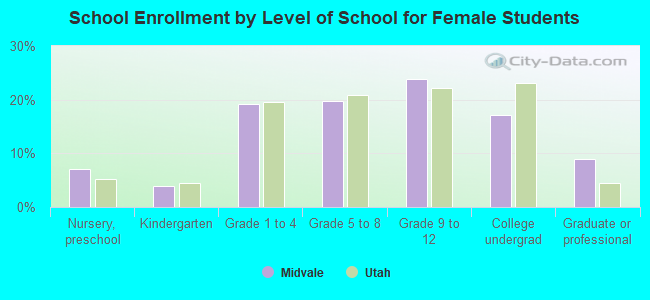
Private vs. public school enrollment:
| Here: | 4.0% |
| Utah: | 7.2% |
| Here: | 9.0% |
| Utah: | 5.3% |
| Here: | 6.3% |
| Utah: | 26.7% |