Middle Valley, TN (Tennessee) Houses and Residents
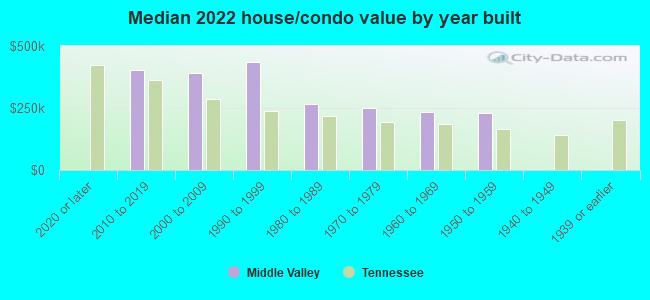
| Middle Valley: | $289,645 |
| Tennessee: | $284,800 |
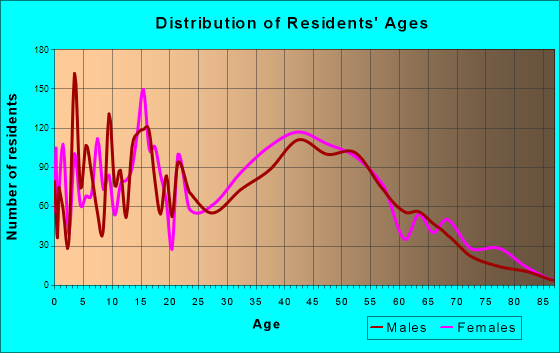
Total population: 12,684 (Urban population: 11,603, Rural population: 179 (all nonfarm))
Houses: 4,824 (4,473 occupied: 3,658 owner occupied, 805 renter occupied)
| % of renters here: | 18% |
| State: | 33% |
Housing density: 398 houses/condos per square mile
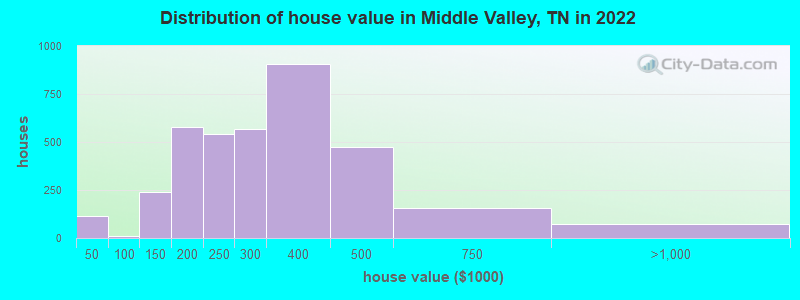
Median price asked for vacant for-sale houses and condos in 2022: $157,790.
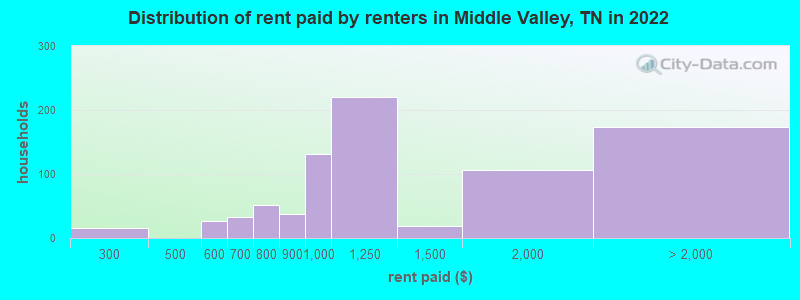
Median contract rent in 2022: $1,102 (lower quartile is $854, upper quartile is $1,319)
Median rent asked for vacant for-rent units in 2022: $798
Median gross rent in Middle Valley, TN in 2022: $1,329
Housing units in Middle Valley with a mortgage: 2,133 (166 second mortgage, 46 home equity loan, 109 both second mortgage and home equity loan)
Houses without a mortgage: 76
Median household income for houses/condos with a mortgage: $98,518
Median household income for apartments without a mortgage: $94,387
Median monthly housing costs: $1,067
Compare current foreclosures near Middle Valley, TN:
| Photo | Address | Area | Beds / Baths | Price | Details |
|---|---|---|---|---|---|

|
#1
Short Tail Springs Rd
Harrison, TN 37341
|
3,383 sq. feet
|
3 baths 4 beds |
$855,000
|
show details |

|
#2
Everett Dr
Chattanooga, TN 37421
|
2,660 sq. feet
|
2 baths 5 beds |
show details | |

|
#3
Basil Ln
Harrison, TN 37341
|
1,858 sq. feet
|
2 baths 3 beds |
show details | |

|
#4
James St
Rossville, GA 30741
|
2,255 sq. feet
|
2 baths 3 beds |
show details | |

|
#5
Emerald Creek Cir
Soddy Daisy, TN 37379
|
1,350 sq. feet
|
2 baths 3 beds |
show details | |

|
#6
Standifer Cir
Dunlap, TN 37327
|
1,152 sq. feet
|
2 baths 3 beds |
show details | |

|
#7
Georgetown Cir NW
Cleveland, TN 37312
|
1,216 sq. feet
|
2 baths 3 beds |
show details | |

|
#8
Fallen Leaf Dr
Soddy Daisy, TN 37379
|
1,508 sq. feet
|
2 baths 3 beds |
show details | |

|
#9
Dolores Dr
Hixson, TN 37343
|
1,671 sq. feet
|
2 baths 3 beds |
show details | |

|
#10
Gadd Rd
Chattanooga, TN 37415
|
1,066 sq. feet
|
1 baths 3 beds |
show details |
| Photo | Address | Area | Beds / Baths | Price | Details |
|---|---|---|---|---|---|

|
#11
Daisy St
Chattanooga, TN 37406
|
- sq. feet
|
- baths - beds |
$16,050
|
show details |

|
#12
Page Rd
Rossville, GA 30741
|
1,626 sq. feet
|
2 baths 3 beds |
show details | |

|
#13
Cuscowilla Trl
Chattanooga, TN 37415
|
1,608 sq. feet
|
2 baths 3 beds |
show details | |

|
#14
Wiley Ave
Chattanooga, TN 37412
|
2,345 sq. feet
|
2 baths 4 beds |
show details | |

|
#15
Lundy Ln
Chattanooga, TN 37412
|
1,572 sq. feet
|
2 baths 4 beds |
show details | |

|
#16
Laura Ln
Ringgold, GA 30736
|
1,308 sq. feet
|
2 baths 3 beds |
show details | |

|
#17
Rim Ridge Ct
Harrison, TN 37341
|
- sq. feet
|
2 baths 4 beds |
show details | |

|
#18
Love Ln
Hixson, TN 37343
|
912 sq. feet
|
1 baths - beds |
show details | |

|
#19
Silver Springs Trl NW
Cleveland, TN 37312
|
2,144 sq. feet
|
3 baths 3 beds |
show details | |

|
#20
Flagstone Dr
Ooltewah, TN 37363
|
5,707 sq. feet
|
6 baths - beds |
show details |
| Photo | Address | Area | Beds / Baths | Price | Details |
|---|---|---|---|---|---|

|
#21
Black Fox Rd
Mc Donald, TN 37353
|
2,442 sq. feet
|
3 baths 3 beds |
show details | |

|
#22
White Oak Rd NW
Cleveland, TN 37312
|
1,308 sq. feet
|
1 baths - beds |
show details | |

|
#23
Stonewood Dr NW
Cleveland, TN 37311
|
2,530 sq. feet
|
3 baths 3 beds |
show details | |

|
#24
Morningside Dr
Soddy Daisy, TN 37379
|
- sq. feet
|
1 baths 3 beds |
show details | |

|
#25
Longview St
Hixson, TN 37343
|
1,710 sq. feet
|
2 baths - beds |
show details | |

|
#26
Colorado St
Hixson, TN 37343
|
- sq. feet
|
2 baths 3 beds |
show details | |

|
#27
Virginia Ave SW
Cleveland, TN 37311
|
1,196 sq. feet
|
2 baths 3 beds |
show details | |

|
#28
Leinbach Rd
Rossville, GA 30741
|
1,348 sq. feet
|
1 baths - beds |
show details | |

|
#29
Castleview Dr
Ringgold, GA 30736
|
1,416 sq. feet
|
2 baths - beds |
show details | |

|
#30
Cone Dr
Fort Oglethorpe, GA 30742
|
960 sq. feet
|
1 baths - beds |
show details |
| Photo | Address | Area | Beds / Baths | Price | Details |
|---|---|---|---|---|---|

|
#31
Pinewood Cir
Fort Oglethorpe, GA 30742
|
1,920 sq. feet
|
1 baths - beds |
show details | |

|
#32
Rolling Brook Dr NE
Cleveland, TN 37323
|
1,988 sq. feet
|
1 baths - beds |
show details | |

|
#33
Sunset Dr
Whitwell, TN 37397
|
1,170 sq. feet
|
1 baths - beds |
show details | |

|
#34
Harris Creek Rd
Mc Donald, TN 37353
|
1,344 sq. feet
|
1 baths - beds |
show details | |

|
#35
Huntington Rd
Rossville, GA 30741
|
1,170 sq. feet
|
1 baths - beds |
show details | |

|
#36
Woodberry Dr NW
Cleveland, TN 37312
|
2,170 sq. feet
|
3 baths - beds |
show details | |

|
#37
Fricks Ln
Rossville, GA 30741
|
1,400 sq. feet
|
1 baths - beds |
show details | |

|
#38
Pine Grove Access Rd
Ringgold, GA 30736
|
720 sq. feet
|
1 baths - beds |
show details | |

|
#39
Cross St
Rossville, GA 30741
|
1,000 sq. feet
|
1 baths - beds |
show details | |

|
#40
Dove Dr
Ringgold, GA 30736
|
1,845 sq. feet
|
2 baths - beds |
show details |
| Photo | Address | Area | Beds / Baths | Price | Details |
|---|---|---|---|---|---|

|
#41
Joyce Ln
Rossville, GA 30741
|
1,080 sq. feet
|
1 baths - beds |
show details | |

|
#42
Teague Cemetery Rd
Whitwell, TN 37397
|
1,420 sq. feet
|
2 baths - beds |
show details | |

|
#43
Lynngrove Dr
Rossville, GA 30741
|
1,334 sq. feet
|
1 baths - beds |
show details | |

|
#44
Flagstone Dr
Rossville, GA 30741
|
1,200 sq. feet
|
2 baths - beds |
show details | |

|
#45
Alvin York Hwy
Whitwell, TN 37397
|
1,032 sq. feet
|
1 baths - beds |
show details | |

|
#46
Windmill Ln
Ringgold, GA 30736
|
1,732 sq. feet
|
1 baths - beds |
show details | |

|
#47
Anchor Dr
Rossville, GA 30741
|
1,428 sq. feet
|
2 baths - beds |
show details | |

|
#48
Castleview Dr
Ringgold, GA 30736
|
1,416 sq. feet
|
2 baths - beds |
show details | |

|
#49
Glenn Wade Dr
Rossville, GA 30741
|
1,452 sq. feet
|
2 baths - beds |
show details | |

|
Check over 1 million property listings on Foreclosure.com!
|
browse all offers | |||


 | waterfront homes? (15 replies) |
| I spy... a Christmas house! (15 replies) |
| question on a light mfg business on a residential lot (18 replies) |
| Northshore?? (4 replies) |
| Coming for a visit NEXT WEEK! (10 replies) |
| The reputation of Chattanooga (23 replies) |
Median year apartment built: 1981
Household type by relationship:
Households: 11,855- Male householders: 2,245 (284 living alone), Female householders: 2,191 (573 living alone)
2,581 spouses (2,568 opposite-sex spouses), 420 unmarried partners, (420 opposite-sex unmarried partners), 3,418 children (2,909 natural, 135 adopted, 373 stepchildren), 156 grandchildren, 149 brothers or sisters, 176 parents, 0 foster children, 228 other relatives, 286 non-relatives
Size of family households: 1,604 2-persons, 783 3-persons, 678 4-persons, 134 5-persons, 59 6-persons, 73 7-or-more-persons.
Size of nonfamily households: 822 1-person, 275 2-persons, 63 3-persons.
1,652 married couples with children.
764 single-parent households (110 men, 654 women).
90.5% of residents of Middle Valley speak English at home.
5.7% of residents speak Spanish at home (84% speak English very well, 7% speak English well, 8% speak English not well).
0.8% of residents speak other Indo-European language at home (50% speak English very well, 35% speak English well, 15% speak English not well).
3.0% of residents speak Asian or Pacific Island language at home (55% speak English very well, 26% speak English not well, 18% don't speak English at all).
Foreign born population: 620 (5.2%)
(66.5% of them are naturalized citizens)
| Here: | 7.2 |
| State: | 6.5 |
| Here: | 5.0 |
| State: | 4.4 |
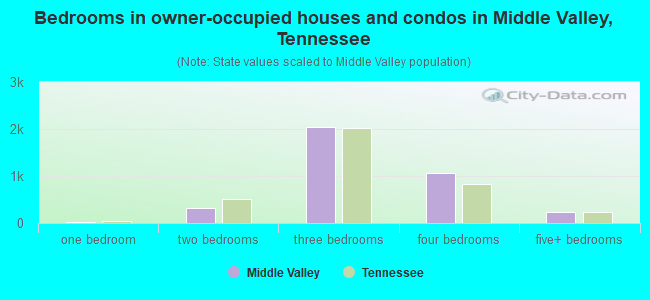
- Bedrooms in owner-occupied houses and condos in Middle Valley, Tennessee
- 0no bedroom
- 201 bedroom
- 3092 bedrooms
- 2,0323 bedrooms
- 1,0644 bedrooms
- 2355+ bedrooms
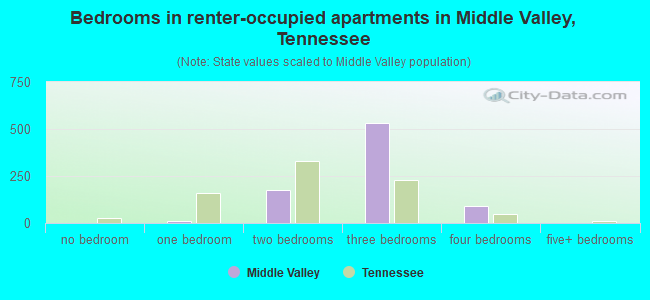
- Bedrooms in renter-occupied apartments in Middle Valley, Tennessee
- 0no bedroom
- 111 bedroom
- 1762 bedrooms
- 5303 bedrooms
- 894 bedrooms
- 05+ bedrooms
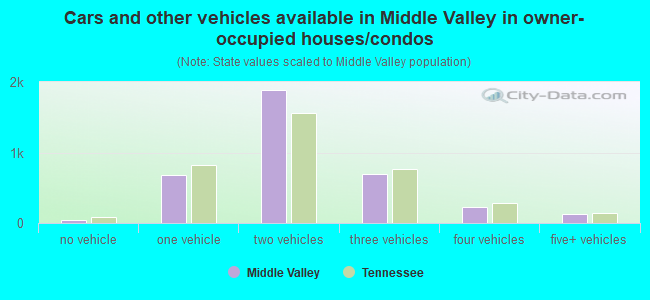
- Cars and other vehicles available in Middle Valley in owner-occupied houses/condos
- 41no vehicle
- 6771 vehicle
- 1,8902 vehicles
- 7023 vehicles
- 2224 vehicles
- 1275+ vehicles
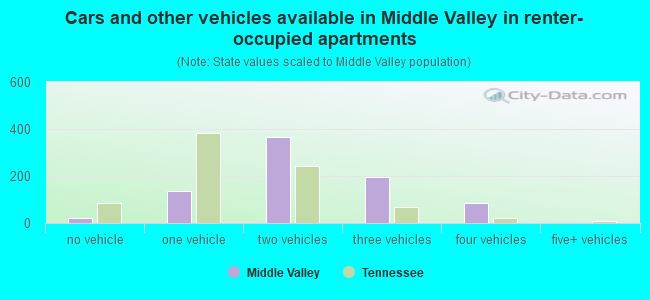
- Cars and other vehicles available in Middle Valley in renter-occupied apartments
- 22no vehicle
- 1361 vehicle
- 3682 vehicles
- 1963 vehicles
- 854 vehicles
- 05+ vehicles
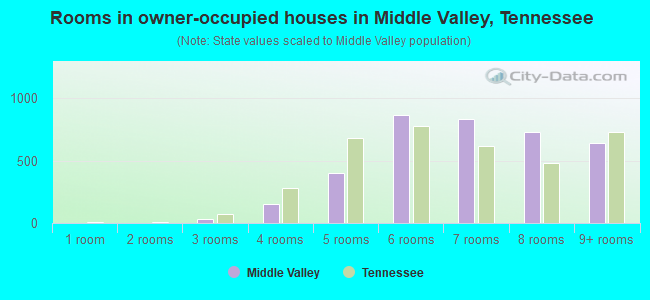
- Rooms in owner-occupied houses in Middle Valley, Tennessee
- 01 room
- 02 rooms
- 293 rooms
- 1554 rooms
- 4045 rooms
- 8656 rooms
- 8357 rooms
- 7318 rooms
- 6409+ rooms
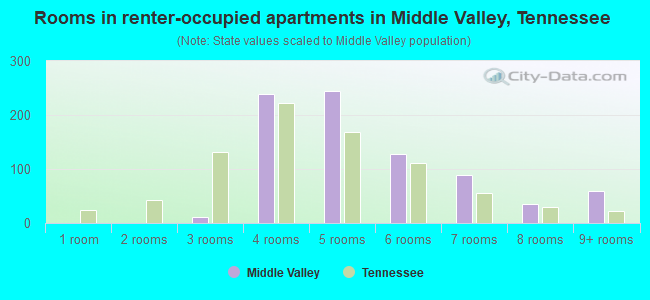
- Rooms in renter-occupied apartments in Middle Valley, Tennessee
- 01 room
- 02 rooms
- 113 rooms
- 2394 rooms
- 2455 rooms
- 1276 rooms
- 897 rooms
- 358 rooms
- 599+ rooms
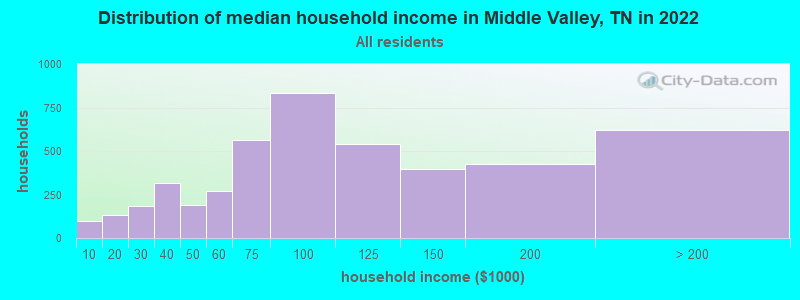
Middle Valley, TN household income distribution

- 95Less than $10,000
- 135$10,000 to $19,999
- 184$20,000 to $29,999
- 317$30,000 to $39,999
- 187$40,000 to $49,999
- 270$50,000 to $59,999
- 566$60,000 to $74,999
- 832$75,000 to $99,999
- 541$100,000 to $124,999
- 399$125,000 to $149,999
- 425$150,000 to $199,999
- 621$200,000 or more
Home value of owner - occupied houses in 2022 in Middle Valley, TN
-
- 22Less than $10,000
- 23$10,000 to $14,999
- 8$15,000 to $19,999
- 11$20,000 to $24,999
- 50$30,000 to $34,999
- 8$90,000 to $99,999
- 151$100,000 to $124,999
- 86$125,000 to $149,999
- 286$150,000 to $174,999
- 288$175,000 to $199,999
- 543$200,000 to $249,999
- 568$250,000 to $299,999
- 905$300,000 to $399,999
- 475$400,000 to $499,999
- 154$500,000 to $749,999
- 72$750,000 to $999,999
Rent paid by renters in 2022 in Middle Valley, TN
-
- 15$250 to $299
- 7$500 to $549
- 18$550 to $599
- 8$600 to $649
- 24$650 to $699
- 28$700 to $749
- 23$750 to $799
- 38$800 to $899
- 132$900 to $999
- 220$1,000 to $1,249
- 18$1,250 to $1,499
- 107$1,500 to $1,999
- 67$2,000 to $2,499
- 106No cash rent
Percentage of workers working in this county: 89.6%
Number of people working at home: 1,153 (18.5% of all workers)
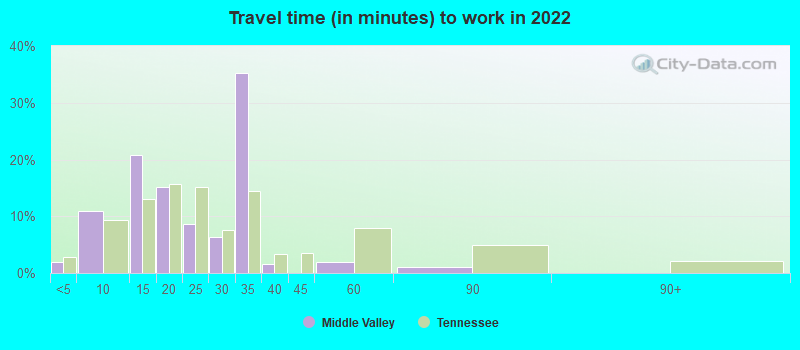
Travel time to work (commute)
- Less than 5 minutes: 17
- 5 to 9 minutes: 460
- 10 to 14 minutes: 296
- 15 to 19 minutes: 756
- 20 to 24 minutes: 951
- 25 to 29 minutes: 631
- 30 to 34 minutes: 1,184
- 35 to 39 minutes: 184
- 40 to 44 minutes: 155
- 45 to 59 minutes: 343
- 60 to 89 minutes: 118
- 90 or more minutes: 44
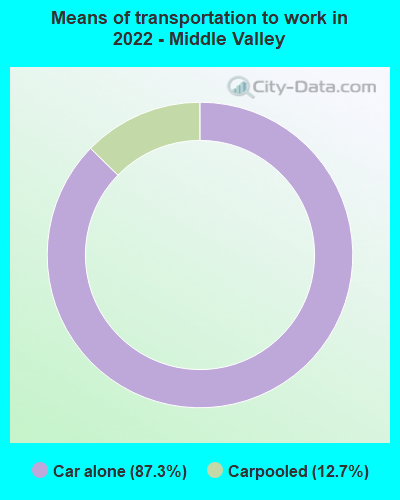
Means of transportation to work:
- Drove a car alone: 816 (45.5%)
- Carpooled: 125 (7.0%)
- Worked at home: 1,153 (64.3%)
- Unemployment by race in 2022
- Unemployment rate for White non-Hispanic residents
- 1.3%Males
- 3.4%Females
- Unemployment rate for Black residents
- 6.4%Males
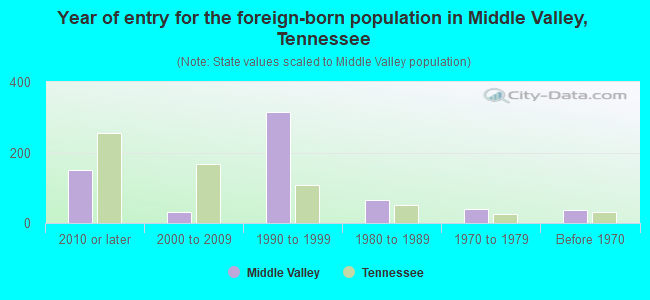
- Year of entry for the foreign-born population in Middle Valley, Tennessee
- 1502010 or later
- 302000 to 2009
- 3151990 to 1999
- 641980 to 1989
- 401970 to 1979
- 36Before 1970
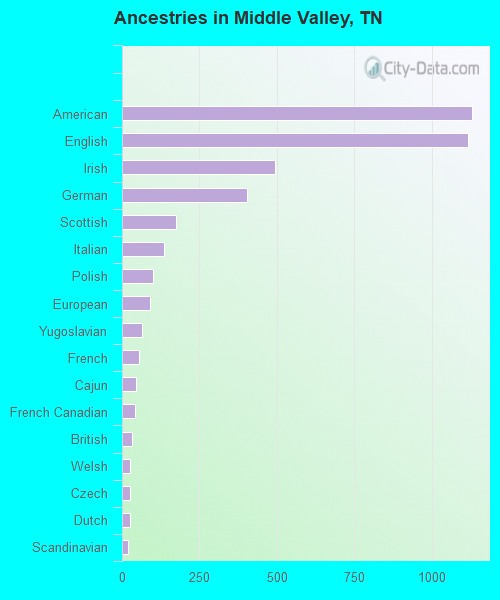
First ancestries reported:
- American: 1,128 (19.9%)
- English: 1,118 (19.7%)
- Irish: 493 (8.7%)
- German: 404 (7.1%)
- Scottish: 175 (3.1%)
- Italian: 137 (2.4%)
- Polish: 101 (1.8%)
- European: 90 (1.6%)
- Yugoslavian: 65 (1.1%)
- French: 54 (1.0%)
- Cajun: 46 (0.8%)
- French Canadian: 41 (0.7%)
- British: 31 (0.5%)
- Welsh: 27 (0.5%)
- Czech: 26 (0.5%)
- Dutch: 25 (0.4%)
- Scandinavian: 19 (0.3%)
- African: 10 (0.2%)
- Norwegian: 9 (0.2%)
- Scotch-Irish: 5 (0.09%)
Most common places of birth for foreign-born residents (%):
| Middle Valley: | 24.8% (166) |
| Tennessee: | 23.0% (86,435) |
| Middle Valley: | 19.0% (127) |
| Tennessee: | 2.3% (8,490) |
| Middle Valley: | 14.3% (96) |
| Tennessee: | 0.6% (2,336) |
| Middle Valley: | 12.2% (82) |
| Tennessee: | 2.4% (8,894) |
| Middle Valley: | 10.1% (68) |
| Tennessee: | 0.2% (698) |
| Middle Valley: | 8.5% (57) |
| Tennessee: | 0.3% (1,183) |
| Middle Valley: | 4.3% (29) |
| Tennessee: | 0.4% (1,632) |
| Middle Valley: | 3.1% (21) |
| Tennessee: | 2.7% (10,295) |
| Middle Valley: | 3.0% (20) |
| Tennessee: | 0.3% (991) |
| Middle Valley: | 1.6% (11) |
| Tennessee: | 2.2% (8,261) |
Place of birth for U.S.-born residents:
- This state: 6,859
- Other state: 4,302
- Northeast: 552
- Midwest: 837
- South: 2,483
- West: 429
89.1% of Middle Valley residents lived in the same house 1 years ago.
Out of people who lived in different houses, 34.2% lived in this county.
Out of people who lived in different counties, 20.6% lived in Tennessee.
| Middle Valley: | 89.1% |
| State average: | 87.0% |
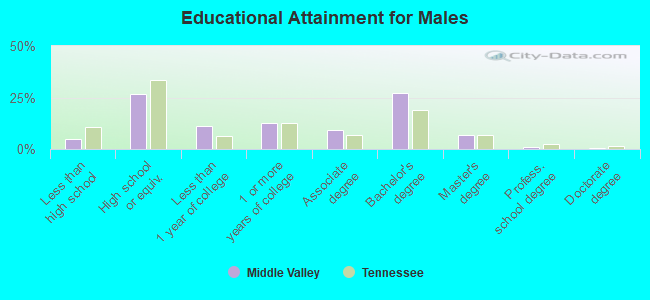
Education attainment for males 25 years and older:
- No schooling: 0
- Nursery to 4th grade: 0
- 5th and 6th grade: 0
- 7th and 8th grade: 14
- 9th grade: 56
- 10th grade: 56
- 11th grade: 50
- 12th grade, no diploma: 22
- High school graduate (or equivalency): 1,071
- Less than 1 year of college: 443
- Some college more than 1 year, no degree: 495
- Associate degree: 364
- Bachelor's degree: 1,095
- Master's degree: 275
- Professional school degree: 41
- Doctorate degree: 15
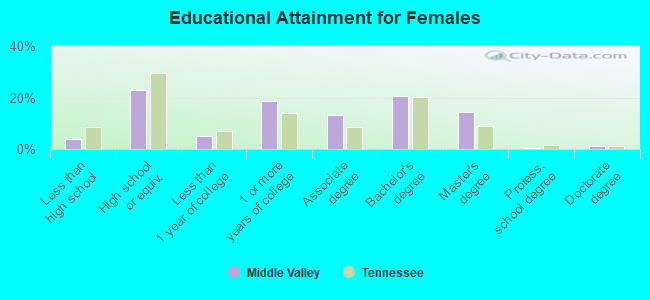
Education attainment for females 25 years and older:
- No schooling: 4
- Nursery to 4th grade: 0
- 5th and 6th grade: 41
- 7th and 8th grade: 0
- 9th grade: 0
- 10th grade: 44
- 11th grade: 59
- 12th grade, no diploma: 25
- High school graduate (or equivalency): 984
- Less than 1 year of college: 216
- Some college more than 1 year, no degree: 810
- Associate degree: 564
- Bachelor's degree: 891
- Master's degree: 618
- Professional school degree: 14
- Doctorate degree: 48
Housing units in structures:
- One, detached: 4,456
- One, attached: 111
- Two: 141
- 5 to 9: 9
- 10 to 19: 18
- 20 to 49: 54
- 50 or more: 13
- Mobile homes: 19
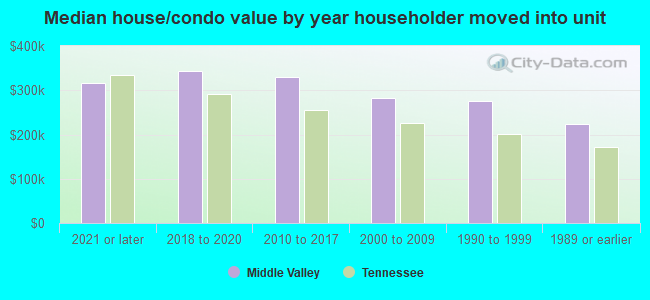
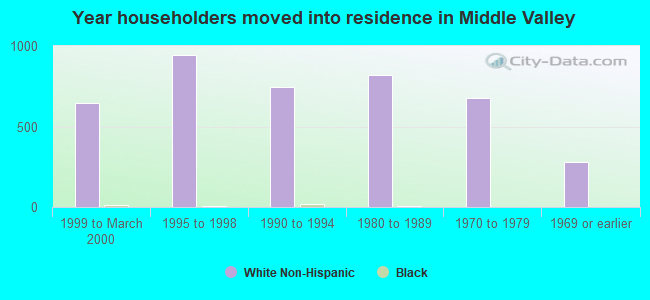
House/condo owner moved in on average 13 years ago
Renter moved in on average 4 years ago
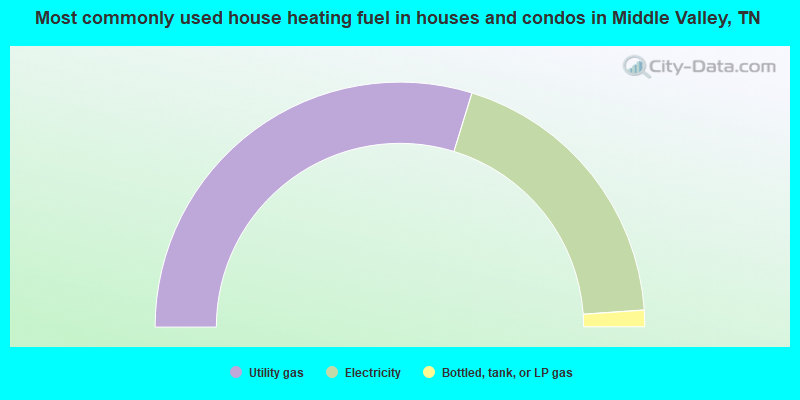
- 59.5%Utility gas
- 38.3%Electricity
- 2.2%Bottled, tank, or LP gas
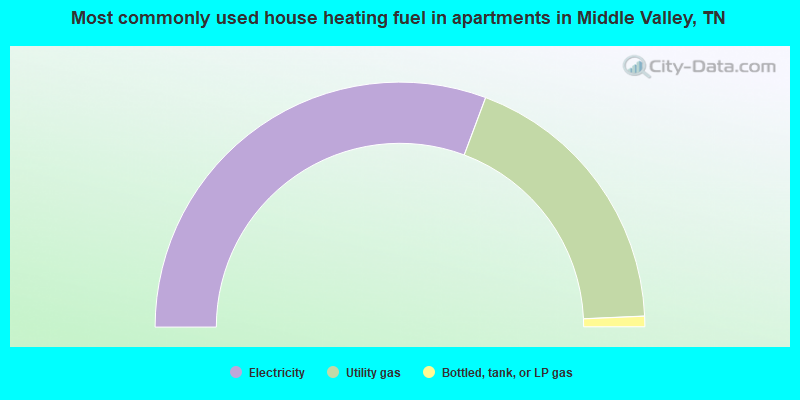
- 61.4%Electricity
- 37.2%Utility gas
- 1.4%Bottled, tank, or LP gas
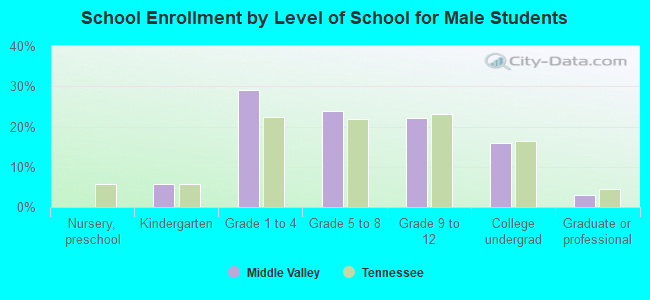
Private vs. public school enrollment:
| Here: | 5.8% |
| Tennessee: | 15.0% |
| Here: | 9.2% |
| Tennessee: | 16.2% |
| Here: | 13.1% |
| Tennessee: | 23.5% |