Housing density: 1,750 houses/condos per square mile
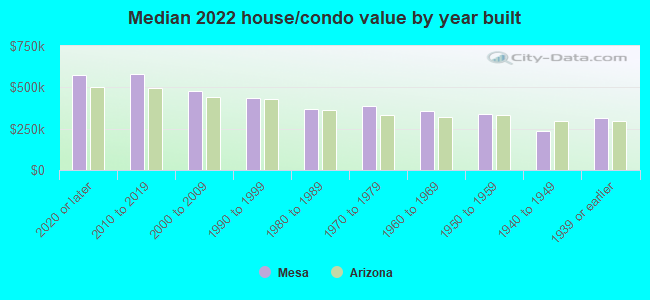
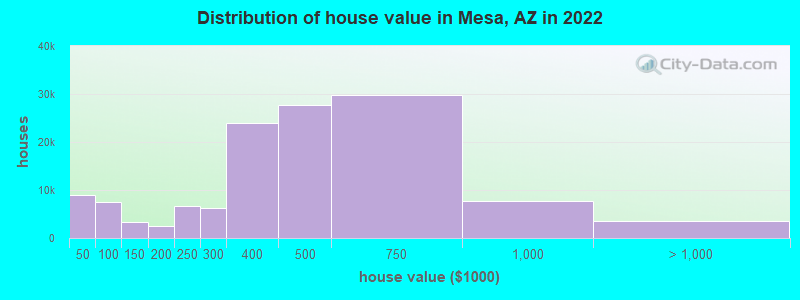
Median price asked for vacant for-sale houses and condos in 2022: $342,286.
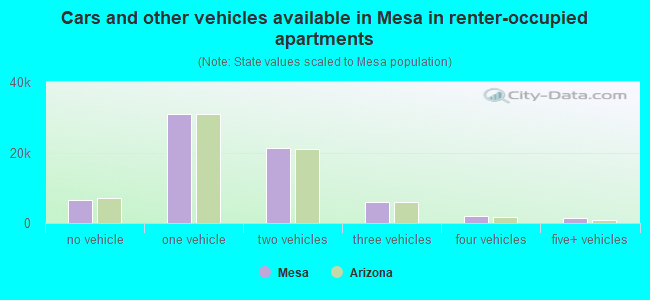
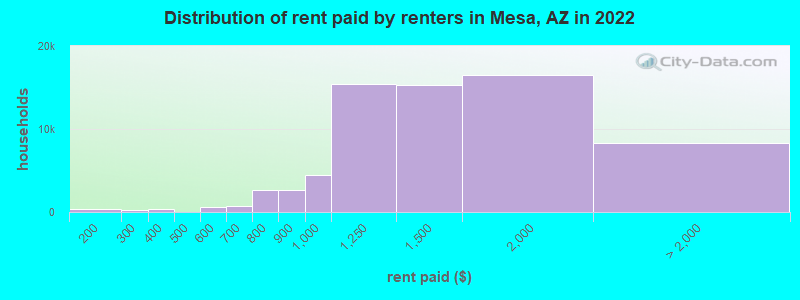
Median contract rent in 2022: $1,334 (lower quartile is $1,069, upper quartile is $1,691)
Median rent asked for vacant for-rent units in 2022: $1,954
Median gross rent in Mesa, AZ in 2022: $1,499
Housing units in Mesa with a mortgage: 80,940 (6,973 second mortgage, 51 home equity loan, 5,773 both second mortgage and home equity loan) Houses without a mortgage: 914
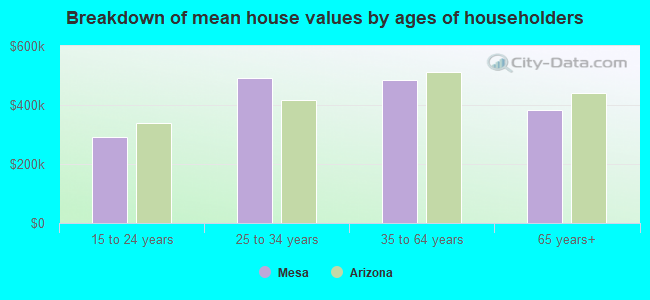
Median household income for houses/condos with a mortgage: $107,903
Median household income for apartments without a mortgage: $65,235
72,536 married couples with children.
33,746 single-parent households (12,415 men, 21,331 women).
79.6% of residents of Mesa speak English at home.
16.8% of residents speak Spanish at home (65% speak English very well, 15% speak English well, 11% speak English not well, 9% don't speak English at all).
1.2% of residents speak other Indo-European language at home (81% speak English very well, 13% speak English well, 5% speak English not well, 1% don't speak English at all).
1.6% of residents speak Asian or Pacific Island language at home (65% speak English very well, 24% speak English well, 9% speak English not well, 2% don't speak English at all).
0.7% of residents speak other language at home (71% speak English very well, 22% speak English well, 6% speak English not well, 2% don't speak English at all).
Foreign born population: 56,384 (11.0%)
(46.8% of them are naturalized citizens)
Percentage of workers working in this county: 97.6% Number of people working at home: 51,956 (20.3% of all workers)
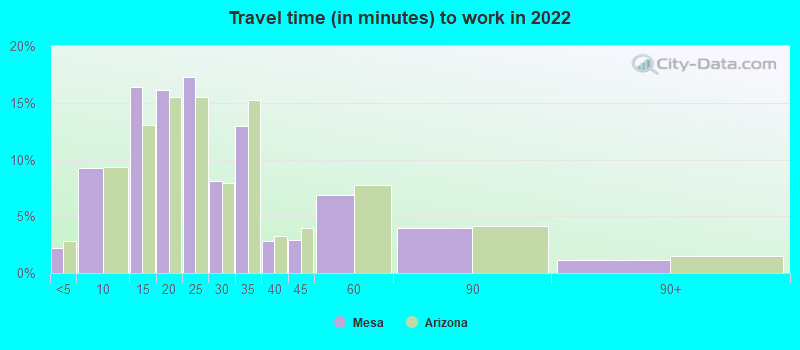
Travel time to work (commute)
Less than 5 minutes: 4,307
5 to 9 minutes: 17,478
10 to 14 minutes: 31,169
15 to 19 minutes: 34,772
20 to 24 minutes: 33,804
25 to 29 minutes: 17,265
30 to 34 minutes: 32,762
35 to 39 minutes: 4,731
40 to 44 minutes: 10,121
45 to 59 minutes: 11,276
60 to 89 minutes: 4,572
90 or more minutes: 1,185
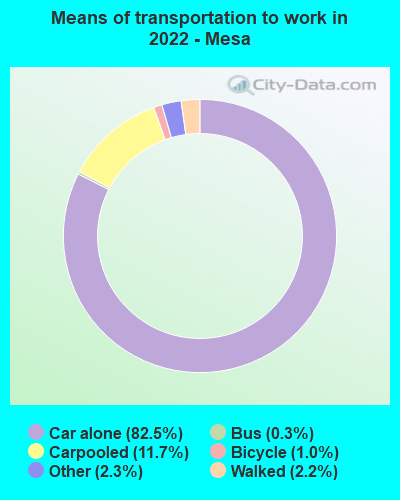
Means of transportation to work:
Drove a car alone: 148,712 (64.1%)
Carpooled: 21,043 (9.1%)
Bus: 556 (0.2%)
Light rail, streetcar or trolley: 56 (0.0%)
Taxi: 4,119 (1.8%)
Bicycle: 1,763 (0.8%)
Walked: 3,927 (1.7%)
Worked at home: 51,956 (22.4%)
Unemployment by race in 2022
Unemployment rate for White non-Hispanic residents
3.1%Males
3.6%Females
Unemployment rate for Black residents
16.6%Males
5.7%Females
Unemployment rate for American Indian and Alaska Native residents
6.6%Males
3.0%Females
Unemployment rate for Asian residents
1.8%Females
Unemployment rate for other race residents
1.6%Males
3.4%Females
Unemployment rate for two or more race residents
1.9%Males
3.9%Females
Unemployment rate for Hispanic or Latino residents
3.2%Males
2.8%Females
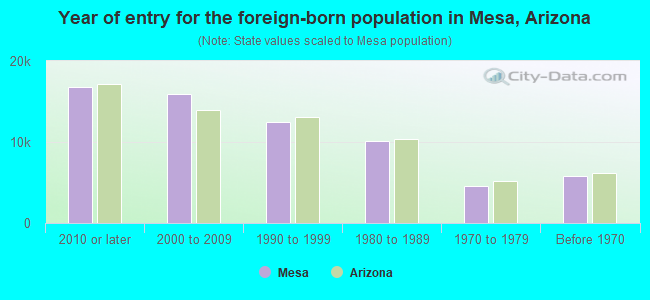
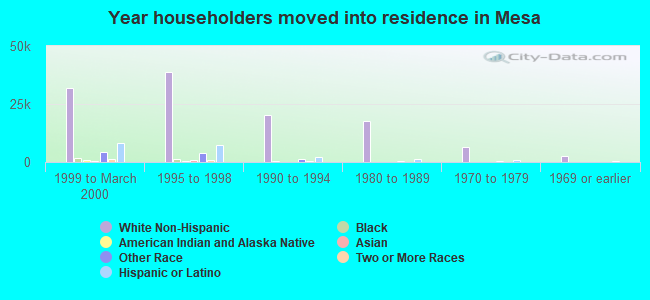
Year of entry for the foreign-born population in Mesa, Arizona
16,8252010 or later
15,9412000 to 2009
12,4831990 to 1999
10,1501980 to 1989
4,6251970 to 1979
5,775Before 1970
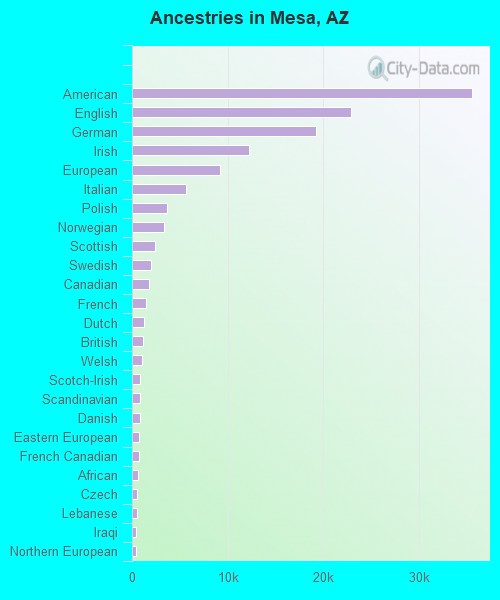
First ancestries reported:
American: 35,543 (13.3%)
English: 22,865 (8.5%)
German: 19,285 (7.2%)
Irish: 12,188 (4.6%)
European: 9,204 (3.4%)
Italian: 5,620 (2.1%)
Polish: 3,662 (1.4%)
Norwegian: 3,386 (1.3%)
Scottish: 2,437 (0.9%)
Swedish: 1,967 (0.7%)
Canadian: 1,735 (0.6%)
French: 1,423 (0.5%)
Dutch: 1,206 (0.5%)
British: 1,113 (0.4%)
Welsh: 1,046 (0.4%)
Scotch-Irish: 866 (0.3%)
Scandinavian: 848 (0.3%)
Danish: 790 (0.3%)
Eastern European: 749 (0.3%)
French Canadian: 702 (0.3%)
African: 596 (0.2%)
Czech: 481 (0.2%)
Lebanese: 478 (0.2%)
Iraqi: 467 (0.2%)
Northern European: 437 (0.2%)
Jamaican: 434 (0.2%)
Russian: 428 (0.2%)
Greek: 381 (0.1%)
Ukrainian: 344 (0.1%)
Finnish: 342 (0.1%)
Brazilian: 340 (0.1%)
Hungarian: 309 (0.1%)
Swiss: 307 (0.1%)
Portuguese: 289 (0.1%)
Nigerian: 267 (0.10%)
Slovak: 243 (0.09%)
Croatian: 216 (0.08%)
Iranian: 187 (0.07%)
Australian: 181 (0.07%)
Serbian: 178 (0.07%)
Lithuanian: 168 (0.06%)
Somali: 165 (0.06%)
Austrian: 144 (0.05%)
Slavic: 140 (0.05%)
Romanian: 136 (0.05%)
Moroccan: 128 (0.05%)
Czechoslovakian: 123 (0.05%)
Pennsylvania German: 111 (0.04%)
Kenyan: 108 (0.04%)
Arab: 91 (0.03%)
Albanian: 86 (0.03%)
Yugoslavian: 86 (0.03%)
Belgian: 85 (0.03%)
Belizean: 83 (0.03%)
Armenian: 76 (0.03%)
Celtic: 69 (0.03%)
Assyrian: 62 (0.02%)
Guyanese: 59 (0.02%)
German Russian: 56 (0.02%)
Sudanese: 52 (0.02%)
Israeli: 50 (0.02%)
Jordanian: 49 (0.02%)
Macedonian: 44 (0.02%)
Trinidadian and Tobagonian: 40 (0.01%)
Slovene: 38 (0.01%)
Cajun: 32 (0.01%)
Basque: 31 (0.01%)
Turkish: 31 (0.01%)
Ethiopian: 28 (0.01%)
West Indian: 22 (0.01%)
Afghan: 21 (0.01%)
Bulgarian: 20 (0.01%)
Egyptian: 19 (0.01%)
U.S. Virgin Islander: 19 (0.01%)
Haitian: 18 (0.01%)
Palestinian: 17 (0.01%)
Bahamian: 16 (0.01%)
Maltese: 15 (0.01%)
Icelander: 14 (0.01%)
Luxembourger: 14 (0.01%)
Sierra Leonean: 14 (0.01%)
Most common places of birth for foreign-born residents (%):
Mexico
Mesa:
53.0% (31,726)
Arizona:
53.4% (500,086)
Canada
Mesa:
8.3% (4,995)
Arizona:
4.3% (40,102)
Philippines
Mesa:
3.4% (2,030)
Arizona:
3.2% (30,378)
Vietnam
Mesa:
2.6% (1,546)
Arizona:
2.1% (19,199)
Guatemala
Mesa:
2.1% (1,266)
Arizona:
1.6% (14,556)
China, excluding Hong Kong and Taiwan
Mesa:
1.9% (1,145)
Arizona:
2.3% (21,275)
Place of birth for U.S.-born residents:
This state: 210,567
Other state: 239,311
Northeast: 27,891
Midwest: 85,370
South: 32,103
West: 93,947
85.0% of Mesa residents lived in the same house 1 years ago. Out of people who lived in different houses, 40.3% lived in this county. Out of people who lived in different counties, 26.5% lived in Arizona.
Mesa:
85.0%
State average:
86.0%
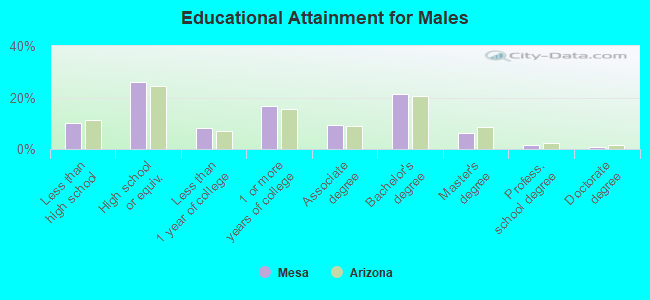
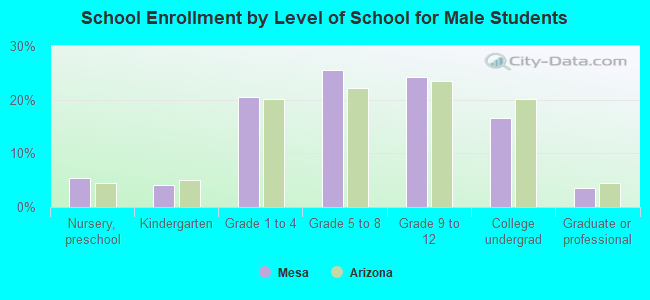
Education attainment for males 25 years and older:
No schooling: 3,157
Nursery to 4th grade: 306
5th and 6th grade: 2,489
7th and 8th grade: 1,816
9th grade: 1,131
10th grade: 1,591
11th grade: 2,329
12th grade, no diploma: 4,191
High school graduate (or equivalency): 43,889
Less than 1 year of college: 14,124
Some college more than 1 year, no degree: 28,555
Associate degree: 15,687
Bachelor's degree: 36,101
Master's degree: 10,763
Professional school degree: 2,413
Doctorate degree: 1,312
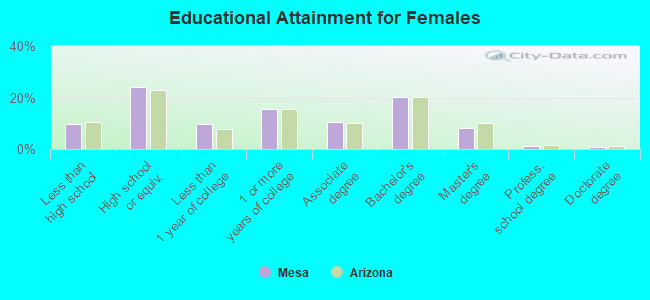
Education attainment for females 25 years and older:
No schooling: 4,590
Nursery to 4th grade: 215
5th and 6th grade: 1,189
7th and 8th grade: 1,974
9th grade: 984
10th grade: 1,640
11th grade: 1,576
12th grade, no diploma: 4,622
High school graduate (or equivalency): 42,002
Less than 1 year of college: 17,014
Some college more than 1 year, no degree: 27,050
Associate degree: 18,446
Bachelor's degree: 35,158
Master's degree: 14,199
Professional school degree: 2,007
Doctorate degree: 1,663
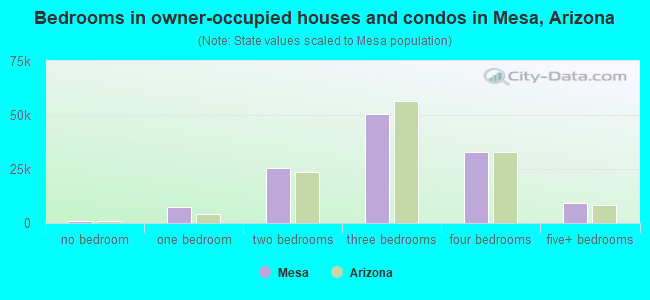
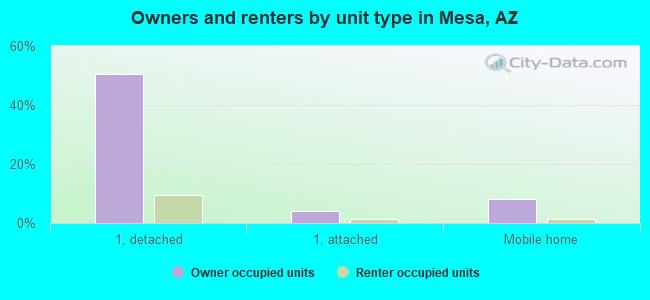
Housing units in structures:
One, detached: 122,452
One, attached: 11,468
Two: 1,888
3 or 4: 10,408
5 to 9: 10,986
10 to 19: 13,297
20 to 49: 6,642
50 or more: 12,780
Mobile homes: 28,072
Boats, RVs, vans, etc.: 785
Median worth of mobile homes: $67,800
Housing units lacking complete plumbing facilities in 2022: 0.3%
Housing units lacking complete kitchen facilities in 2022: 0.5%