Medford, OR (Oregon) Houses and Residents
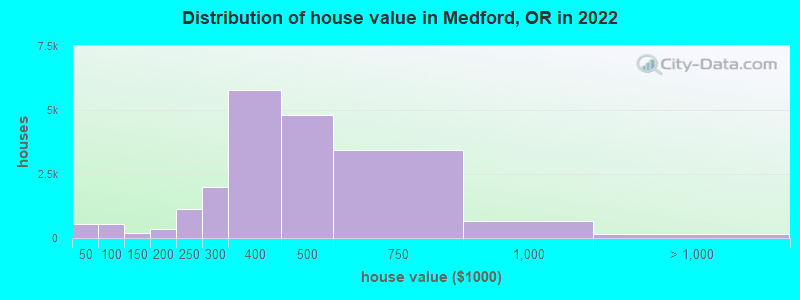
Estimated median house or condo value in 2022: $401,900 (it was $128,500 in 2000 )
Medford:
$401,900Oregon:
$475,600
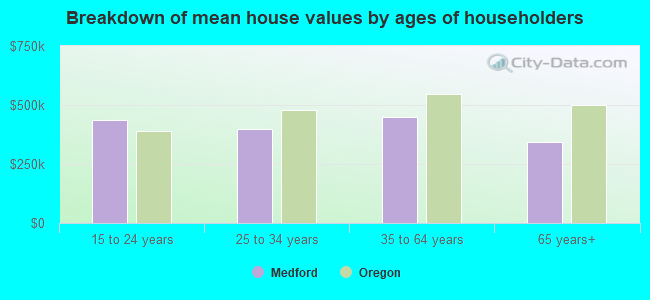
Lower value quartile - upper value quartile: $320,100 - $494,900Mean price in 2022: Detached houses: $437,345 Here:
$437,345State:
$562,872
Townhouses or other attached units: $361,362 Here:
$361,362State:
$463,029
In 2-unit structures: $218,662 Here:
$218,662State:
$505,105
In 3-to-4-unit structures: $371,147 Here:
$371,147State:
$419,673
In 5-or-more-unit structures: $281,052 Here:
$281,052State:
$420,389
Mobile homes: $66,465 Here:
$66,465State:
$214,044
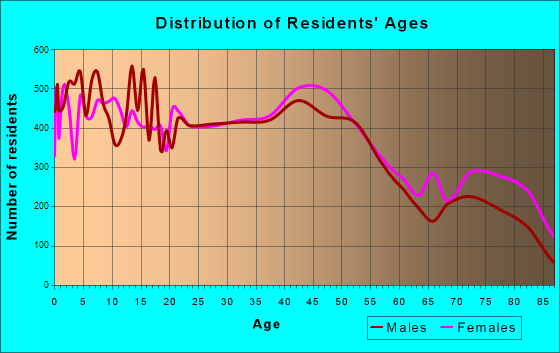
Total population: 78,557 (Urban population: 63,363, Rural population: 73 (all nonfarm) )
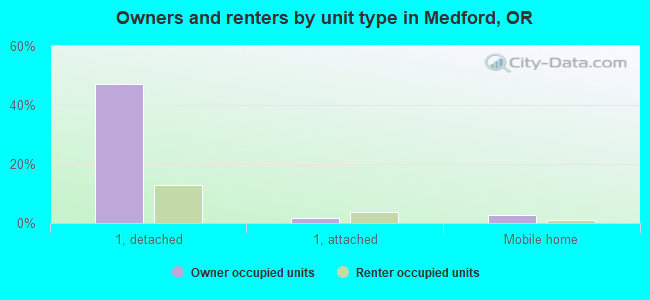
Houses: 38,165 (35,786 occupied: 19,139 owner occupied, 16,647 renter occupied )
% of renters here:
47%State:
37%
Housing density: 1,759 houses/condos per square mile
Median price asked for vacant for-sale houses and condos in 2022: $334,647.
Median contract rent in 2022: $1,129 (lower quartile is $852, upper quartile is $1,446)
Median rent asked for vacant for-rent units in 2022: $4,877
Median gross rent in Medford, OR in 2022: $1,207
Housing units in Medford with a mortgage: 13,326 (1,884 second mortgage, 0 home equity loan, 1,884 both second mortgage and home equity loan )Houses without a mortgage: 138
Median household income for houses/condos with a mortgage: $100,731
Median household income for apartments without a mortgage: $62,157
Median monthly housing costs: $1,283
Data:
Median house or condo value ($)
Median house or condo value ($ change since 2000)
Median house or condo value ($) - White
Median house or condo value ($) - Black or African American
Median house or condo value ($) - Asian
Median house or condo value ($) - Hispanic or Latino
Median house or condo value ($) - American Indian and Alaska Native
Median house or condo value ($) - Multirace
Median house or condo value ($) - Other Race
Median price asked for mobile homes ($)
Household density (households per square mile)
Mean house or condo value by units in structure - 1, detached ($)
Mean house or condo value by units in structure - 1, attached ($)
Mean house or condo value by units in structure - 2 ($)
Mean house or condo value by units in structure by units in structure - 3 or 4 ($)
Mean house or condo value by units in structure - 5 or more ($)
Mean house or condo value by units in structure - Boat, RV, van, etc. ($)
Mean house or condo value by units in structure - Mobile home ($)
Median contract rent ($)
Median contract rent - Lower quartile ($)
Median contract rent - Upper quartile ($)
Median gross rent ($)
Urban houses (%)
Rural houses (%)
Houses occupied (%)
Houses occupied (% change since 2000)
Houses owner occupied (%)
Houses owner occupied (% change since 2000)
Houses renter occupied (%)
Houses renter occupied (% change since 2000)
Vacant housing units - For rent (%)
Vacant housing units - For rent (% change since 2000)
Vacant housing units - For sale only (%)
Vacant housing units - For sale only (% change since 2000)
Vacant housing units - Rented or sold, not occupied (%)
Vacant housing units - Rented or sold, not occupied (% change since 2000)
Vacant housing units - For seasonal, recreational, or occasional use (%)
Vacant housing units - For seasonal, recreational, or occasional use (% change since 2000)
Vacant housing units - For migrant workers (%)
Vacant housing units - For migrant workers (% change since 2000)
Vacant housing units - Other vacant (%)
Vacant housing units - Other vacant (% change since 2000)
Median monthly housing costs ($)
Median household income for houses/condos with a mortgage ($)
Median household income for houses/condos without a mortgage ($)
Median household income ($)
Median household income ($) - White
Median household income ($) - Black or African American
Median household income ($) - Asian
Median household income ($) - Hispanic or Latino
Median household income ($) - American Indian and Alaska Native
Median household income ($) - Multirace
Median household income ($) - Other Race
Mortgage status - with mortgage (%)
Mortgage status - with second mortgage (%)
Mortgage status - with home equity loan (%)
Mortgage status - with both second mortgage and home equity loan (%)
Mortgage status - without a mortgage (%)
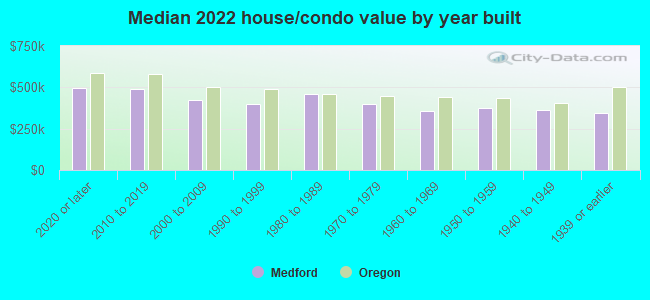
Median year house/condo built
Median year apartment built
Household type by relationship - Male householder living alone (%)
Household type by relationship - Male householder not living alone (%)
Household type by relationship - Female householder living alone (%)
Household type by relationship - Female householder not living alone (%)
Household type by relationship - Opposite-Sex spouse (%)
Household type by relationship - Same-Sex spouse (%)
Household type by relationship - Opposite-Sex unmarried partner (%)
Household type by relationship - Same-Sex unmarried partner (%)
Household type by relationship - In group quarters (%)
Size of family households - 2-person household (%)
Size of family households - 3-person household (%)
Size of family households - 4-person household (%)
Size of family households - 5-person household (%)
Size of family households - 6-person household (%)
Size of family households - 7-or-more-person household (%)
Size of nonfamily households - 1-person household (%)
Size of nonfamily households - 2-person household (%)
Size of nonfamily households - 3-person household (%)
Size of nonfamily households - 4-person household (%)
Size of nonfamily households - 5-person household (%)
Size of nonfamily households - 6-person household (%)
Size of nonfamily households - 7-or-moreperson household (%)
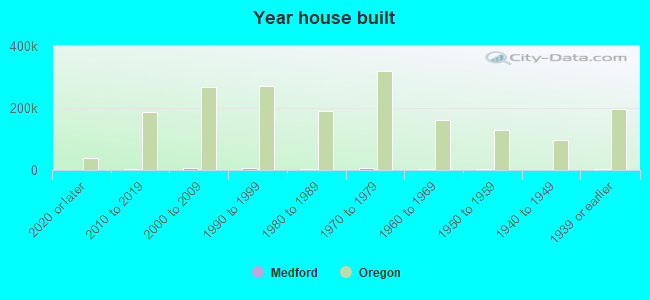
Year house built - Built 2010 or later (%)
Year house built - Built 2000 to 2009 (%)
Year house built - Built 1990 to 1999 (%)
Year house built - Built 1980 to 1989 (%)
Year house built - Built 1970 to 1979 (%)
Year house built - Built 1960 to 1969 (%)
Year house built - Built 1950 to 1959 (%)
Year house built - Built 1940 to 1949 (%)
Year house built - Built 1939 or earlier (%)
Median number of rooms in houses and condos
Median number of rooms in apartments
Median number of bedrooms in owner occupied houses
Mean number of bedrooms in owner occupied houses
Median number of bedrooms in renter occupied houses
Mean number of bedrooms in renter occupied houses
Median number of vehichles in owner occupied houses
Mean number of vehichles in owner occupied houses
Median number of vehichles in renter occupied houses
Mean number of vehichles in renter occupied houses
Rooms in owner-occupied houses - 1 room (%)
Rooms in owner-occupied houses - 2 rooms (%)
Rooms in owner-occupied houses - 3 rooms (%)
Rooms in owner-occupied houses - 4 rooms (%)
Rooms in owner-occupied houses - 5 rooms (%)
Rooms in owner-occupied houses - 6 rooms (%)
Rooms in owner-occupied houses - 7 rooms (%)
Rooms in owner-occupied houses - 8 rooms (%)
Rooms in owner-occupied houses - 9+ rooms (%)
Rooms in renter-occupied houses - 1 room (%)
Rooms in renter-occupied houses - 2 rooms (%)
Rooms in renter-occupied houses - 3 rooms (%)
Rooms in renter-occupied houses - 4 rooms (%)
Rooms in renter-occupied houses - 5 rooms (%)
Rooms in renter-occupied houses - 6 rooms (%)
Rooms in renter-occupied houses - 7 rooms (%)
Rooms in renter-occupied houses - 8 rooms (%)
Rooms in renter-occupied houses - 9+ rooms (%)
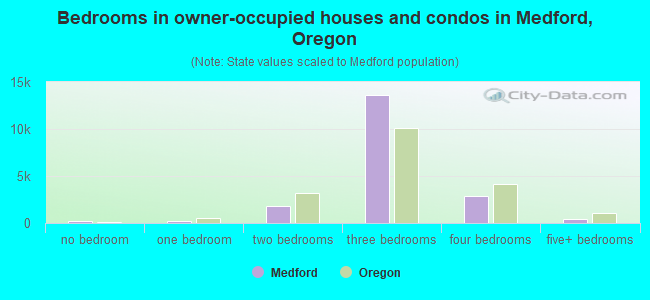
Bedrooms in owner-occupied houses - no bedrooms (%)
Bedrooms in owner-occupied houses - 1 bedroom (%)
Bedrooms in owner-occupied houses - 2 bedrooms (%)
Bedrooms in owner-occupied houses - 3 bedrooms (%)
Bedrooms in owner-occupied houses - 4 bedrooms (%)
Bedrooms in owner-occupied houses - 5+ bedrooms (%)
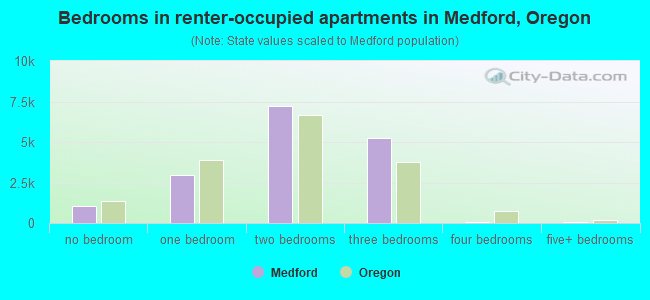
Bedrooms in renter-occupied houses - no bedrooms (%)
Bedrooms in renter-occupied houses - 1 bedroom (%)
Bedrooms in renter-occupied houses - 2 bedrooms (%)
Bedrooms in renter-occupied houses - 3 bedrooms (%)
Bedrooms in renter-occupied houses - 4 bedrooms (%)
Bedrooms in renter-occupied houses - 5+ bedrooms (%)
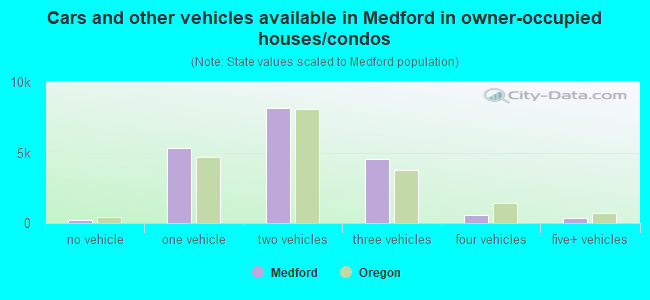
Vehicles available in owner-occupied houses - no vehicle available (%)
Vehicles available in owner-occupied houses - 1 vehicle available(%)
Vehicles available in owner-occupied houses - 2 Vehicles available (%)
Vehicles available in owner-occupied houses - 3 Vehicles available (%)
Vehicles available in owner-occupied houses - 4 Vehicles available (%)
Vehicles available in owner-occupied houses - 5+ Vehicles available (%)
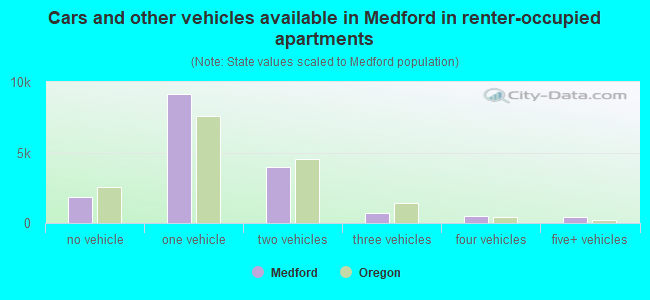
Vehicles available in renter-occupied houses - no vehicle available (%)
Vehicles available in renter-occupied houses - 1 vehicle available (%)
Vehicles available in renter-occupied houses - 2 Vehicles available (%)
Vehicles available in renter-occupied houses - 3 Vehicles available (%)
Vehicles available in renter-occupied houses - 4 Vehicles available (%)
Vehicles available in renter-occupied houses - 5+ Vehicles available (%)
Housing units in structures - 1, detached (%)
Housing units in structures - 1, attached (%)
Housing units in structures - 2 (%)
Housing units in structures - 3 or 4 (%)
Housing units in structures - 5 to 9 (%)
Housing units in structures - 10 to 19 (%)
Housing units in structures - 20 to 49 (%)
Housing units in structures - 50 or more (%)
Housing units in structures - Mobile home (%)
Housing units in structures - Boat, RV, van, etc. (%)
Housing units in structures - Owners - 1, detached (%)
Housing units in structures - Owners - 1, attached (%)
Housing units in structures - Owners - 2 (%)
Housing units in structures - Owners - 3 or 4 (%)
Housing units in structures - Owners - 5 to 9 (%)
Housing units in structures - Owners - 10 to 19 (%)
Housing units in structures - Owners - 20 to 49 (%)
Housing units in structures - Owners - 50 or more (%)
Housing units in structures - Owners - Mobile home (%)
Housing units in structures - Owners - Boat, RV, van, etc. (%)
Housing units in structures - Renters - 1, detached (%)
Housing units in structures - Renters - 1, attached (%)
Housing units in structures - Renters - 2 (%)
Housing units in structures - Renters - 3 or 4 (%)
Housing units in structures - Renters - 5 to 9 (%)
Housing units in structures - Renters - 10 to 19 (%)
Housing units in structures - Renters - 20 to 49 (%)
Housing units in structures - Renters - 50 or more (%)
Housing units in structures - Renters - Mobile home (%)
Housing units in structures - Renters - Boat, RV, van, etc. (%)
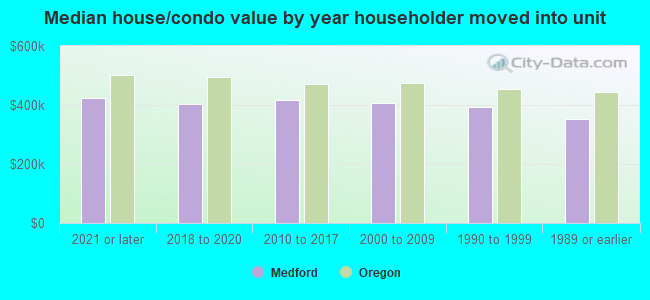
House/condo owner moved in on average (years ago)
Renter moved in on average (years ago)
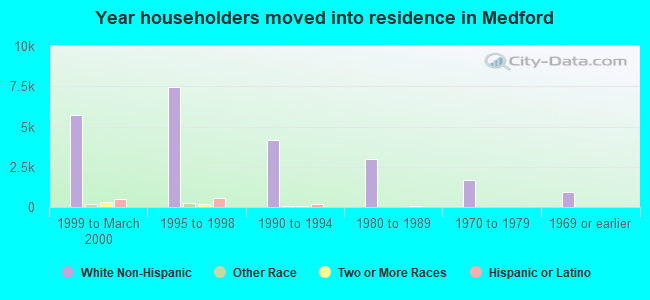
Year householder moved into unit - Moved in 1999 to March 2000 (%)
Year householder moved into unit - Moved in 1999 to March 2000 (%) - White
Year householder moved into unit - Moved in 1999 to March 2000 (%) - Black or African American
Year householder moved into unit - Moved in 1999 to March 2000 (%) - Asian
Year householder moved into unit - Moved in 1999 to March 2000 (%) - Hispanic or Latino
Year householder moved into unit - Moved in 1999 to March 2000 (%) - American Indian and Alaska Native
Year householder moved into unit - Moved in 1999 to March 2000 (%) - Multirace
Year householder moved into unit - Moved in 1999 to March 2000 (%) - Other Race
Year householder moved into unit - Moved in 1995 to 1998 (%)
Year householder moved into unit - Moved in 1995 to 1998 (%) - White
Year householder moved into unit - Moved in 1995 to 1998 (%) - Black or African American
Year householder moved into unit - Moved in 1995 to 1998 (%) - Asian
Year householder moved into unit - Moved in 1995 to 1998 (%) - Hispanic or Latino
Year householder moved into unit - Moved in 1995 to 1998 (%) - American Indian and Alaska Native
Year householder moved into unit - Moved in 1995 to 1998 (%) - Multirace
Year householder moved into unit - Moved in 1995 to 1998 (%) - Other Race
Year householder moved into unit - Moved in 1990 to 1994 (%)
Year householder moved into unit - Moved in 1990 to 1994 (%) - White
Year householder moved into unit - Moved in 1990 to 1994 (%) - Black or African American
Year householder moved into unit - Moved in 1990 to 1994 (%) - Asian
Year householder moved into unit - Moved in 1990 to 1994 (%) - Hispanic or Latino
Year householder moved into unit - Moved in 1990 to 1994 (%) - American Indian and Alaska Native
Year householder moved into unit - Moved in 1990 to 1994 (%) - Multirace
Year householder moved into unit - Moved in 1990 to 1994 (%) - Other Race
Year householder moved into unit - Moved in 1980 to 1989 (%)
Year householder moved into unit - Moved in 1980 to 1989 (%) - White
Year householder moved into unit - Moved in 1980 to 1989 (%) - Black or African American
Year householder moved into unit - Moved in 1980 to 1989 (%) - Asian
Year householder moved into unit - Moved in 1980 to 1989 (%) - Hispanic or Latino
Year householder moved into unit - Moved in 1980 to 1989 (%) - American Indian and Alaska Native
Year householder moved into unit - Moved in 1980 to 1989 (%) - Multirace
Year householder moved into unit - Moved in 1980 to 1989 (%) - Other Race
Year householder moved into unit - Moved in 1970 to 1979 (%)
Year householder moved into unit - Moved in 1970 to 1979 (%) - White
Year householder moved into unit - Moved in 1970 to 1979 (%) - Black or African American
Year householder moved into unit - Moved in 1970 to 1979 (%) - Asian
Year householder moved into unit - Moved in 1970 to 1979 (%) - Hispanic or Latino
Year householder moved into unit - Moved in 1970 to 1979 (%) - American Indian and Alaska Native
Year householder moved into unit - Moved in 1970 to 1979 (%) - Multirace
Year householder moved into unit - Moved in 1970 to 1979 (%) - Other Race
Year householder moved into unit - Moved in 1969 or earlier (%)
Year householder moved into unit - Moved in 1969 or earlier (%) - White
Year householder moved into unit - Moved in 1969 or earlier (%) - Black or African American
Year householder moved into unit - Moved in 1969 or earlier (%) - Asian
Year householder moved into unit - Moved in 1969 or earlier (%) - Hispanic or Latino
Year householder moved into unit - Moved in 1969 or earlier (%) - American Indian and Alaska Native
Year householder moved into unit - Moved in 1969 or earlier (%) - Multirace
Year householder moved into unit - Moved in 1969 or earlier (%) - Other Race
Housing units lacking complete plumbing facilities (%)
Housing units lacking complete kitchen facilities (%)
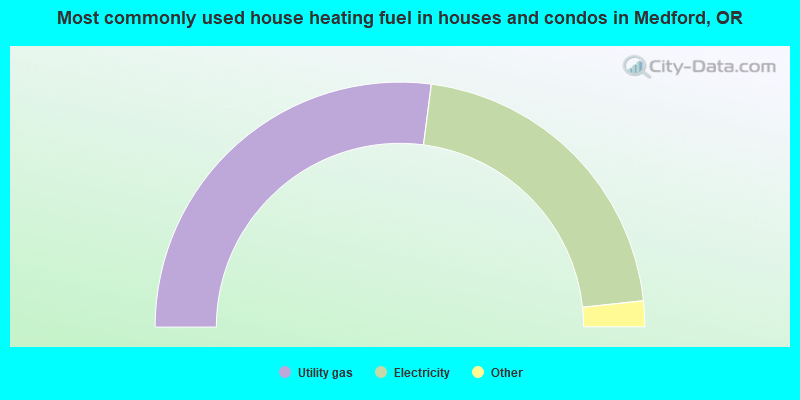
House heating fuel used in houses and condos - Utility gas (%)
House heating fuel used in houses and condos - Bottled, tank, or LP gas (%)
House heating fuel used in houses and condos - Electricity (%)
House heating fuel used in houses and condos - Fuel oil, kerosene, etc. (%)
House heating fuel used in houses and condos - Coal or coke (%)
House heating fuel used in houses and condos - Wood (%)
House heating fuel used in houses and condos - Solar energy (%)
House heating fuel used in houses and condos - Other fuel (%)
House heating fuel used in houses and condos - No fuel used (%)
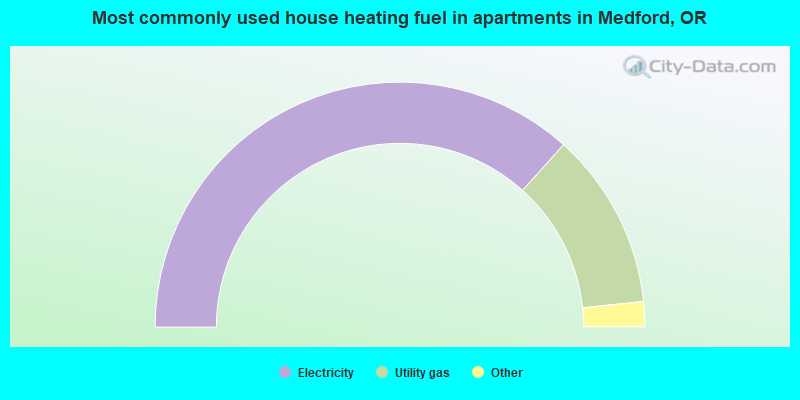
House heating fuel used in apartments - Utility gas (%)
House heating fuel used in apartments - Bottled, tank, or LP gas (%)
House heating fuel used in apartments - Electricity (%)
House heating fuel used in apartments - Fuel oil, kerosene, etc. (%)
House heating fuel used in apartments - Coal or coke (%)
House heating fuel used in apartments - Wood (%)
House heating fuel used in apartments - Solar energy (%)
House heating fuel used in apartments - Other fuel (%)
House heating fuel used in apartments - No fuel used (%)
Latest news about housing in Medford, OR collected exclusively by city-data.com from local newspapers, TV, and radio stations
Median year house/condo built: 1986Median year apartment built: 1980Household type by relationship:
Households: 85,556
Male householders: 15,402 (3,813 living alone ), Female householders: 20,384 (7,096 living alone )16,090 spouses (15,593 opposite-sex spouses ), 2,929 unmarried partners , (2,838 opposite-sex unmarried partners ), 22,423 children (21,084 natural , 708 adopted , 631 stepchildren ), 1,810 grandchildren , 355 brothers or sisters , 544 parents , 0 foster children , 1,405 other relatives , 2,193 non-relatives In group quarters: 2,021
Size of family households: 10,076 2-persons , 5,810 3-persons , 3,735 4-persons , 1,403 5-persons , 407 6-persons , 585 7-or-more-persons .
Size of nonfamily households: 10,909 1-person , 2,467 2-persons , 394 3-persons .
11,494 married couples with children. single-parent households (1,335 men , 4,345 women ).
88.8% of residents of Medford speak English at home. of residents speak Spanish at home (72% speak English very well , 10% speak English well , 11% speak English not well , 7% don't speak English at all ).of residents speak other Indo-European language at home (84% speak English very well , 10% speak English well , 4% speak English not well , 2% don't speak English at all ).of residents speak Asian or Pacific Island language at home (65% speak English very well , 22% speak English well , 6% speak English not well , 7% don't speak English at all ).of residents speak other language at home (88% speak English very well , 12% speak English well ).
Foreign born population: 4,302 (5.0%)of them are naturalized citizens )
Median number of rooms in houses and condos:
Median number of rooms in apartments
Owner-occupied Renter-occupied
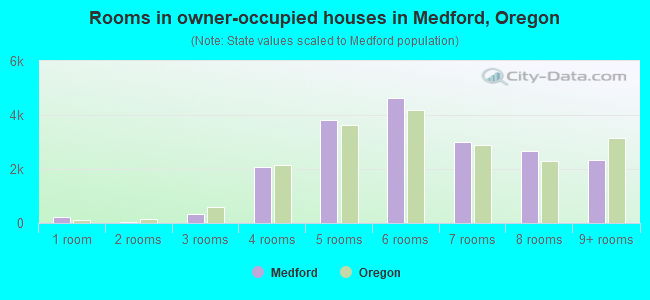
Rooms in owner-occupied houses in Medford, Oregon
229 1 room 41 2 rooms 335 3 rooms 2,077 4 rooms 3,828 5 rooms 4,633 6 rooms 3,016 7 rooms 2,656 8 rooms 2,324 9+ rooms
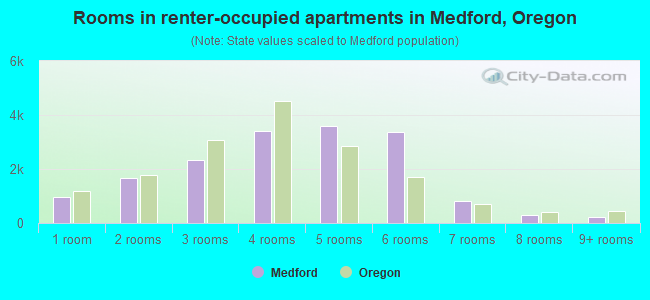
Rooms in renter-occupied apartments in Medford, Oregon
954 1 room 1,654 2 rooms 2,320 3 rooms 3,420 4 rooms 3,605 5 rooms 3,376 6 rooms 803 7 rooms 289 8 rooms 226 9+ rooms
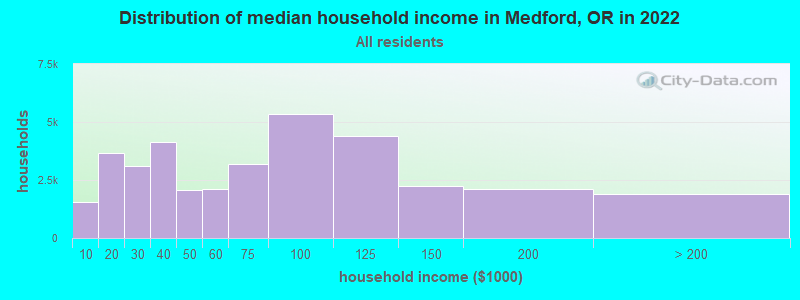
Medford, OR household income distribution 1,540 Less than $10,0003,650 $10,000 to $19,9993,092 $20,000 to $29,9994,137 $30,000 to $39,9992,088 $40,000 to $49,9992,108 $50,000 to $59,9993,179 $60,000 to $74,9995,352 $75,000 to $99,9994,394 $100,000 to $124,9992,245 $125,000 to $149,9992,094 $150,000 to $199,9991,907 $200,000 or more
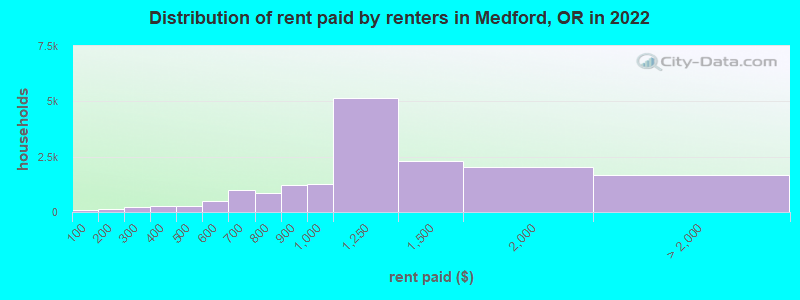
Home value of owner - occupied houses in 2022 in Medford, OR 163 Less than $10,00039 $10,000 to $14,99932 $15,000 to $19,999145 $20,000 to $24,99973 $25,000 to $29,99926 $30,000 to $34,9993 $35,000 to $39,99951 $40,000 to $49,99975 $50,000 to $59,999187 $60,000 to $69,999148 $70,000 to $79,99974 $80,000 to $89,99914 $90,000 to $99,999116 $100,000 to $124,99981 $125,000 to $149,999125 $150,000 to $174,999219 $175,000 to $199,9991,116 $200,000 to $249,9991,988 $250,000 to $299,9995,784 $300,000 to $399,9994,811 $400,000 to $499,9993,423 $500,000 to $749,999645 $750,000 to $999,999110 $1,000,000 to $1,499,99928 $1,500,000 to $1,999,99911 $2,000,000 or moreRent paid by renters in 2022 in Medford, OR 99 Less than $10015 $100 to $149111 $150 to $199186 $200 to $24960 $250 to $299221 $300 to $34934 $350 to $3998 $400 to $449252 $450 to $499313 $500 to $549166 $550 to $599494 $600 to $649481 $650 to $699243 $700 to $749625 $750 to $7991,226 $800 to $8991,253 $900 to $9995,168 $1,000 to $1,2492,299 $1,250 to $1,4992,035 $1,500 to $1,999702 $2,000 to $2,49934 $2,500 to $2,99957 $3,000 to $3,499544 $3,500 or more340 No cash rent
Percentage of workers working in this county: 98.1%Number of people working at home: 3,963 (10.0% of all workers )
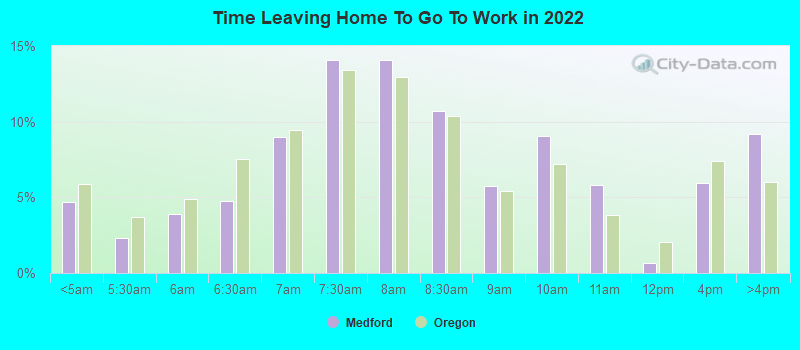
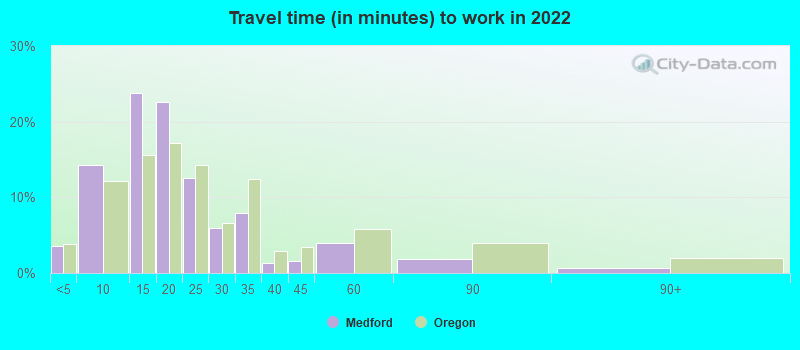
Travel time to work (commute)
Less than 5 minutes: 1,8325 to 9 minutes: 6,13310 to 14 minutes: 10,23015 to 19 minutes: 9,52620 to 24 minutes: 3,44825 to 29 minutes: 1,46230 to 34 minutes: 1,68935 to 39 minutes: 17840 to 44 minutes: 045 to 59 minutes: 35960 to 89 minutes: 76590 or more minutes: 0
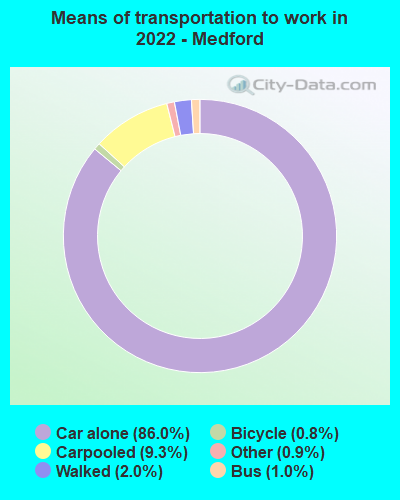
Means of transportation to work:
Drove a car alone: 41,549 (76.4%)Carpooled: 5,965 (11.0%)Bus : 364 (0.7%)Subway or elevated rail : 31 (0.1%)Ferryboat: 27 (0.0%)Taxi: 511 (0.9%)Bicycle: 651 (1.2%)Walked: 1,076 (2.0%)Worked at home: 3,963 (7.3%)
Unemployment by race in 2022
Unemployment rate for White non-Hispanic residents 6.7% Males2.1% FemalesUnemployment rate for American Indian and Alaska Native residents 19.2% MalesUnemployment rate for Asian residents 3.9% Males1.1% FemalesUnemployment rate for other race residents 6.4% Males4.6% FemalesUnemployment rate for two or more race residents 6.7% Males6.1% FemalesUnemployment rate for Hispanic or Latino residents 3.7% Males9.4% Females
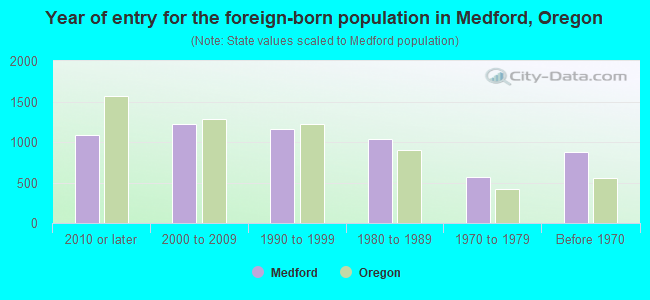
Year of entry for the foreign-born population in Medford, Oregon
1,090 2010 or later 1,226 2000 to 2009 1,157 1990 to 1999 1,036 1980 to 1989 568 1970 to 1979 878 Before 1970
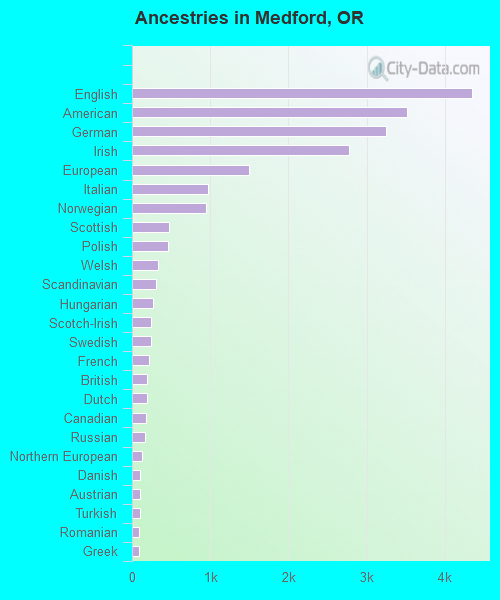
First ancestries reported:
English: 4,347 (12.0%)
American: 3,510 (9.7%)
German: 3,252 (9.0%)
Irish: 2,777 (7.7%)
European: 1,494 (4.1%)
Italian: 975 (2.7%)
Norwegian: 946 (2.6%)
Scottish: 478 (1.3%)
Polish: 456 (1.3%)
Welsh: 338 (0.9%)
Scandinavian: 301 (0.8%)
Hungarian: 264 (0.7%)
Scotch-Irish: 249 (0.7%)
Swedish: 247 (0.7%)
French: 222 (0.6%)
British: 196 (0.5%)
Dutch: 189 (0.5%)
Canadian: 185 (0.5%)
Russian: 170 (0.5%)
Northern European: 125 (0.3%)
Danish: 106 (0.3%)
Austrian: 101 (0.3%)
Turkish: 100 (0.3%)
Romanian: 94 (0.3%)
Greek: 90 (0.2%)
Portuguese: 89 (0.2%)
Croatian: 80 (0.2%)
French Canadian: 68 (0.2%)
Armenian: 68 (0.2%)
Ukrainian: 67 (0.2%)
Swiss: 48 (0.1%)
Czechoslovakian: 48 (0.1%)
Eastern European: 46 (0.1%)
Czech: 44 (0.1%)
German Russian: 42 (0.1%)
Lithuanian: 33 (0.09%)
Cajun: 33 (0.09%)
Afghan: 33 (0.09%)
Nigerian: 33 (0.09%)
Ghanaian: 26 (0.07%)
Brazilian: 24 (0.07%)
Finnish: 23 (0.06%)
Ethiopian: 20 (0.06%)
Basque: 20 (0.06%)
Belgian: 17 (0.05%)
Belizean: 15 (0.04%)
Jordanian: 14 (0.04%)
Slovene: 11 (0.03%)
U.S. Virgin Islander: 11 (0.03%)
Iranian: 10 (0.03%)
Australian: 10 (0.03%)
Jamaican: 10 (0.03%)
African: 6 (0.02%)
Most common places of birth for foreign-born residents (%): Mexico Medford:
51.9% (2,729)Oregon:
33.9% (140,109)
Canada Medford:
5.9% (309)Oregon:
3.7% (15,229)
Philippines Medford:
5.4% (284)Oregon:
3.5% (14,530)
Romania Medford:
2.7% (143)Oregon:
1.0% (4,043)
China, excluding Hong Kong and Taiwan Medford:
2.5% (133)Oregon:
5.2% (21,429)
Germany Medford:
2.5% (130)Oregon:
1.9% (8,005)
England Medford:
2.4% (127)Oregon:
1.5% (6,313)
Honduras Medford:
1.9% (101)Oregon:
0.3% (1,378)
Turkey Medford:
1.7% (87)Oregon:
0.3% (1,287)
El Salvador Medford:
1.5% (80)Oregon:
1.0% (4,175)
Place of birth for U.S.-born residents:
This state: 36,388Other state: 43,460Northeast: 3,287Midwest: 8,399South: 4,398West: 27,376 86.5% of Medford residents lived in the same house 1 years ago.
Out of people who lived in different houses, 37.1% lived in this county.
Out of people who lived in different counties, 35.2% lived in Oregon.
Medford:
86.5%State average:
85.5%
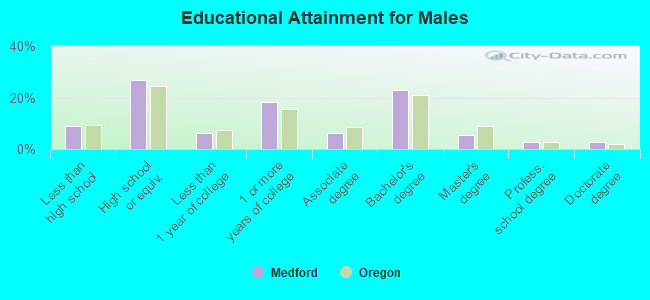
Education attainment for males 25 years and older:
No schooling: 747Nursery to 4th grade: 05th and 6th grade: 07th and 8th grade: 09th grade: 010th grade: 46811th grade: 6712th grade, no diploma: 1,156High school graduate (or equivalency): 7,364Less than 1 year of college: 1,671Some college more than 1 year, no degree: 5,097Associate degree: 1,704Bachelor's degree: 6,343Master's degree: 1,487Professional school degree: 789Doctorate degree: 763
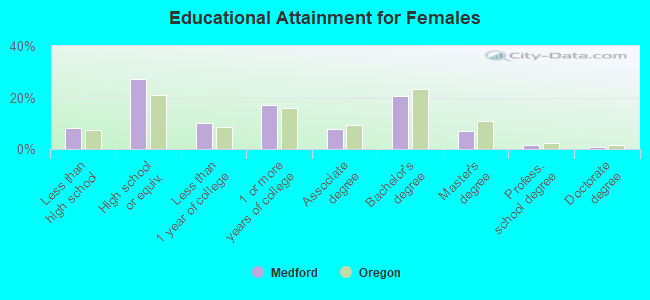
Education attainment for females 25 years and older:
No schooling: 133Nursery to 4th grade: 1965th and 6th grade: 3477th and 8th grade: 4229th grade: 13110th grade: 19111th grade: 58712th grade, no diploma: 584High school graduate (or equivalency): 8,647Less than 1 year of college: 3,174Some college more than 1 year, no degree: 5,479Associate degree: 2,444Bachelor's degree: 6,534Master's degree: 2,239Professional school degree: 507Doctorate degree: 250
Housing units in structures:
One, detached: 23,479One, attached: 1,368Two: 1,0343 or 4: 3,1165 to 9: 2,51310 to 19: 1,01720 to 49: 99650 or more: 3,659Mobile homes: 983Median worth of mobile homes: $60,300
Housing units lacking complete plumbing facilities in 2022: 0.1%Housing units lacking complete kitchen facilities in 2022: 2.1%House/condo owner moved in on average 7 years ago
Renter moved in on average 4 years ago
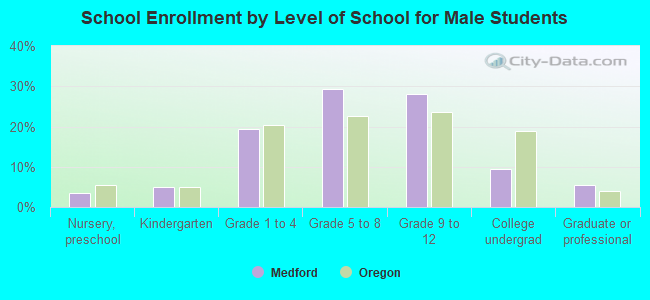
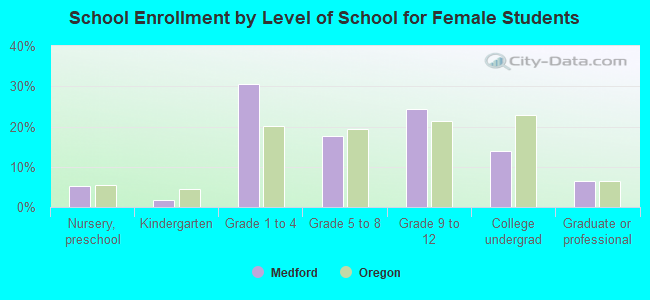
Private vs. public school enrollment:
Students in private schools in grades 1 to 8 (elementary and middle school): 948 Students in private schools in grades 9 to 12 (high school): 358 Students in private undergraduate colleges: 214