Marlborough, MA (Massachusetts) Houses and Residents
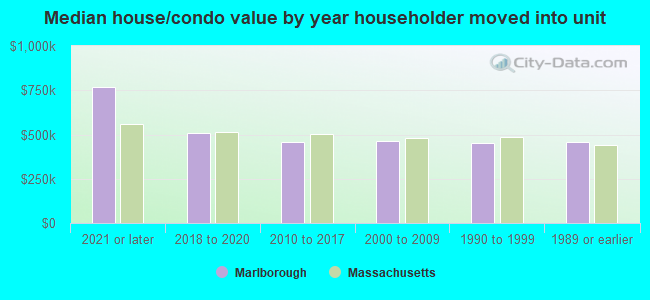
| Marlborough: | $464,123 |
| Massachusetts: | $534,700 |
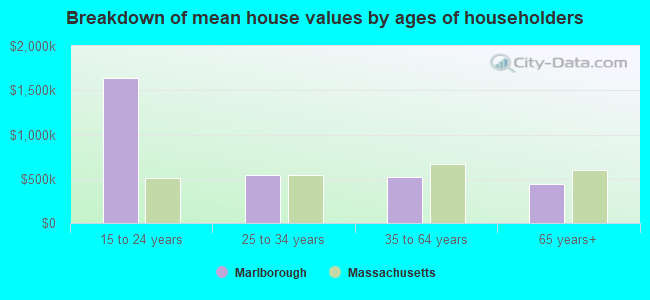
Mean price in 2022:
Detached houses: $514,011
Here: $514,011 State: $651,570 Townhouses or other attached units: $426,947
Here: $426,947 State: $617,749 In 2-unit structures: $469,508
Here: $469,508 State: $594,808 In 3-to-4-unit structures: $305,828
Here: $305,828 State: $601,912 In 5-or-more-unit structures: $285,334
Here: $285,334 State: $555,768 Mobile homes: $54,431
Here: $54,431 State: $170,209
Total population: 39,612 (Urban population: 35,601, Rural population: 654 (all nonfarm))
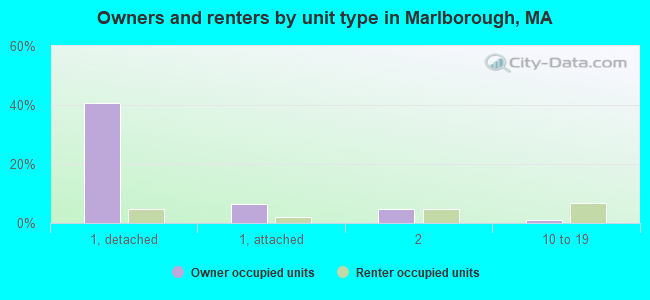
Houses: 17,664 (16,760 occupied: 9,603 owner occupied, 7,142 renter occupied)
| % of renters here: | 43% |
| State: | 38% |
Housing density: 838 houses/condos per square mile
Median price asked for vacant for-sale houses and condos in 2022: $2,766,893.
Median contract rent in 2022: $1,476 (lower quartile is $1,049, upper quartile is $1,923)
Median rent asked for vacant for-rent units in 2022: $2,028
Median gross rent in Marlborough, MA in 2022: $1,642
Housing units in Marlborough with a mortgage: 6,162 (852 second mortgage, 16 home equity loan, 643 both second mortgage and home equity loan)
Houses without a mortgage: 183
Median household income for houses/condos with a mortgage: $125,520
Median household income for apartments without a mortgage: $84,978
Median monthly housing costs: $1,776
Compare current foreclosures near Marlborough, MA:
| Photo | Address | Area | Beds / Baths | Price | Details |
|---|---|---|---|---|---|

|
#1
Greendale Ave
Marlborough, MA 01752
|
2,200 sq. feet
|
3 baths 5 beds |
show details | |

|
#2
Bruce Rd
Marlborough, MA 01752
|
864 sq. feet
|
1 baths 2 beds |
show details | |

|
#3
Sudbury St
Marlborough, MA 01752
|
2,048 sq. feet
|
2 baths 4 beds |
show details | |

|
#4
Dow Pl
Marlborough, MA 01752
|
1,236 sq. feet
|
1 baths 3 beds |
show details | |

|
#5
Karopulios Dr
Marlborough, MA 01752
|
1,540 sq. feet
|
2 baths 2 beds |
show details | |

|
#6
Country Ln
Marlborough, MA 01752
|
2,352 sq. feet
|
4 baths 3 beds |
show details | |

|
#7
Berlin Rd
Marlborough, MA 01752
|
1,603 sq. feet
|
2 baths 3 beds |
show details | |

|
#8
Danjou Dr
Marlborough, MA 01752
|
1,753 sq. feet
|
2 baths 4 beds |
show details | |

|
#9
Concord Rd
Marlborough, MA 01752
|
3,008 sq. feet
|
3 baths 4 beds |
show details | |

|
#10
Azalea Ln
Marlborough, MA 01752
|
1,359 sq. feet
|
2 baths 2 beds |
show details |
| Photo | Address | Area | Beds / Baths | Price | Details |
|---|---|---|---|---|---|

|
#11
Sunshine Dr
Marlborough, MA 01752
|
1,121 sq. feet
|
1 baths 3 beds |
show details | |

|
#12
Country Ln
Marlborough, MA 01752
|
3,414 sq. feet
|
3 baths 6 beds |
show details | |

|
#13
Pleasant St
Marlborough, MA 01752
|
1,372 sq. feet
|
1 baths 3 beds |
show details | |

|
#14
Huntington Ave
Marlborough, MA 01752
|
2,018 sq. feet
|
3 baths 5 beds |
show details | |

|
#15
Ridge Rd
Marlborough, MA 01752
|
1,409 sq. feet
|
1 baths 3 beds |
show details | |

|
#16
Liberty St
Marlborough, MA 01752
|
3,170 sq. feet
|
2 baths 4 beds |
show details | |

|
#17
Stow Rd
Marlborough, MA 01752
|
3,660 sq. feet
|
2 baths 4 beds |
show details | |

|
#18
Brimsmead St
Marlborough, MA 01752
|
1,588 sq. feet
|
1 baths 3 beds |
show details | |

|
#19
Howe St
Marlborough, MA 01752
|
1,132 sq. feet
|
1 baths 3 beds |
show details | |

|
#20
Pioneer Trl
Marlborough, MA 01752
|
1,359 sq. feet
|
2 baths 2 beds |
show details |
| Photo | Address | Area | Beds / Baths | Price | Details |
|---|---|---|---|---|---|

|
#21
Dow Pl
Marlborough, MA 01752
|
1,236 sq. feet
|
1 baths 3 beds |
show details | |

|
#22
Violetwood Cir
Marlborough, MA 01752
|
1,784 sq. feet
|
2 baths 3 beds |
show details | |

|
#23
Elm St Apt 7
Marlborough, MA 01752
|
- sq. feet
|
- baths - beds |
show details | |

|
#24
Mayflower Cir
Marlborough, MA 01752
|
- sq. feet
|
- baths - beds |
show details | |

|
#25
Cedar Hill St Ste 3
Marlborough, MA 01752
|
- sq. feet
|
- baths - beds |
show details | |

|
#26
Lincoln St # 311
Marlborough, MA 01752
|
- sq. feet
|
- baths - beds |
show details | |

|
#27
Brigham St Unit 8
Marlborough, MA 01752
|
- sq. feet
|
- baths - beds |
show details | |

|
#28
Saint Martin Dr # 3
Marlborough, MA 01752
|
- sq. feet
|
- baths - beds |
show details | |

|
#29
Stillman St
Framingham, MA 01702
|
1,122 sq. feet
|
1 baths 2 beds |
$418,000
|
show details |

|
#30
Sylvan Ave
Leominster, MA 01453
|
720 sq. feet
|
1 baths 2 beds |
$375,000
|
show details |
| Photo | Address | Area | Beds / Baths | Price | Details |
|---|---|---|---|---|---|

|
#31
Graham St
Leominster, MA 01453
|
1,036 sq. feet
|
1 baths 3 beds |
$485,000
|
show details |

|
#32
Great Rd
Shirley, MA 01464
|
1,672 sq. feet
|
1 baths 2 beds |
$464,900
|
show details |

|
#33
Nome St
Worcester, MA 01605
|
960 sq. feet
|
1 baths 4 beds |
$208,000
|
show details |

|
#34
Grove Ave
Leominster, MA 01453
|
3,097 sq. feet
|
1 baths 4 beds |
show details | |

|
#35
Great Rd
Stow, MA 01775
|
2,026 sq. feet
|
2 baths 3 beds |
show details | |

|
#36
Goodnow Ln
Framingham, MA 01702
|
2,342 sq. feet
|
2 baths 4 beds |
show details | |

|
#37
Gilbert Rd
Needham, MA 02492
|
1,778 sq. feet
|
2 baths 3 beds |
show details | |

|
#38
Hawkins St
Worcester, MA 01604
|
864 sq. feet
|
1 baths 3 beds |
show details | |

|
#39
Sugar Rd
Bolton, MA 01740
|
1,988 sq. feet
|
2 baths 3 beds |
show details | |

|
#40
Everett Cir
Hopkinton, MA 01748
|
5,180 sq. feet
|
3 baths 4 beds |
show details |
| Photo | Address | Area | Beds / Baths | Price | Details |
|---|---|---|---|---|---|

|
#41
Pond St
Franklin, MA 02038
|
1,100 sq. feet
|
1 baths 3 beds |
show details | |

|
#42
Grv St
Needham, MA 02492
|
6,542 sq. feet
|
4 baths 6 beds |
show details | |

|
#43
Pocasset Ave
Worcester, MA 01606
|
2,090 sq. feet
|
3 baths 3 beds |
show details | |

|
#44
Beacon St
Worcester, MA 01610
|
2,869 sq. feet
|
3 baths 8 beds |
show details | |

|
#45
Sidney Rd
Milford, MA 01757
|
1,184 sq. feet
|
1 baths 4 beds |
show details | |

|
#46
Riverlin St
Millbury, MA 01527
|
1,162 sq. feet
|
2 baths 2 beds |
show details | |

|
#47
Marion Ave
Millbury, MA 01527
|
852 sq. feet
|
1 baths 2 beds |
show details | |

|
#48
Raymond Ave
Northbridge, MA 01534
|
1,092 sq. feet
|
1 baths 3 beds |
show details | |

|
#49
Bedford Ln
Lincoln, MA 01773
|
2,372 sq. feet
|
2 baths 4 beds |
show details | |

|
Check over 1 million property listings on Foreclosure.com!
|
browse all offers | |||

Latest news about housing in Marlborough, MA collected exclusively by city-data.com from local newspapers, TV, and radio stations

 | Parents buying houses for kids (207 replies) |
| How Much Massachusetts Households Make Per Year: Census Data (37 replies) |
| 2023 Real Estate Observations (5278 replies) |
| Home Prices By Town for 2022 (190 replies) |
| 2021 Real Estate Observations (1729 replies) |
| What Are the Cheapest and Most Expensive Single Family Home For Sale In Your Town? (50 replies) |
Median year apartment built: 1972
Household type by relationship:
Households: 41,237- Male householders: 8,188 (2,345 living alone), Female householders: 8,274 (2,551 living alone)
7,698 spouses (7,666 opposite-sex spouses), 1,229 unmarried partners, (1,131 opposite-sex unmarried partners), 11,051 children (10,097 natural, 191 adopted, 763 stepchildren), 927 grandchildren, 668 brothers or sisters, 484 parents, 0 foster children, 1,131 other relatives, 982 non-relatives
- In group quarters: 600
Size of family households: 4,210 2-persons, 2,389 3-persons, 2,258 4-persons, 659 5-persons, 376 6-persons, 352 7-or-more-persons.
Size of nonfamily households: 5,104 1-person, 1,469 2-persons, 23 3-persons, 42 4-persons.
5,701 married couples with children.
1,463 single-parent households (347 men, 1,116 women).
60.1% of residents of Marlborough speak English at home.
14.8% of residents speak Spanish at home (53% speak English very well, 12% speak English well, 20% speak English not well, 15% don't speak English at all).
22.6% of residents speak other Indo-European language at home (54% speak English very well, 23% speak English well, 15% speak English not well, 8% don't speak English at all).
2.0% of residents speak Asian or Pacific Island language at home (67% speak English very well, 29% speak English well, 4% speak English not well).
1.2% of residents speak other language at home (44% speak English very well, 23% speak English well, 33% speak English not well).
Foreign born population: 12,471 (30.2%)
(42.5% of them are naturalized citizens)
| Here: | 6.8 |
| State: | 6.5 |
| Here: | 3.8 |
| State: | 4.0 |
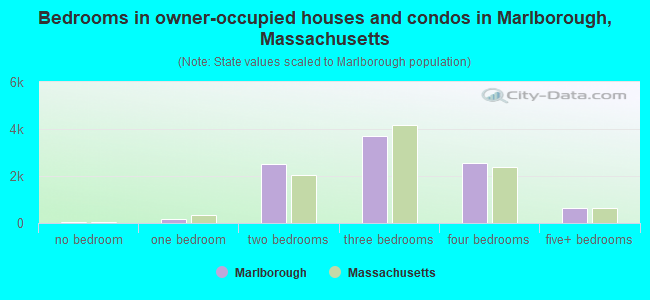
- Bedrooms in owner-occupied houses and condos in Marlborough, Massachusetts
- 43no bedroom
- 1541 bedroom
- 2,5212 bedrooms
- 3,7193 bedrooms
- 2,5364 bedrooms
- 6305+ bedrooms
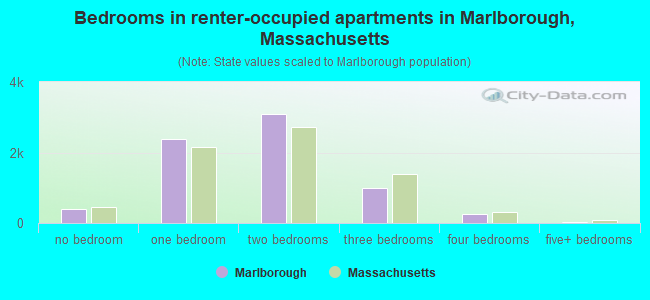
- Bedrooms in renter-occupied apartments in Marlborough, Massachusetts
- 385no bedroom
- 2,3921 bedroom
- 3,0972 bedrooms
- 9923 bedrooms
- 2474 bedrooms
- 295+ bedrooms
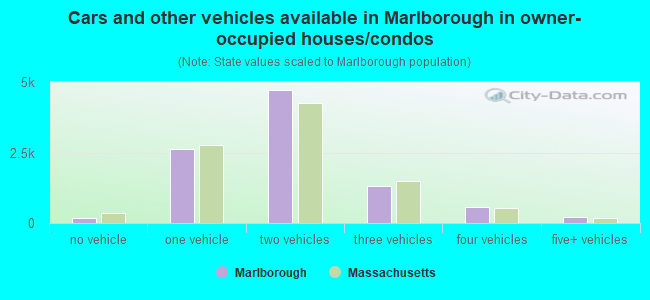
- Cars and other vehicles available in Marlborough in owner-occupied houses/condos
- 184no vehicle
- 2,6131 vehicle
- 4,7232 vehicles
- 1,3023 vehicles
- 5504 vehicles
- 2305+ vehicles
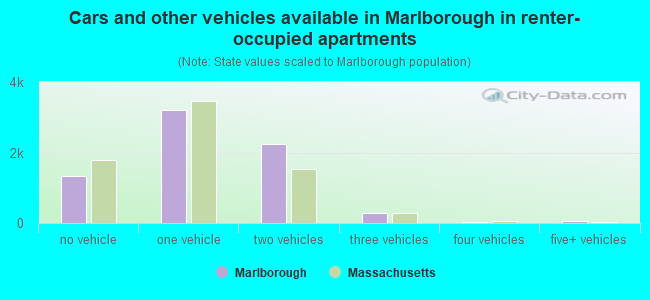
- Cars and other vehicles available in Marlborough in renter-occupied apartments
- 1,326no vehicle
- 3,2021 vehicle
- 2,2462 vehicles
- 2853 vehicles
- 424 vehicles
- 435+ vehicles
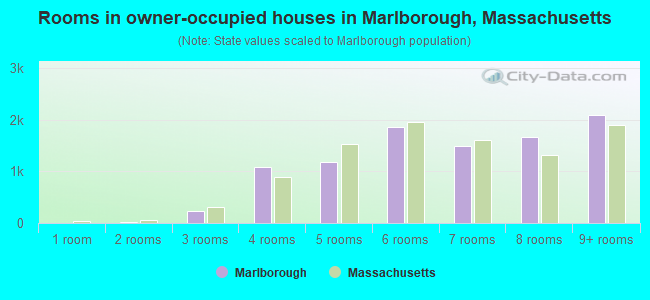
- Rooms in owner-occupied houses in Marlborough, Massachusetts
- 01 room
- 272 rooms
- 2313 rooms
- 1,0774 rooms
- 1,1825 rooms
- 1,8516 rooms
- 1,4927 rooms
- 1,6548 rooms
- 2,0899+ rooms
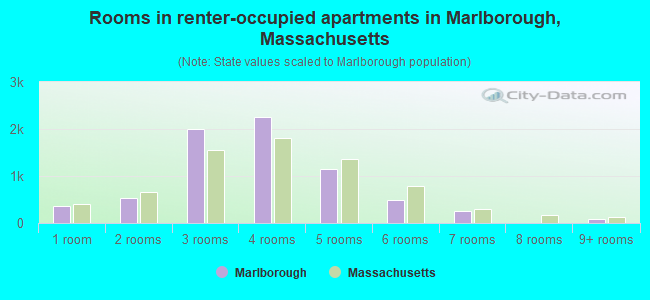
- Rooms in renter-occupied apartments in Marlborough, Massachusetts
- 3621 room
- 5362 rooms
- 2,0043 rooms
- 2,2554 rooms
- 1,1535 rooms
- 4986 rooms
- 2457 rooms
- 78 rooms
- 839+ rooms
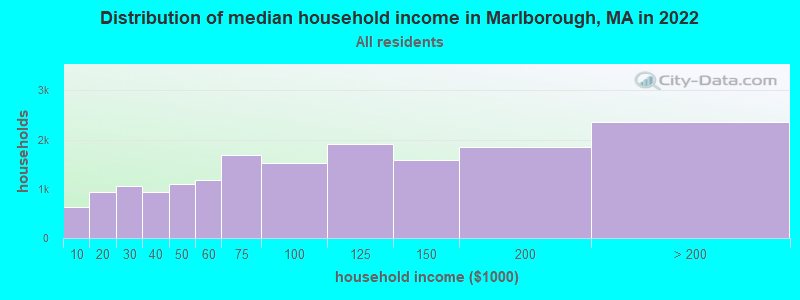
Marlborough, MA household income distribution

- 633Less than $10,000
- 938$10,000 to $19,999
- 1,064$20,000 to $29,999
- 927$30,000 to $39,999
- 1,096$40,000 to $49,999
- 1,174$50,000 to $59,999
- 1,691$60,000 to $74,999
- 1,533$75,000 to $99,999
- 1,910$100,000 to $124,999
- 1,578$125,000 to $149,999
- 1,856$150,000 to $199,999
- 2,357$200,000 or more
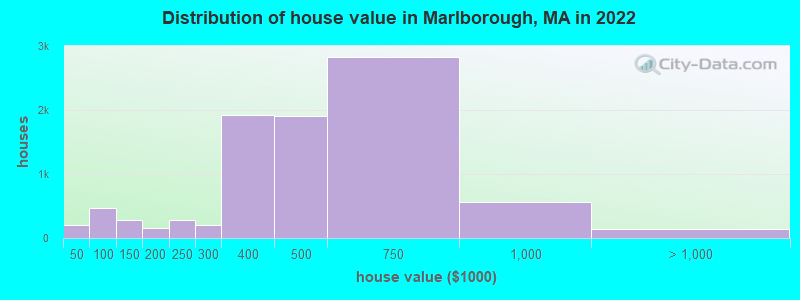
Home value of owner - occupied houses in 2022 in Marlborough, MA
-
- 16Less than $10,000
- 13$15,000 to $19,999
- 17$20,000 to $24,999
- 28$30,000 to $34,999
- 6$35,000 to $39,999
- 119$40,000 to $49,999
- 55$50,000 to $59,999
- 27$60,000 to $69,999
- 79$70,000 to $79,999
- 113$80,000 to $89,999
- 76$90,000 to $99,999
- 254$100,000 to $124,999
- 33$125,000 to $149,999
- 73$150,000 to $174,999
- 85$175,000 to $199,999
- 280$200,000 to $249,999
- 201$250,000 to $299,999
- 1,923$300,000 to $399,999
- 1,905$400,000 to $499,999
- 2,827$500,000 to $749,999
- 555$750,000 to $999,999
- 58$1,000,000 to $1,499,999
- 43$1,500,000 to $1,999,999
- 35$2,000,000 or more
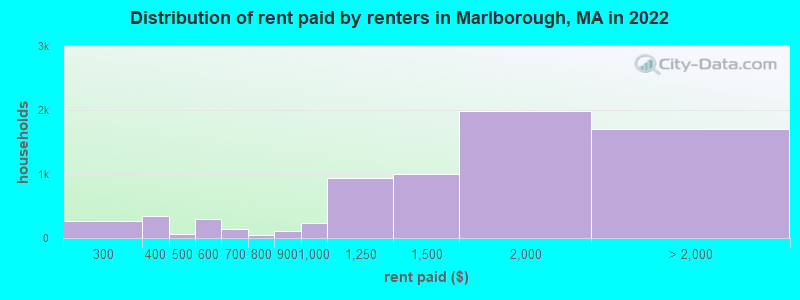
Rent paid by renters in 2022 in Marlborough, MA
-
- 13$150 to $199
- 66$200 to $249
- 206$250 to $299
- 210$300 to $349
- 133$350 to $399
- 46$400 to $449
- 11$450 to $499
- 197$500 to $549
- 97$550 to $599
- 57$600 to $649
- 81$650 to $699
- 13$700 to $749
- 35$750 to $799
- 103$800 to $899
- 240$900 to $999
- 930$1,000 to $1,249
- 1,004$1,250 to $1,499
- 1,987$1,500 to $1,999
- 1,030$2,000 to $2,499
- 345$2,500 to $2,999
- 79$3,000 to $3,499
- 60$3,500 or more
- 180No cash rent
Percentage of workers working in this county: 79.1%
Number of people working at home: 4,371 (19.7% of all workers)
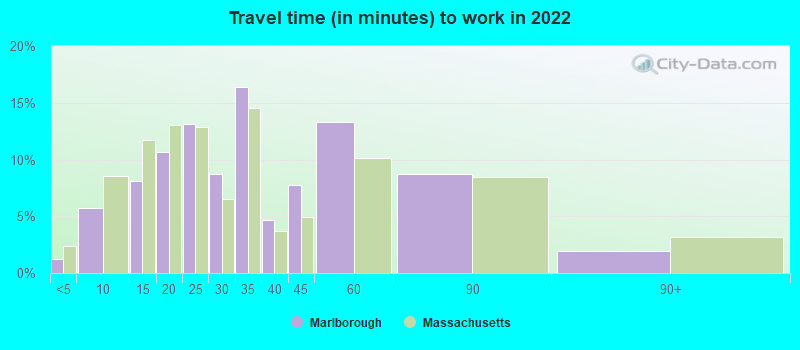
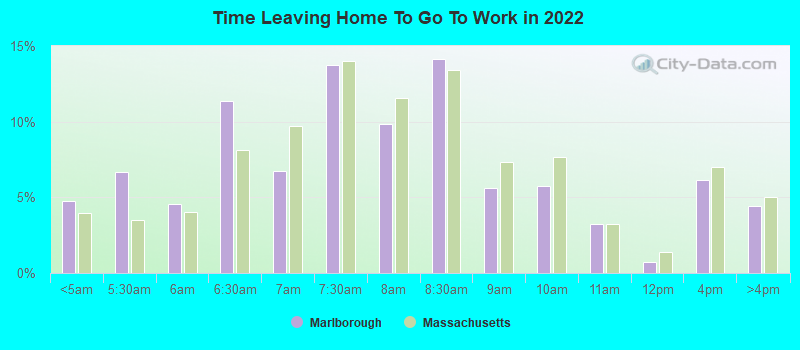
Travel time to work (commute)
- Less than 5 minutes: 346
- 5 to 9 minutes: 2,032
- 10 to 14 minutes: 2,427
- 15 to 19 minutes: 2,014
- 20 to 24 minutes: 1,954
- 25 to 29 minutes: 609
- 30 to 34 minutes: 2,492
- 35 to 39 minutes: 645
- 40 to 44 minutes: 1,021
- 45 to 59 minutes: 1,380
- 60 to 89 minutes: 1,911
- 90 or more minutes: 498
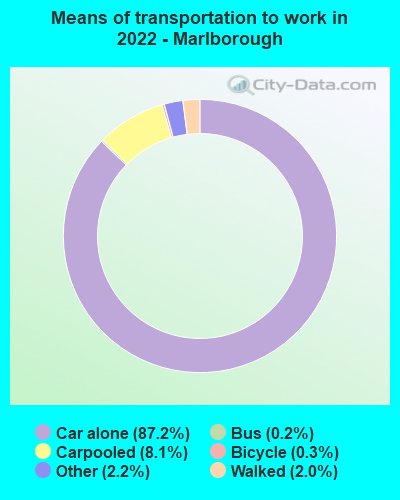
Means of transportation to work:
- Drove a car alone: 25,668 (73.3%)
- Carpooled: 2,494 (7.1%)
- Bus: 42 (0.1%)
- Subway or elevated rail: 18 (0.1%)
- Taxi: 847 (2.4%)
- Bicycle: 98 (0.3%)
- Walked: 600 (1.7%)
- Worked at home: 4,371 (12.5%)
- Unemployment by race in 2022
- Unemployment rate for White non-Hispanic residents
- 2.9%Males
- 4.8%Females
- Unemployment rate for Black residents
- 4.1%Females
- Unemployment rate for American Indian and Alaska Native residents
- 26.4%Males
- Unemployment rate for Asian residents
- 1.1%Males
- Unemployment rate for other race residents
- 3.2%Males
- 3.3%Females
- Unemployment rate for two or more race residents
- 0.6%Males
- 6.3%Females
- Unemployment rate for Hispanic or Latino residents
- 2.6%Males
- 3.1%Females
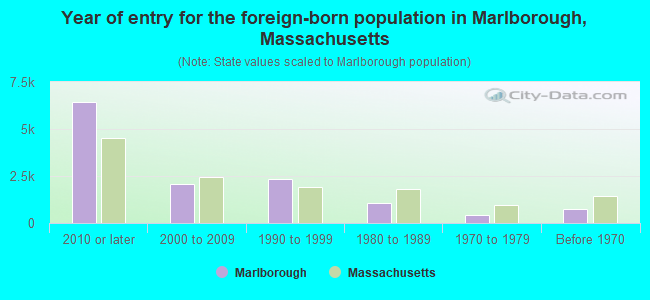
- Year of entry for the foreign-born population in Marlborough, Massachusetts
- 6,4462010 or later
- 2,0952000 to 2009
- 2,3191990 to 1999
- 1,0891980 to 1989
- 4441970 to 1979
- 730Before 1970
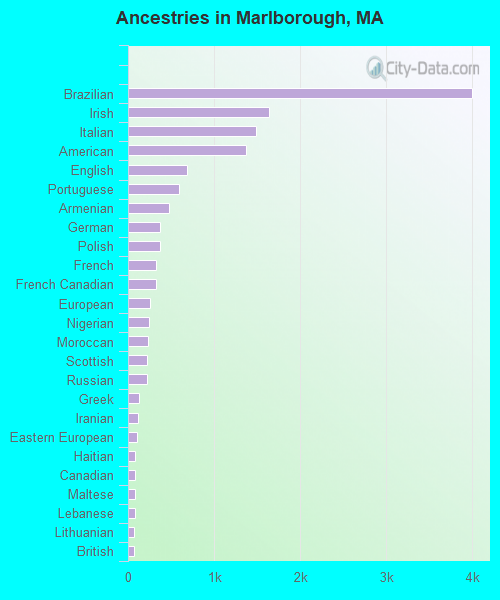
First ancestries reported:
- Brazilian: 3,997 (19.1%)
- Irish: 1,635 (7.8%)
- Italian: 1,487 (7.1%)
- American: 1,372 (6.6%)
- English: 687 (3.3%)
- Portuguese: 594 (2.8%)
- Armenian: 481 (2.3%)
- German: 377 (1.8%)
- Polish: 371 (1.8%)
- French: 330 (1.6%)
- French Canadian: 330 (1.6%)
- European: 255 (1.2%)
- Nigerian: 243 (1.2%)
- Moroccan: 236 (1.1%)
- Scottish: 220 (1.1%)
- Russian: 217 (1.0%)
- Greek: 123 (0.6%)
- Iranian: 120 (0.6%)
- Eastern European: 107 (0.5%)
- Haitian: 87 (0.4%)
- Canadian: 85 (0.4%)
- Maltese: 82 (0.4%)
- Lebanese: 78 (0.4%)
- Lithuanian: 69 (0.3%)
- British: 65 (0.3%)
- Cape Verdean: 47 (0.2%)
- Swedish: 47 (0.2%)
- Ukrainian: 43 (0.2%)
- Australian: 41 (0.2%)
- Norwegian: 41 (0.2%)
- Scotch-Irish: 40 (0.2%)
- Liberian: 39 (0.2%)
- South African: 38 (0.2%)
- Ghanaian: 33 (0.2%)
- Northern European: 32 (0.2%)
- Welsh: 32 (0.2%)
- Israeli: 29 (0.1%)
- Danish: 21 (0.1%)
- Swiss: 21 (0.1%)
- Slovene: 21 (0.1%)
- Slovak: 21 (0.1%)
- Finnish: 18 (0.09%)
- Austrian: 16 (0.08%)
- Hungarian: 14 (0.07%)
- Dutch: 13 (0.06%)
- Syrian: 13 (0.06%)
- Belgian: 9 (0.04%)
- Slavic: 9 (0.04%)
- African: 9 (0.04%)
- British West Indian: 7 (0.03%)
Most common places of birth for foreign-born residents (%):
| Marlborough: | 41.6% (5,187) |
| Massachusetts: | 7.6% (92,959) |
| Marlborough: | 20.8% (2,590) |
| Massachusetts: | 2.7% (32,733) |
| Marlborough: | 8.3% (1,030) |
| Massachusetts: | 6.8% (82,934) |
| Marlborough: | 4.0% (493) |
| Massachusetts: | 0.2% (2,307) |
| Marlborough: | 3.2% (398) |
| Massachusetts: | 2.3% (27,810) |
| Marlborough: | 2.3% (293) |
| Massachusetts: | 1.1% (13,065) |
| Marlborough: | 2.0% (244) |
| Massachusetts: | 0.1% (1,034) |
| Marlborough: | 1.9% (240) |
| Massachusetts: | 8.3% (101,767) |
| Marlborough: | 1.8% (227) |
| Massachusetts: | 8.4% (103,233) |
Place of birth for U.S.-born residents:
- This state: 20,991
- Other state: 6,715
- Northeast: 3,590
- Midwest: 655
- South: 1,671
- West: 846
85.8% of Marlborough residents lived in the same house 1 years ago.
Out of people who lived in different houses, 41.5% lived in this county.
Out of people who lived in different counties, 59.8% lived in Massachusetts.
| Marlborough: | 85.8% |
| State average: | 87.7% |
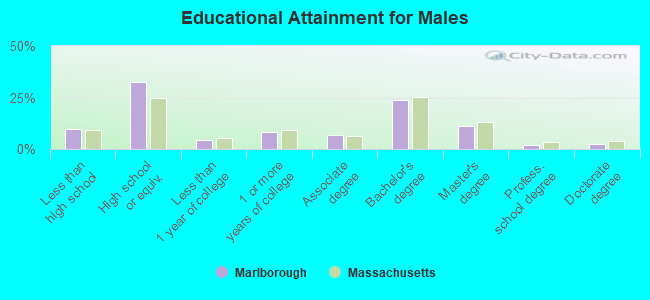
Education attainment for males 25 years and older:
- No schooling: 284
- Nursery to 4th grade: 0
- 5th and 6th grade: 160
- 7th and 8th grade: 176
- 9th grade: 122
- 10th grade: 263
- 11th grade: 131
- 12th grade, no diploma: 252
- High school graduate (or equivalency): 4,645
- Less than 1 year of college: 633
- Some college more than 1 year, no degree: 1,170
- Associate degree: 943
- Bachelor's degree: 3,430
- Master's degree: 1,595
- Professional school degree: 254
- Doctorate degree: 326
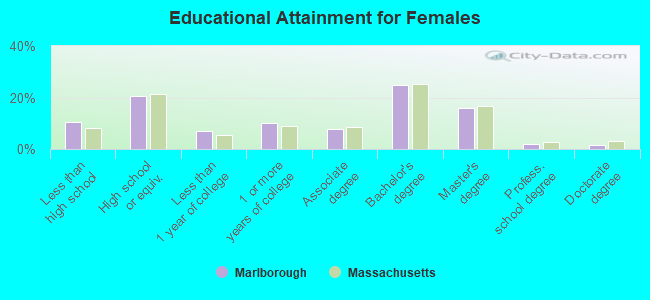
Education attainment for females 25 years and older:
- No schooling: 269
- Nursery to 4th grade: 142
- 5th and 6th grade: 137
- 7th and 8th grade: 82
- 9th grade: 294
- 10th grade: 209
- 11th grade: 112
- 12th grade, no diploma: 327
- High school graduate (or equivalency): 3,065
- Less than 1 year of college: 1,042
- Some college more than 1 year, no degree: 1,501
- Associate degree: 1,150
- Bachelor's degree: 3,669
- Master's degree: 2,337
- Professional school degree: 309
- Doctorate degree: 205
Housing units in structures:
- One, detached: 7,867
- One, attached: 1,434
- Two: 1,699
- 3 or 4: 1,276
- 5 to 9: 739
- 10 to 19: 1,424
- 20 to 49: 1,445
- 50 or more: 1,302
- Mobile homes: 474
Median worth of mobile homes: $101,452
Housing units lacking complete kitchen facilities in 2022: 1.7%
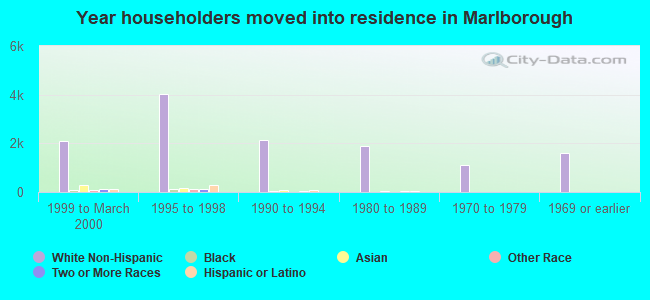
House/condo owner moved in on average 13 years ago
Renter moved in on average 2 years ago
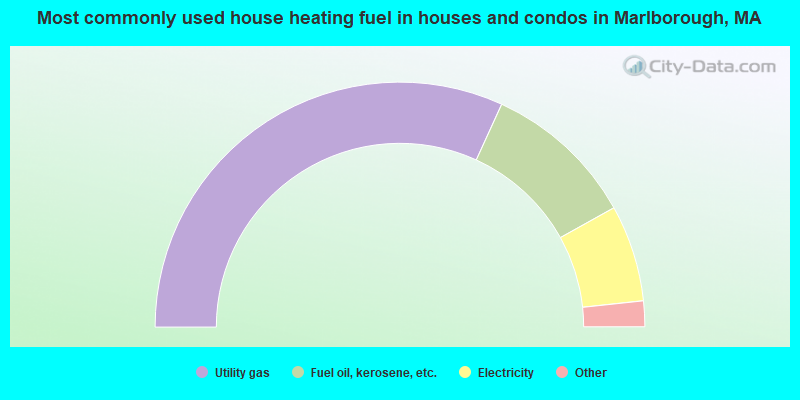
- 63.7%Utility gas
- 20.2%Fuel oil, kerosene, etc.
- 12.8%Electricity
- 1.9%Bottled, tank, or LP gas
- 0.7%Other fuel
- 0.6%Wood
- 0.2%No fuel used
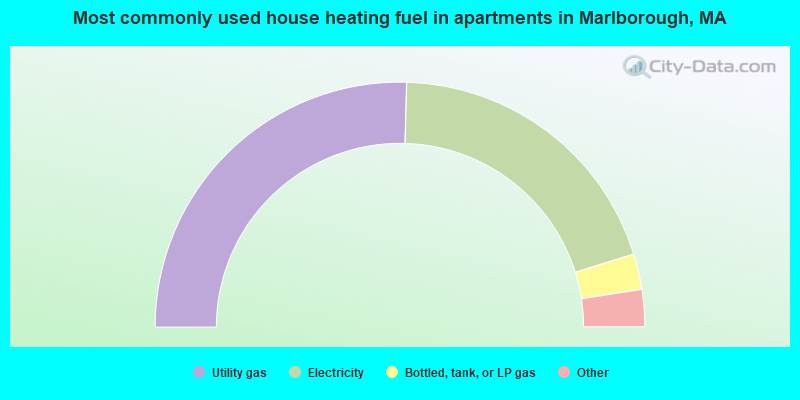
- 50.9%Utility gas
- 39.5%Electricity
- 4.7%Bottled, tank, or LP gas
- 3.5%Fuel oil, kerosene, etc.
- 1.0%Other fuel
- 0.3%No fuel used
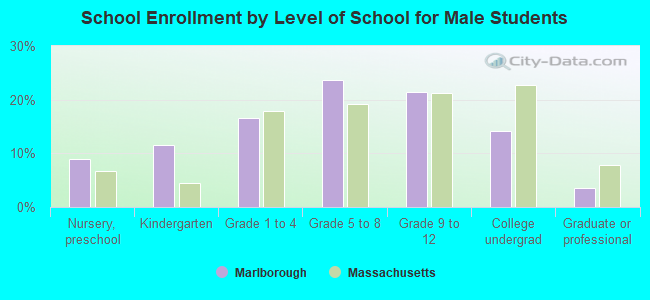
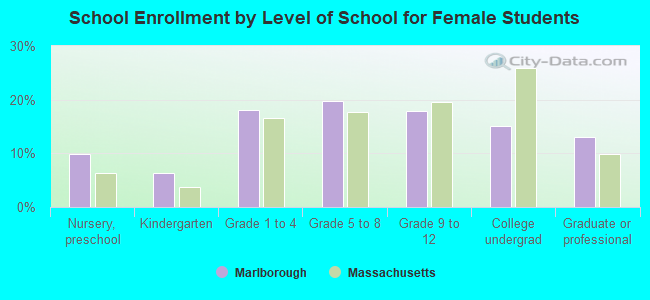
Private vs. public school enrollment:
| Here: | 7.3% |
| Massachusetts: | 10.3% |
| Here: | 8.9% |
| Massachusetts: | 12.3% |
| Here: | 37.0% |
| Massachusetts: | 51.2% |