Housing density: 845 houses/condos per square mile
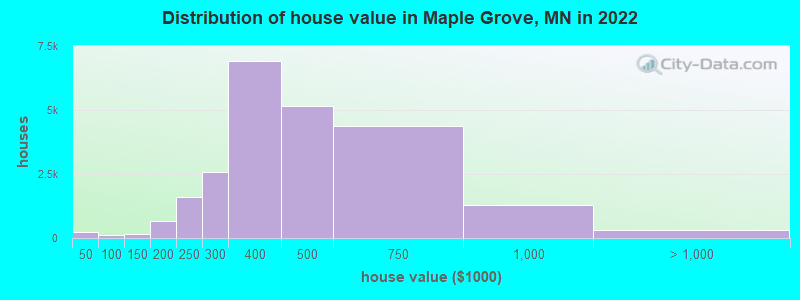
Median price asked for vacant for-sale houses and condos in 2022: $172,031.
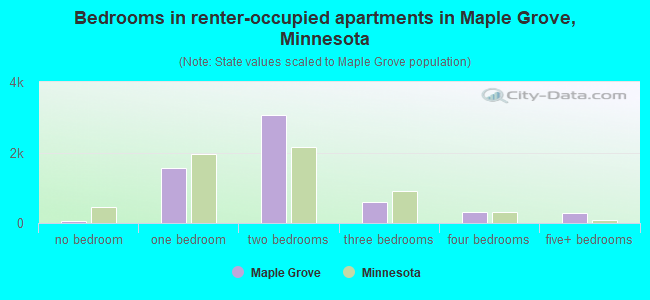
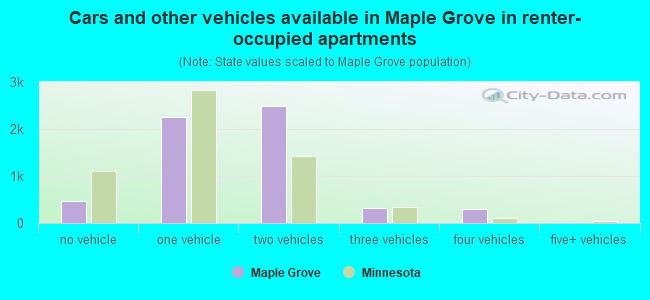
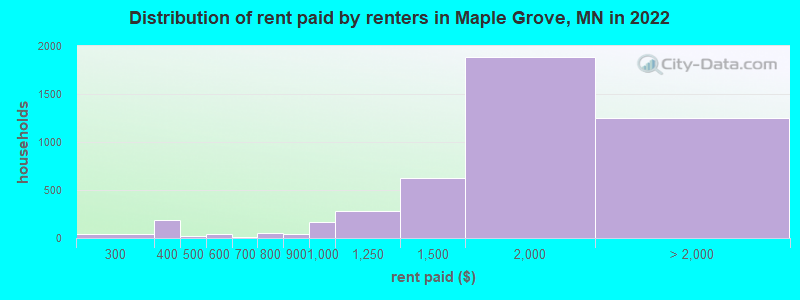
Median contract rent in 2022: $1,627 (lower quartile is $1,237, upper quartile is $1,927)
Median rent asked for vacant for-rent units in 2022: $1,988
Median gross rent in Maple Grove, MN in 2022: $1,725
Housing units in Maple Grove with a mortgage: 14,875 (1,189 second mortgage, 0 home equity loan, 1,130 both second mortgage and home equity loan) Houses without a mortgage: 236
Median household income for houses/condos with a mortgage: $150,814
Median household income for apartments without a mortgage: $95,677
Median monthly housing costs: $1,707
Compare current foreclosures near Maple Grove, MN:
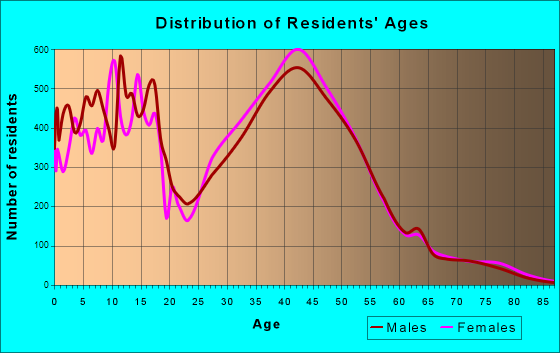
Size of family households: 7,883 2-persons, 4,496 3-persons, 5,187 4-persons, 1,190 5-persons, 231 6-persons, 657 7-or-more-persons.
Size of nonfamily households: 6,019 1-person, 1,349 2-persons.
13,667 married couples with children.
2,893 single-parent households (634 men, 2,259 women).
86.0% of residents of Maple Grove speak English at home.
1.4% of residents speak Spanish at home (71% speak English very well, 24% speak English well, 4% speak English not well).
4.5% of residents speak other Indo-European language at home (74% speak English very well, 17% speak English well, 7% speak English not well, 3% don't speak English at all).
3.9% of residents speak Asian or Pacific Island language at home (68% speak English very well, 26% speak English well, 6% speak English not well).
3.9% of residents speak other language at home (75% speak English very well, 18% speak English well, 7% speak English not well).
Foreign born population: 9,376 (13.3%)
(58.3% of them are naturalized citizens)
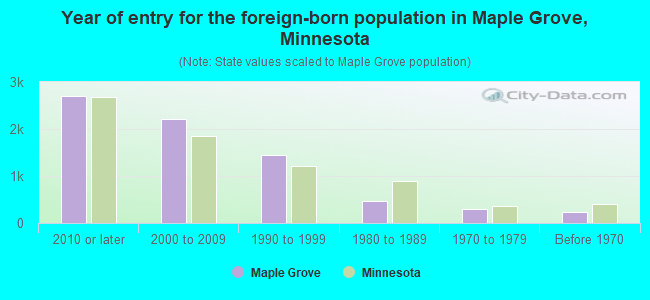
Year of entry for the foreign-born population in Maple Grove, Minnesota
2,7122010 or later
2,2152000 to 2009
1,4501990 to 1999
4591980 to 1989
3011970 to 1979
240Before 1970
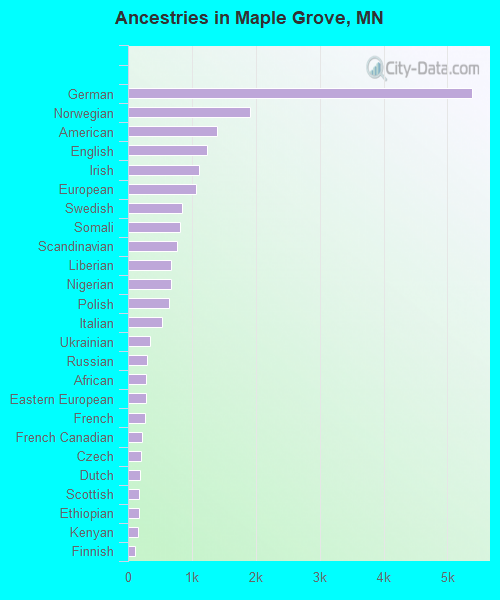
First ancestries reported:
German: 5,382 (20.0%)
Norwegian: 1,912 (7.1%)
American: 1,396 (5.2%)
English: 1,229 (4.6%)
Irish: 1,119 (4.2%)
European: 1,064 (3.9%)
Swedish: 845 (3.1%)
Somali: 812 (3.0%)
Scandinavian: 767 (2.8%)
Liberian: 678 (2.5%)
Nigerian: 677 (2.5%)
Polish: 642 (2.4%)
Italian: 539 (2.0%)
Ukrainian: 348 (1.3%)
Russian: 297 (1.1%)
African: 285 (1.1%)
Eastern European: 274 (1.0%)
French: 273 (1.0%)
French Canadian: 218 (0.8%)
Czech: 208 (0.8%)
Dutch: 193 (0.7%)
Scottish: 179 (0.7%)
Ethiopian: 173 (0.6%)
Kenyan: 158 (0.6%)
Finnish: 111 (0.4%)
Canadian: 107 (0.4%)
Jamaican: 103 (0.4%)
Danish: 65 (0.2%)
Slovak: 61 (0.2%)
Northern European: 57 (0.2%)
Latvian: 53 (0.2%)
British: 51 (0.2%)
Belgian: 49 (0.2%)
Romanian: 44 (0.2%)
Lithuanian: 40 (0.1%)
Lebanese: 40 (0.1%)
Swiss: 34 (0.1%)
Syrian: 33 (0.1%)
Portuguese: 32 (0.1%)
Turkish: 32 (0.1%)
Croatian: 27 (0.1%)
Brazilian: 27 (0.1%)
Greek: 26 (0.10%)
Welsh: 25 (0.09%)
Hungarian: 21 (0.08%)
Scotch-Irish: 20 (0.07%)
Australian: 19 (0.07%)
Iranian: 12 (0.04%)
Slovene: 11 (0.04%)
Egyptian: 10 (0.04%)
Pennsylvania German: 9 (0.03%)
Estonian: 9 (0.03%)
Austrian: 9 (0.03%)
Guyanese: 5 (0.02%)
Most common places of birth for foreign-born residents (%):
India
Maple Grove:
16.1% (1,339)
Minnesota:
6.7% (32,141)
Liberia
Maple Grove:
7.7% (638)
Minnesota:
2.8% (13,695)
Vietnam
Maple Grove:
5.4% (451)
Minnesota:
3.8% (18,442)
Nigeria
Maple Grove:
5.2% (434)
Minnesota:
1.7% (8,263)
Ethiopia
Maple Grove:
4.8% (402)
Minnesota:
5.1% (24,630)
Canada
Maple Grove:
3.9% (321)
Minnesota:
2.5% (11,939)
Philippines
Maple Grove:
3.8% (320)
Minnesota:
2.0% (9,850)
Russia
Maple Grove:
3.7% (304)
Minnesota:
1.3% (6,329)
Somalia
Maple Grove:
3.3% (278)
Minnesota:
8.0% (38,461)
Ukraine
Maple Grove:
2.8% (237)
Minnesota:
1.0% (4,646)
China, excluding Hong Kong and Taiwan
Maple Grove:
2.8% (230)
Minnesota:
3.6% (17,119)
Kenya
Maple Grove:
2.7% (225)
Minnesota:
3.3% (15,701)
Korea
Maple Grove:
2.4% (198)
Minnesota:
2.4% (11,675)
France
Maple Grove:
2.0% (167)
Minnesota:
0.3% (1,664)
Czechoslovakia (includes Czech Republic and Slovakia)
Maple Grove:
1.8% (154)
Minnesota:
0.1% (577)
Moldova
Maple Grove:
1.7% (145)
Minnesota:
0.4% (1,779)
Pakistan
Maple Grove:
1.7% (145)
Minnesota:
0.6% (2,729)
Africa, n.e.c.
Maple Grove:
1.7% (139)
Minnesota:
0.6% (3,113)
Cambodia
Maple Grove:
1.6% (136)
Minnesota:
0.9% (4,264)
Place of birth for U.S.-born residents:
This state: 42,299
Other state: 17,750
Northeast: 2,354
Midwest: 11,514
South: 1,421
West: 2,461
89.8% of Maple Grove residents lived in the same house 1 years ago. Out of people who lived in different houses, 38.3% lived in this county. Out of people who lived in different counties, 47.9% lived in Minnesota.
Maple Grove:
89.8%
State average:
87.4%
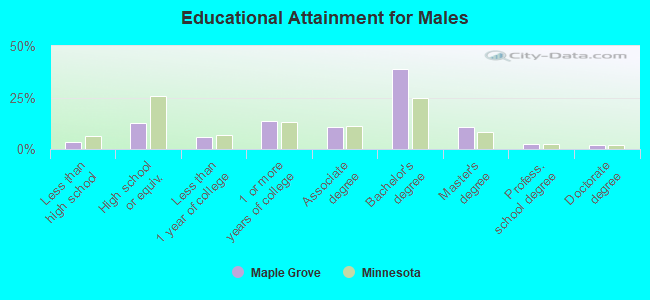
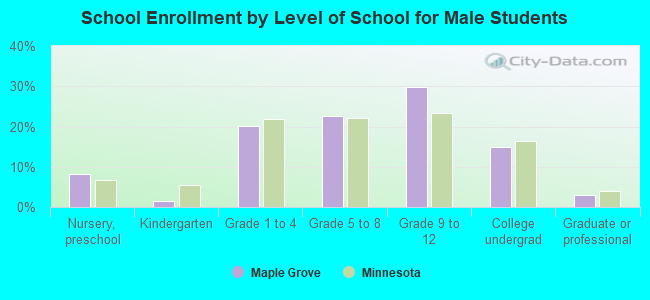
Education attainment for males 25 years and older:
No schooling: 397
Nursery to 4th grade: 0
5th and 6th grade: 0
7th and 8th grade: 57
9th grade: 66
10th grade: 0
11th grade: 26
12th grade, no diploma: 251
High school graduate (or equivalency): 2,994
Less than 1 year of college: 1,420
Some college more than 1 year, no degree: 3,218
Associate degree: 2,527
Bachelor's degree: 9,232
Master's degree: 2,499
Professional school degree: 632
Doctorate degree: 431
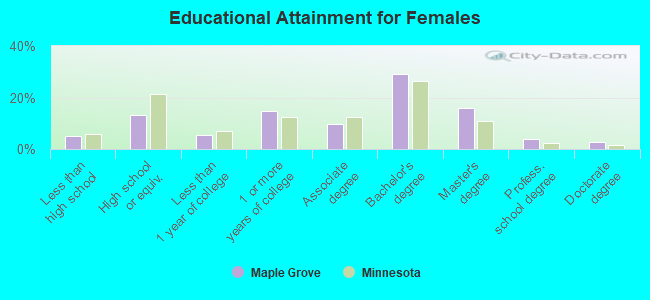
Education attainment for females 25 years and older:
No schooling: 553
Nursery to 4th grade: 0
5th and 6th grade: 46
7th and 8th grade: 0
9th grade: 0
10th grade: 77
11th grade: 67
12th grade, no diploma: 479
High school graduate (or equivalency): 3,228
Less than 1 year of college: 1,273
Some college more than 1 year, no degree: 3,566
Associate degree: 2,382
Bachelor's degree: 7,049
Master's degree: 3,848
Professional school degree: 982
Doctorate degree: 703
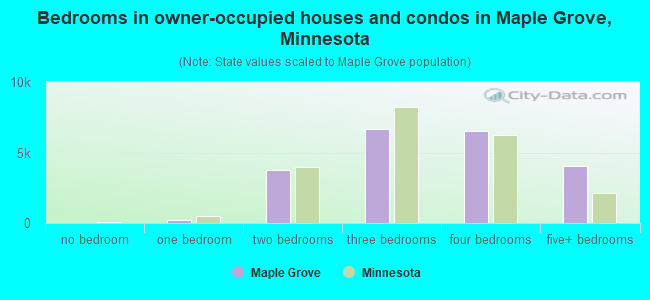
Housing units in structures:
One, detached: 18,055
One, attached: 5,549
Two: 171
3 or 4: 398
5 to 9: 217
10 to 19: 298
20 to 49: 1,001
50 or more: 2,082
Housing units lacking complete plumbing facilities in 2022: 1.5%
Housing units lacking complete kitchen facilities in 2022: 1.4%
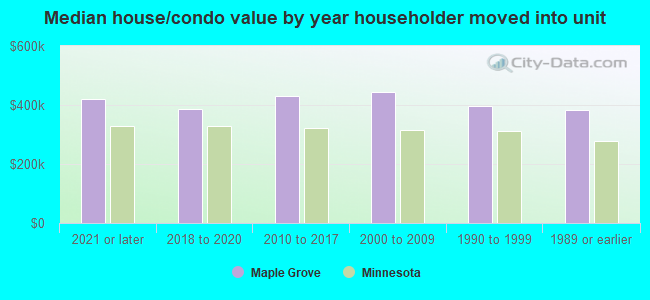
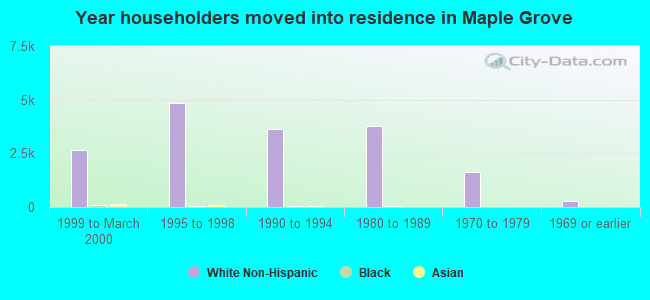
House/condo owner moved in on average 11 years ago