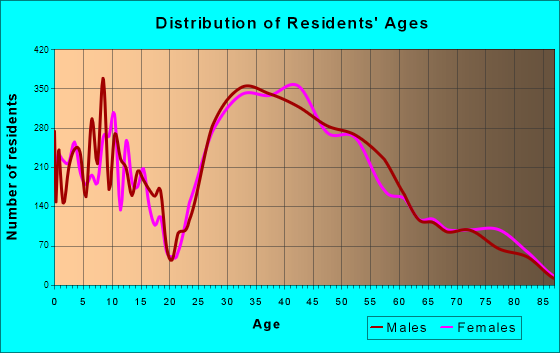
Manhattan Beach, CA (California) Houses and Residents
| Manhattan Beach: | $2,200,493 |
| California: | $715,900 |
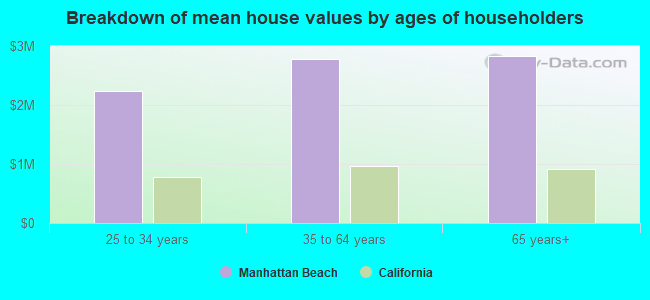
Mean price in 2022:
Detached houses: $3,085,279
Here: $3,085,279 State: $988,808 Townhouses or other attached units: $2,967,558
Here: $2,967,558 State: $838,546 In 2-unit structures: $2,193,497
Here: $2,193,497 State: $1,138,100 In 3-to-4-unit structures: $2,902,009
Here: $2,902,009 State: $824,253 In 5-or-more-unit structures: $1,434,250
Here: $1,434,250 State: $730,996
Total population: 35,881 (Urban population: 34,039, Rural population: 0)
Houses: 15,336 (13,557 occupied: 9,537 owner occupied, 4,071 renter occupied)
| % of renters here: | 30% |
| State: | 44% |
Housing density: 3,899 houses/condos per square mile
Median price asked for vacant for-sale houses and condos in 2022: $2,414,137.
Median contract rent in 2022: over $2,000 (lower quartile is over $2,000, upper quartile is over $2,000)
Median rent asked for vacant for-rent units in 2022: $4,078
Median gross rent in Manhattan Beach, CA in 2022: over $2,000
Housing units in Manhattan Beach with a mortgage: 6,374 (974 second mortgage, 90 home equity loan, 822 both second mortgage and home equity loan)
Houses without a mortgage: 199
Median household income for houses/condos with a mortgage: $248,703
Median household income for apartments without a mortgage: $144,489
Median monthly housing costs: $3,706
Compare current foreclosures near Manhattan Beach, CA:
| Photo | Address | Area | Beds / Baths | Price | Details |
|---|---|---|---|---|---|

|
#1
28th St
Manhattan Beach, CA 90266
|
1,348 sq. feet
|
2 baths 2 beds |
show details | |

|
#2
6th St
Manhattan Beach, CA 90266
|
3,447 sq. feet
|
4 baths 4 beds |
show details | |

|
#3
Pine Ave
Manhattan Beach, CA 90266
|
2,524 sq. feet
|
4 baths 3 beds |
show details | |

|
#4
Park View Ave Ste 200
Manhattan Beach, CA 90266
|
- sq. feet
|
- baths - beds |
show details | |

|
#5
Park View Ave Apt 217
Manhattan Beach, CA 90266
|
- sq. feet
|
- baths - beds |
show details | |

|
#6
Rosecrans Ave, Ste D Pmb 550
Manhattan Beach, CA 90266
|
- sq. feet
|
- baths - beds |
show details | |

|
#7
Bel Air Rd
Los Angeles, CA 90077
|
3,821 sq. feet
|
4 baths 4 beds |
$3,499,000
|
show details |

|
#8
Cedarbrook Dr
Beverly Hills, CA 90210
|
2,371 sq. feet
|
2 baths 3 beds |
$2,350,000
|
show details |

|
#9
Horn Ave Apt 618
West Hollywood, CA 90069
|
797 sq. feet
|
1 baths 1 beds |
$650,000
|
show details |

|
#10
Wilshire Blvd Apt 703
Los Angeles, CA 90024
|
2,245 sq. feet
|
2 baths 2 beds |
$1,750,000
|
show details |
| Photo | Address | Area | Beds / Baths | Price | Details |
|---|---|---|---|---|---|

|
#11
Marina City Drive # Ph 29
Marina Del Rey, CA 90292
|
3,200 sq. feet
|
2 baths 2 beds |
show details | |

|
#12
E 60th St
Los Angeles, CA 90001
|
1,883 sq. feet
|
3 baths 5 beds |
show details | |

|
#13
W 73rd St
Los Angeles, CA 90047
|
1,700 sq. feet
|
2 baths 2 beds |
show details | |

|
#14
Marina City Dr Unit 116
Marina Del Rey, CA 90292
|
1,722 sq. feet
|
2 baths 3 beds |
show details | |

|
#15
Redondo Avenue, Units 5-8
Long Beach, CA 90804
|
3,360 sq. feet
|
4 baths 8 beds |
show details | |

|
#16
W 110th St
Inglewood, CA 90303
|
3,481 sq. feet
|
4 baths 6 beds |
show details | |

|
#17
6th Ave
Venice, CA 90291
|
3,192 sq. feet
|
3 baths 6 beds |
show details | |

|
#18
Greenfield Ave
Los Angeles, CA 90025
|
1,224 sq. feet
|
2 baths 2 beds |
show details | |

|
#19
N Beachwood Dr
Los Angeles, CA 90068
|
1,848 sq. feet
|
2 baths 2 beds |
show details | |

|
#20
W Arbor St # 57
Long Beach, CA 90805
|
1,585 sq. feet
|
2 baths 3 beds |
show details |
| Photo | Address | Area | Beds / Baths | Price | Details |
|---|---|---|---|---|---|

|
#21
Elburg St Unit A
Paramount, CA 90723
|
1,131 sq. feet
|
2 baths 3 beds |
show details | |

|
#22
W 112th St
Los Angeles, CA 90047
|
1,208 sq. feet
|
1 baths 3 beds |
show details | |

|
#23
Parrot Ave
Downey, CA 90242
|
2,121 sq. feet
|
3 baths 4 beds |
show details | |

|
#24
W Billings St
Compton, CA 90220
|
1,583 sq. feet
|
3 baths 4 beds |
show details | |

|
#25
W 83rd St
Inglewood, CA 90305
|
1,374 sq. feet
|
2 baths 3 beds |
show details | |

|
#26
Yucca St Unit 206
Los Angeles, CA 90028
|
- sq. feet
|
3 baths 2 beds |
show details | |

|
#27
N Adelon Ln
Compton, CA 90221
|
1,900 sq. feet
|
3 baths 3 beds |
show details | |

|
#28
Cook St
Los Angeles, CA 90061
|
1,204 sq. feet
|
2 baths 4 beds |
show details | |

|
#29
S Garth Ave
Los Angeles, CA 90056
|
2,275 sq. feet
|
2 baths 3 beds |
show details | |

|
#30
Camulos St
Los Angeles, CA 90033
|
1,222 sq. feet
|
2 baths 4 beds |
show details |
| Photo | Address | Area | Beds / Baths | Price | Details |
|---|---|---|---|---|---|

|
#31
N Croft Ave Apt 301
West Hollywood, CA 90069
|
1,680 sq. feet
|
2 baths 2 beds |
show details | |

|
#32
W 104th St
Inglewood, CA 90304
|
787 sq. feet
|
1 baths 2 beds |
show details | |

|
#33
Elderhall Ave
Lakewood, CA 90712
|
1,638 sq. feet
|
2 baths 3 beds |
show details | |

|
#34
Ardath Ave
Gardena, CA 90249
|
1,304 sq. feet
|
2 baths 3 beds |
show details | |

|
#35
Dinwiddie St
Downey, CA 90241
|
2,152 sq. feet
|
3 baths 4 beds |
show details | |

|
#36
S Victoria Ave
Los Angeles, CA 90016
|
1,716 sq. feet
|
2 baths 3 beds |
show details | |

|
#37
W 107th St
Inglewood, CA 90304
|
873 sq. feet
|
1 baths 2 beds |
show details | |

|
#38
S Norton Ave
Los Angeles, CA 90018
|
1,082 sq. feet
|
1 baths 2 beds |
show details | |

|
#39
S 5th Ave
Inglewood, CA 90303
|
2,010 sq. feet
|
3 baths 4 beds |
show details | |

|
#40
Walnut Ave
Long Beach, CA 90807
|
1,912 sq. feet
|
3 baths 2 beds |
show details |
| Photo | Address | Area | Beds / Baths | Price | Details |
|---|---|---|---|---|---|

|
#41
Playa Vista Dr Apt 15
Los Angeles, CA 90094
|
1,920 sq. feet
|
3 baths 1 beds |
show details | |

|
#42
Courtland Ave
Los Angeles, CA 90006
|
2,087 sq. feet
|
2 baths 4 beds |
show details | |

|
#43
W Sunset Blvd Apt 302
Pacific Palisades, CA 90272
|
1,396 sq. feet
|
2 baths 2 beds |
show details | |

|
#44
Virginia St
Lynwood, CA 90262
|
1,548 sq. feet
|
2 baths 3 beds |
show details | |

|
#45
Liberty Blvd
South Gate, CA 90280
|
1,488 sq. feet
|
2 baths 3 beds |
show details | |

|
#46
Hercules Dr
Los Angeles, CA 90046
|
5,038 sq. feet
|
5 baths 4 beds |
show details | |

|
#47
W 98th St
Los Angeles, CA 90044
|
1,022 sq. feet
|
2 baths 3 beds |
show details | |

|
#48
Fry St
Bell Gardens, CA 90201
|
2,467 sq. feet
|
3 baths 6 beds |
show details | |

|
#49
E 215th Pl
Carson, CA 90745
|
1,225 sq. feet
|
2 baths 4 beds |
show details | |

|
Check over 1 million property listings on Foreclosure.com!
|
browse all offers | |||


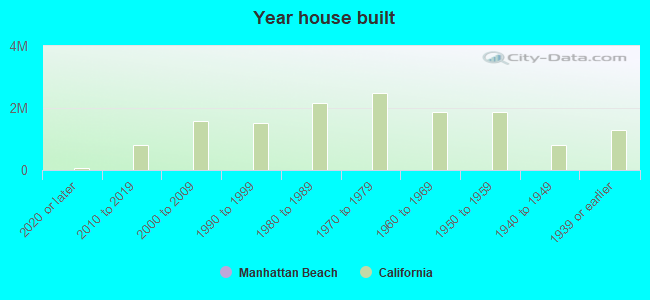
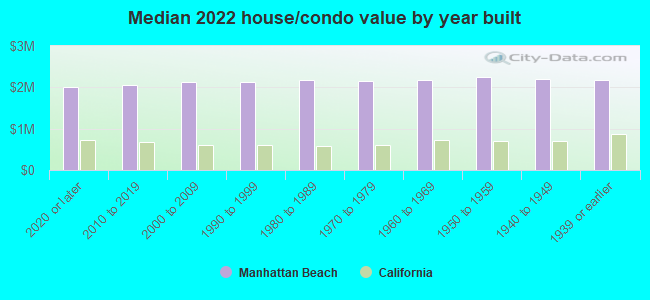
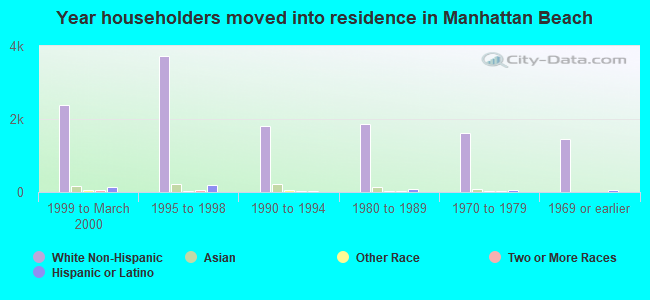
Median year apartment built: 1969
Household type by relationship:
Households: 34,361- Male householders: 7,102 (1,416 living alone), Female householders: 6,006 (1,548 living alone)
8,033 spouses (7,941 opposite-sex spouses), 663 unmarried partners, (636 opposite-sex unmarried partners), 10,843 children (10,568 natural, 214 adopted, 60 stepchildren), 236 grandchildren, 158 brothers or sisters, 288 parents, 31 foster children, 117 other relatives, 839 non-relatives
- In group quarters: 39
Size of family households: 4,159 2-persons, 1,825 3-persons, 2,547 4-persons, 772 5-persons, 76 6-persons, 11 7-or-more-persons.
Size of nonfamily households: 3,180 1-person, 984 2-persons, 65 3-persons, 24 4-persons.
7,257 married couples with children.
1,299 single-parent households (709 men, 590 women).
87.0% of residents of Manhattan Beach speak English at home.
3.2% of residents speak Spanish at home (86% speak English very well, 7% speak English well, 6% speak English not well, 1% don't speak English at all).
4.1% of residents speak other Indo-European language at home (89% speak English very well, 11% speak English well).
6.4% of residents speak Asian or Pacific Island language at home (78% speak English very well, 21% speak English well, 2% speak English not well).
0.6% of residents speak other language at home (100% speak English very well).
Foreign born population: 4,459 (13.0%)
(68.0% of them are naturalized citizens)
| Here: | 6.8 |
| State: | 6.0 |
| Here: | 4.2 |
| State: | 3.9 |
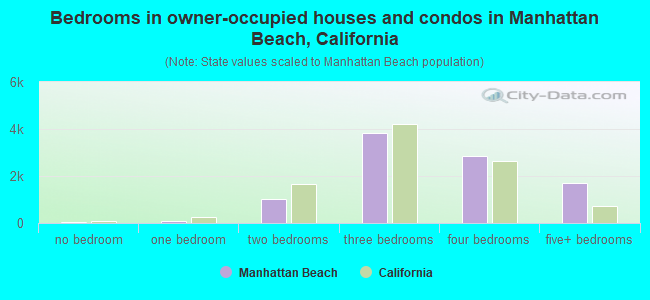
- Bedrooms in owner-occupied houses and condos in Manhattan Beach, California
- 23no bedroom
- 791 bedroom
- 1,0372 bedrooms
- 3,8353 bedrooms
- 2,8714 bedrooms
- 1,6925+ bedrooms
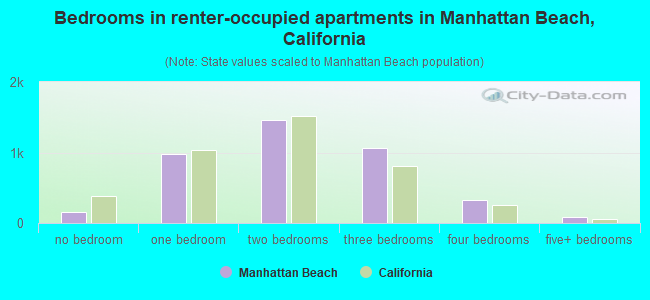
- Bedrooms in renter-occupied apartments in Manhattan Beach, California
- 163no bedroom
- 9791 bedroom
- 1,4582 bedrooms
- 1,0603 bedrooms
- 3224 bedrooms
- 895+ bedrooms
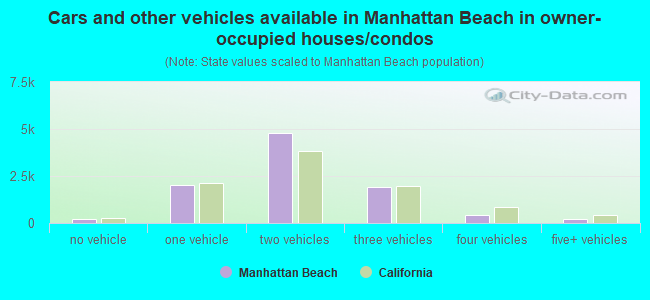
- Cars and other vehicles available in Manhattan Beach in owner-occupied houses/condos
- 194no vehicle
- 2,0401 vehicle
- 4,7722 vehicles
- 1,9033 vehicles
- 4314 vehicles
- 1985+ vehicles
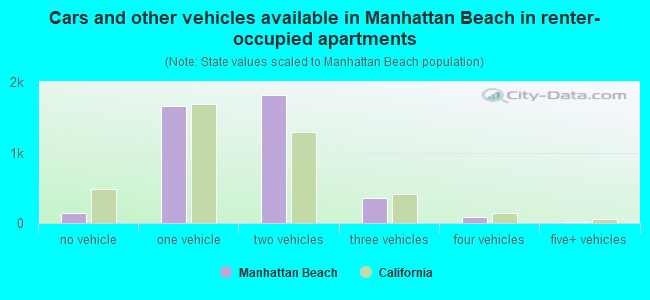
- Cars and other vehicles available in Manhattan Beach in renter-occupied apartments
- 137no vehicle
- 1,6641 vehicle
- 1,8182 vehicles
- 3513 vehicles
- 814 vehicles
- 205+ vehicles
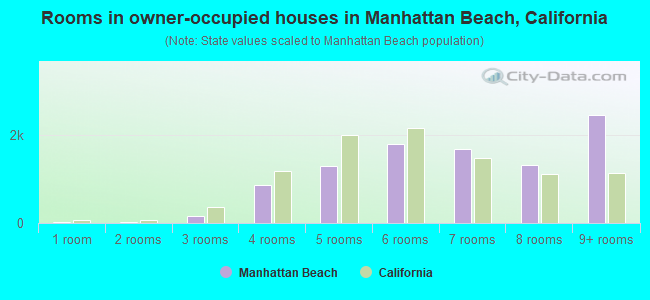
- Rooms in owner-occupied houses in Manhattan Beach, California
- 171 room
- 142 rooms
- 1523 rooms
- 8514 rooms
- 1,2955 rooms
- 1,7906 rooms
- 1,6677 rooms
- 1,3088 rooms
- 2,4449+ rooms
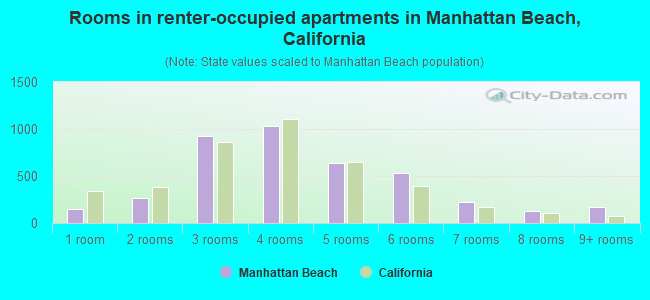
- Rooms in renter-occupied apartments in Manhattan Beach, California
- 1541 room
- 2672 rooms
- 9223 rooms
- 1,0314 rooms
- 6365 rooms
- 5356 rooms
- 2257 rooms
- 1298 rooms
- 1729+ rooms
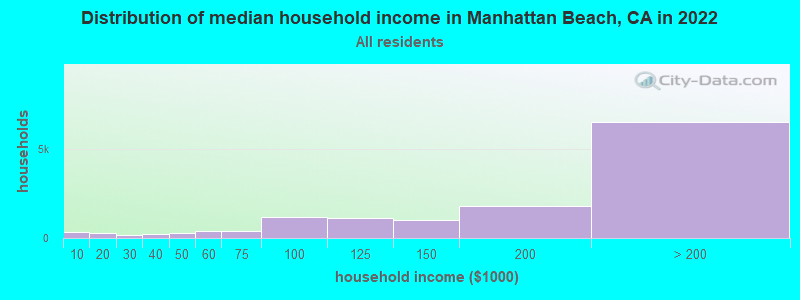
Manhattan Beach, CA household income distribution

- 319Less than $10,000
- 286$10,000 to $19,999
- 183$20,000 to $29,999
- 222$30,000 to $39,999
- 270$40,000 to $49,999
- 370$50,000 to $59,999
- 372$60,000 to $74,999
- 1,182$75,000 to $99,999
- 1,115$100,000 to $124,999
- 1,008$125,000 to $149,999
- 1,809$150,000 to $199,999
- 6,531$200,000 or more
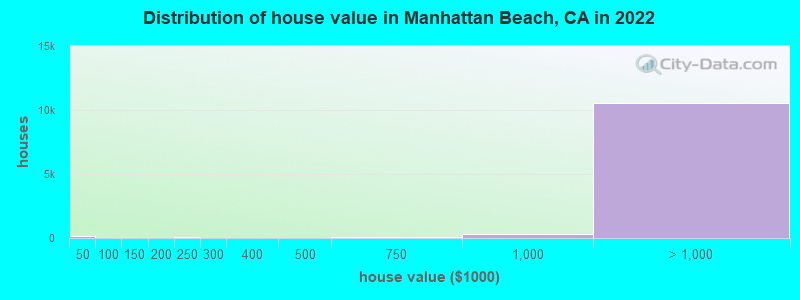
Home value of owner - occupied houses in 2022 in Manhattan Beach, CA
-
- 157Less than $10,000
- 7$100,000 to $124,999
- 5$125,000 to $149,999
- 6$175,000 to $199,999
- 59$200,000 to $249,999
- 6$250,000 to $299,999
- 14$300,000 to $399,999
- 12$400,000 to $499,999
- 73$500,000 to $749,999
- 321$750,000 to $999,999
- 1,115$1,000,000 to $1,499,999
- 1,773$1,500,000 to $1,999,999
- 7,648$2,000,000 or more
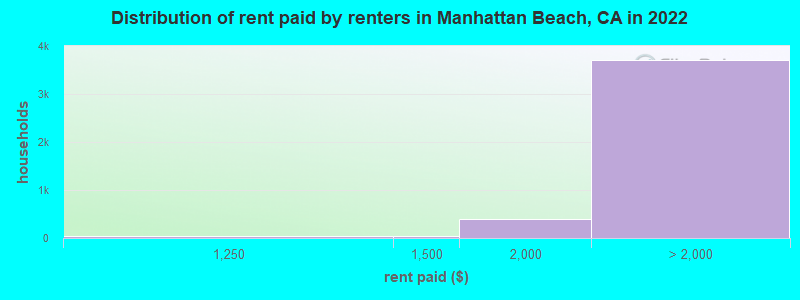
Rent paid by renters in 2022 in Manhattan Beach, CA
-
- 13Less than $100
- 6$900 to $999
- 36$1,000 to $1,249
- 48$1,250 to $1,499
- 388$1,500 to $1,999
- 746$2,000 to $2,499
- 576$2,500 to $2,999
- 426$3,000 to $3,499
- 1,709$3,500 or more
- 252No cash rent
Percentage of workers working in this county: 96.5%
Number of people working at home: 5,815 (37.2% of all workers)
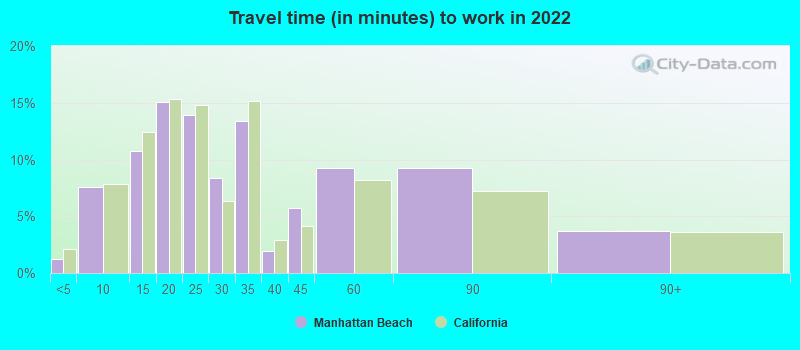
Travel time to work (commute)
- Less than 5 minutes: 231
- 5 to 9 minutes: 1,488
- 10 to 14 minutes: 1,149
- 15 to 19 minutes: 1,003
- 20 to 24 minutes: 903
- 25 to 29 minutes: 909
- 30 to 34 minutes: 1,071
- 35 to 39 minutes: 502
- 40 to 44 minutes: 433
- 45 to 59 minutes: 1,222
- 60 to 89 minutes: 1,490
- 90 or more minutes: 241
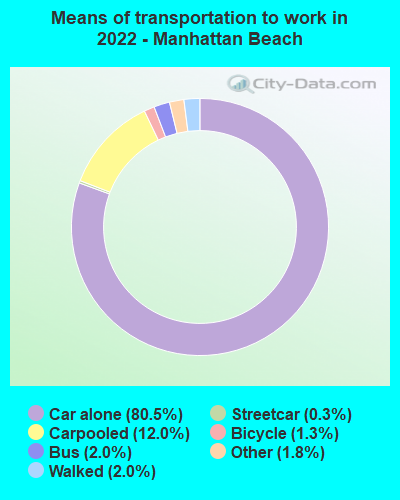
Means of transportation to work:
- Drove a car alone: 13,781 (61.1%)
- Carpooled: 2,270 (10.1%)
- Bus: 319 (1.4%)
- Subway or elevated rail: 45 (0.2%)
- Light rail, streetcar or trolley: 5 (0.0%)
- Taxi: 334 (1.5%)
- Bicycle: 234 (1.0%)
- Walked: 368 (1.6%)
- Worked at home: 5,815 (25.8%)
- Unemployment by race in 2022
- Unemployment rate for White non-Hispanic residents
- 2.9%Males
- 4.6%Females
- Unemployment rate for Black residents
- 93.2%Females
- Unemployment rate for Asian residents
- 0.8%Males
- 0.9%Females
- Unemployment rate for other race residents
- 3.9%Males
- Unemployment rate for two or more race residents
- 2.4%Males
- Unemployment rate for Hispanic or Latino residents
- 1.0%Males
- 5.2%Females
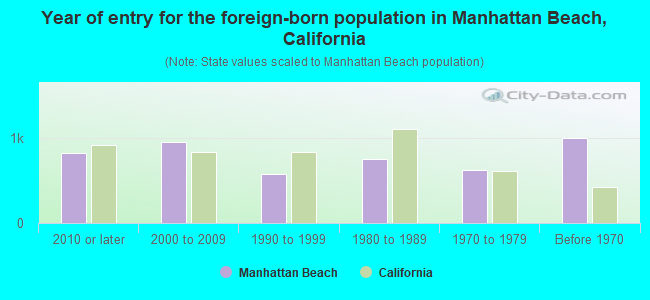
- Year of entry for the foreign-born population in Manhattan Beach, California
- 8262010 or later
- 9532000 to 2009
- 5791990 to 1999
- 7531980 to 1989
- 6201970 to 1979
- 995Before 1970
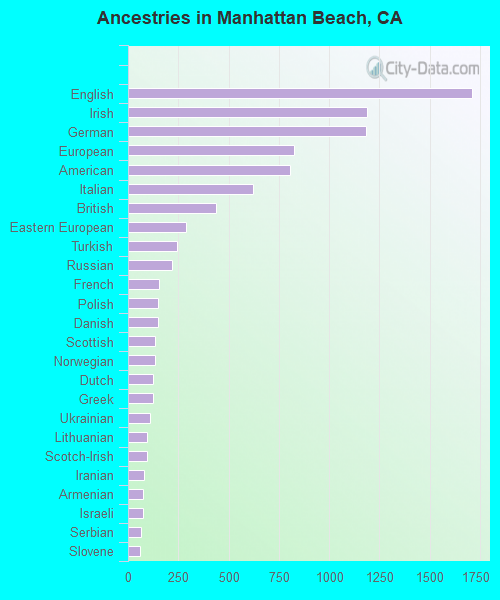
First ancestries reported:
- English: 1,709 (11.1%)
- Irish: 1,188 (7.7%)
- German: 1,184 (7.7%)
- European: 827 (5.4%)
- American: 805 (5.2%)
- Italian: 620 (4.0%)
- British: 437 (2.8%)
- Eastern European: 286 (1.9%)
- Turkish: 242 (1.6%)
- Russian: 218 (1.4%)
- French: 155 (1.0%)
- Polish: 150 (1.0%)
- Danish: 149 (1.0%)
- Scottish: 136 (0.9%)
- Norwegian: 133 (0.9%)
- Dutch: 126 (0.8%)
- Greek: 124 (0.8%)
- Ukrainian: 111 (0.7%)
- Lithuanian: 94 (0.6%)
- Scotch-Irish: 92 (0.6%)
- Iranian: 79 (0.5%)
- Armenian: 76 (0.5%)
- Israeli: 73 (0.5%)
- Serbian: 64 (0.4%)
- Slovene: 60 (0.4%)
- Portuguese: 59 (0.4%)
- Swedish: 47 (0.3%)
- South African: 45 (0.3%)
- Brazilian: 39 (0.3%)
- Northern European: 38 (0.2%)
- Romanian: 37 (0.2%)
- Palestinian: 35 (0.2%)
- Egyptian: 32 (0.2%)
- Finnish: 25 (0.2%)
- Scandinavian: 23 (0.1%)
- Czech: 22 (0.1%)
- Canadian: 21 (0.1%)
- French Canadian: 18 (0.1%)
- Hungarian: 18 (0.1%)
- Slovak: 17 (0.1%)
- Welsh: 16 (0.1%)
- Belgian: 14 (0.09%)
- Czechoslovakian: 13 (0.08%)
- Estonian: 12 (0.08%)
- Swiss: 12 (0.08%)
- Moroccan: 7 (0.05%)
- Lebanese: 7 (0.05%)
- Assyrian: 6 (0.04%)
- Latvian: 5 (0.03%)
- Australian: 2 (0.01%)
- Yugoslavian: 1 (0.01%)
Most common places of birth for foreign-born residents (%):
| Manhattan Beach: | 10.3% (460) |
| California: | 3.0% (315,248) |
| Manhattan Beach: | 9.6% (426) |
| California: | 0.6% (60,582) |
| Manhattan Beach: | 8.5% (380) |
| California: | 5.2% (539,184) |
| Manhattan Beach: | 7.9% (351) |
| California: | 1.7% (176,274) |
| Manhattan Beach: | 7.8% (349) |
| California: | 6.6% (684,672) |
| Manhattan Beach: | 4.8% (212) |
| California: | 1.2% (127,477) |
| Manhattan Beach: | 3.8% (169) |
| California: | 4.9% (512,335) |
| Manhattan Beach: | 3.5% (154) |
| California: | 1.0% (103,575) |
| Manhattan Beach: | 3.1% (140) |
| California: | 37.2% (3,881,193) |
| Manhattan Beach: | 2.8% (125) |
| California: | 0.5% (53,222) |
| Manhattan Beach: | 2.5% (110) |
| California: | 0.7% (73,304) |
| Manhattan Beach: | 2.4% (107) |
| California: | 0.2% (20,474) |
| Manhattan Beach: | 2.3% (104) |
| California: | 7.8% (818,297) |
| Manhattan Beach: | 2.1% (94) |
| California: | 0.0% (4,595) |
| Manhattan Beach: | 2.1% (92) |
| California: | 0.2% (20,614) |
| Manhattan Beach: | 2.0% (87) |
| California: | 0.6% (57,953) |
| Manhattan Beach: | 1.6% (72) |
| California: | 0.1% (6,555) |
Place of birth for U.S.-born residents:
- This state: 19,041
- Other state: 10,317
- Northeast: 3,586
- Midwest: 3,313
- South: 2,167
- West: 1,259
89.8% of Manhattan Beach residents lived in the same house 1 years ago.
Out of people who lived in different houses, 40.9% lived in this county.
Out of people who lived in different counties, 28.2% lived in California.
| Manhattan Beach: | 89.8% |
| State average: | 88.9% |
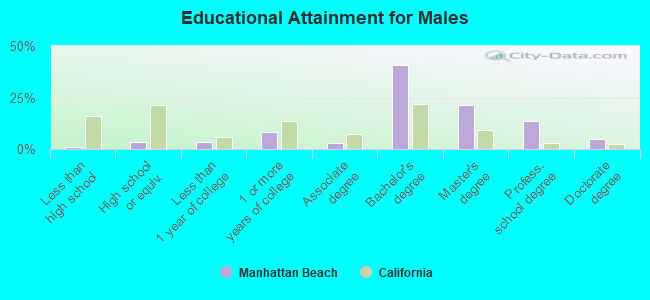
Education attainment for males 25 years and older:
- No schooling: 10
- Nursery to 4th grade: 0
- 5th and 6th grade: 0
- 7th and 8th grade: 34
- 9th grade: 0
- 10th grade: 0
- 11th grade: 0
- 12th grade, no diploma: 89
- High school graduate (or equivalency): 427
- Less than 1 year of college: 389
- Some college more than 1 year, no degree: 1,009
- Associate degree: 373
- Bachelor's degree: 4,894
- Master's degree: 2,605
- Professional school degree: 1,649
- Doctorate degree: 590
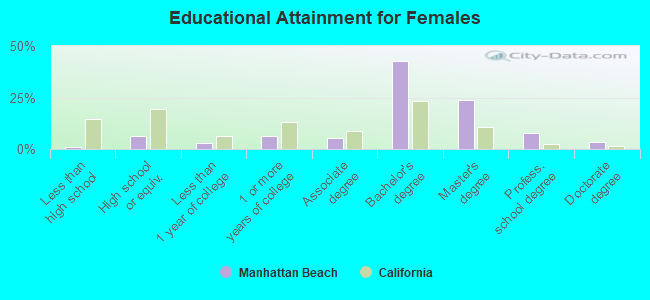
Education attainment for females 25 years and older:
- No schooling: 13
- Nursery to 4th grade: 5
- 5th and 6th grade: 0
- 7th and 8th grade: 28
- 9th grade: 10
- 10th grade: 10
- 11th grade: 16
- 12th grade, no diploma: 67
- High school graduate (or equivalency): 771
- Less than 1 year of college: 362
- Some college more than 1 year, no degree: 813
- Associate degree: 692
- Bachelor's degree: 5,308
- Master's degree: 2,929
- Professional school degree: 983
- Doctorate degree: 419

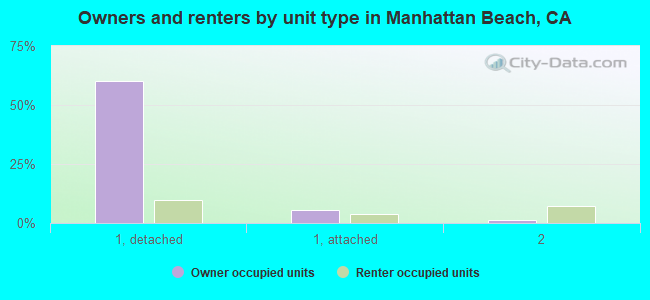
Housing units in structures:
- One, detached: 10,855
- One, attached: 1,338
- Two: 889
- 3 or 4: 822
- 5 to 9: 826
- 10 to 19: 384
- 20 to 49: 160
- 50 or more: 51
- Mobile homes: 7
Housing units lacking complete kitchen facilities in 2022: 1.6%
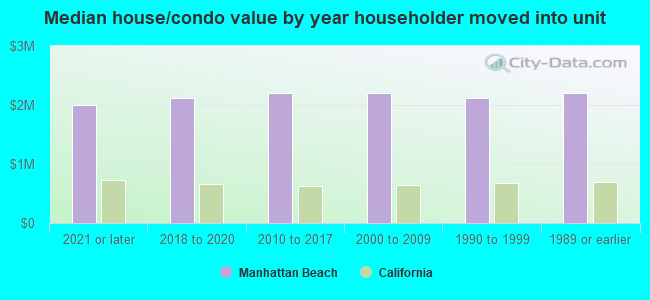
House/condo owner moved in on average 16 years ago
Renter moved in on average 3 years ago
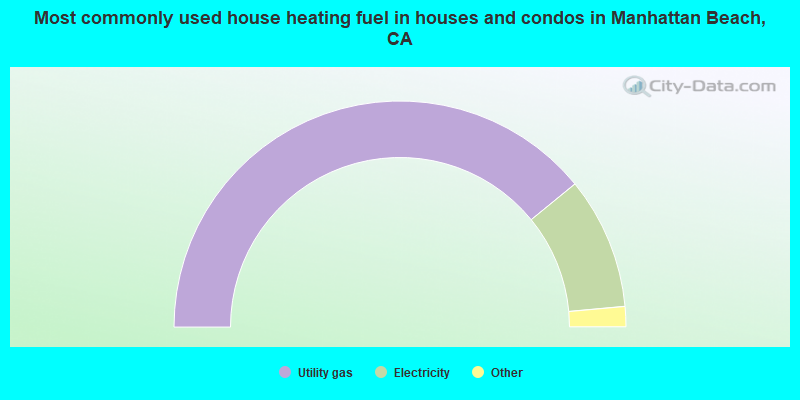
- 78.2%Utility gas
- 18.9%Electricity
- 1.1%No fuel used
- 0.9%Solar energy
- 0.7%Bottled, tank, or LP gas
- 0.2%Fuel oil, kerosene, etc.
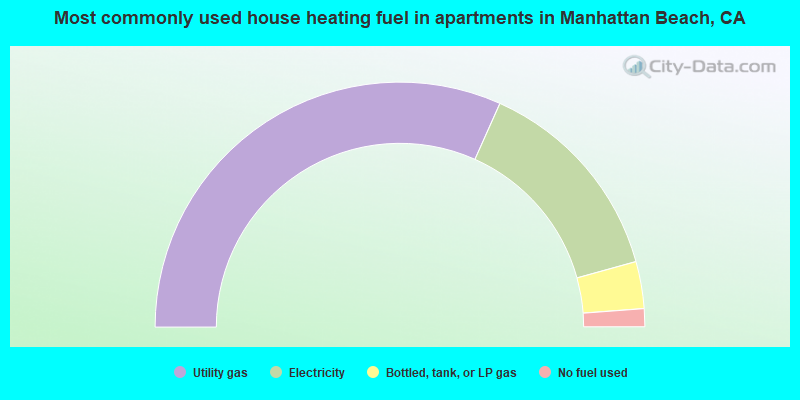
- 63.4%Utility gas
- 28.0%Electricity
- 6.2%Bottled, tank, or LP gas
- 2.4%No fuel used
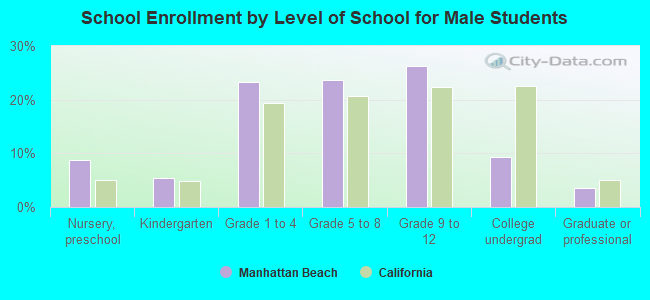
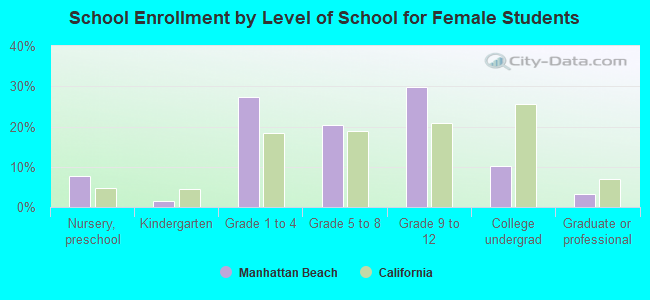
Private vs. public school enrollment:
| Here: | 15.5% |
| California: | 10.5% |
| Here: | 30.0% |
| California: | 8.5% |
| Here: | 36.5% |
| California: | 15.9% |