Manchester-by-the-Sea, MA (Massachusetts) Houses and Residents
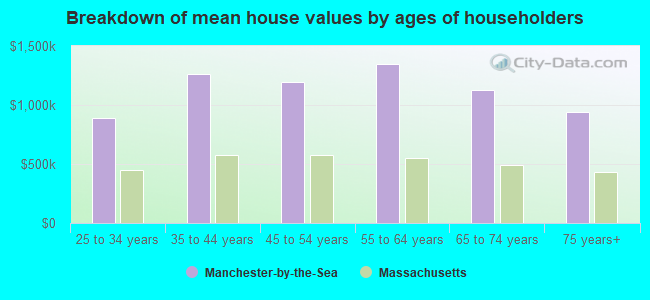
| Manchester-by-the-Sea: | $1,176,204 |
| Massachusetts: | $534,700 |
Total population: 5,136 (Urban population: 4,855, Rural population: 373 (all nonfarm))
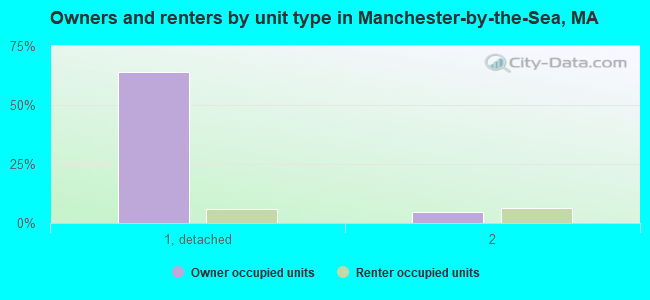
Houses: 2,327 (2,168 occupied: 1,536 owner occupied, 632 renter occupied)
| % of renters here: | 29% |
| State: | 38% |
Housing density: 250 houses/condos per square mile
Median price asked for vacant for-sale houses and condos in 2022 in this county: $495,592.
Median contract rent in 2022: $1,837 (lower quartile is $1,405, upper quartile is over $2,000)
Median rent asked for vacant for-rent units in 2022: $2,870
Median gross rent in Manchester-by-the-Sea, MA in 2022: $1,986
Housing units in Manchester-by-the-Sea with a mortgage: 929 (104 second mortgage, 221 home equity loan, 0 both second mortgage and home equity loan)
Houses without a mortgage: 407
Compare current foreclosures near Manchester-by-the-Sea, MA:
| Photo | Address | Area | Beds / Baths | Price | Details |
|---|---|---|---|---|---|

|
#1
Essex St
Swampscott, MA 01907
|
2,029 sq. feet
|
2 baths 3 beds |
show details | |

|
#2
Fenwick St
Revere, MA 02151
|
2,080 sq. feet
|
1 baths 3 beds |
show details | |

|
#3
Mill River Ln
Rowley, MA 01969
|
2,705 sq. feet
|
2 baths 4 beds |
show details | |

|
#4
Chase St
Beverly, MA 01915
|
1,407 sq. feet
|
1 baths 3 beds |
show details | |

|
#5
Tobey Ln
Wakefield, MA 01880
|
3,240 sq. feet
|
2 baths 4 beds |
show details | |

|
#6
Margin Street
Lynn, MA 01905
|
1,240 sq. feet
|
2 baths 2 beds |
show details | |

|
#7
Fays Ave
Lynn, MA 01904
|
1,407 sq. feet
|
2 baths 2 beds |
show details | |

|
#8
Childs St
Lynn, MA 01905
|
1,856 sq. feet
|
1 baths 3 beds |
show details | |

|
#9
Scribner Rd
Peabody, MA 01960
|
1,494 sq. feet
|
1 baths 3 beds |
show details | |

|
#10
Pleasant St Un 107
Lynn, MA 01902
|
950 sq. feet
|
2 baths 2 beds |
show details |
| Photo | Address | Area | Beds / Baths | Price | Details |
|---|---|---|---|---|---|

|
#11
Western Ave # 2
Lynn, MA 01904
|
2,125 sq. feet
|
3 baths 3 beds |
show details | |

|
#12
Michael Rd
Lynn, MA 01904
|
1,594 sq. feet
|
3 baths 3 beds |
show details | |

|
#13
Wennerberg Rd
Middleton, MA 01949
|
1,132 sq. feet
|
1 baths 3 beds |
show details | |

|
#14
Quinn Rd
Lynn, MA 01904
|
1,512 sq. feet
|
1 baths 2 beds |
show details | |

|
#15
Stony Brook Ln # 143
Middleton, MA 01949
|
2,753 sq. feet
|
3 baths 3 beds |
show details | |

|
#16
Linwood Rd
Lynn, MA 01905
|
1,944 sq. feet
|
2 baths 4 beds |
show details | |

|
#17
Bellevue Rd
Lynn, MA 01904
|
3,324 sq. feet
|
3 baths 7 beds |
show details | |

|
#18
Essex S 2
Swampscott, MA 01907
|
2,029 sq. feet
|
2 baths 3 beds |
show details | |

|
#19
Meredith Rd
Peabody, MA 01960
|
1,542 sq. feet
|
1 baths 4 beds |
show details | |

|
#20
Hamilton Rd
Peabody, MA 01960
|
4,540 sq. feet
|
3 baths 6 beds |
show details |
| Photo | Address | Area | Beds / Baths | Price | Details |
|---|---|---|---|---|---|

|
#21
Glen Dr
Peabody, MA 01960
|
960 sq. feet
|
1 baths 3 beds |
show details | |

|
#22
Lawrence Rd Un 22
Rowley, MA 01969
|
720 sq. feet
|
1 baths 1 beds |
show details | |

|
#23
Peters Ct
Middleton, MA 01949
|
3,140 sq. feet
|
2 baths 4 beds |
show details | |

|
#24
Peters Ct
Middleton, MA 01949
|
3,140 sq. feet
|
2 baths 4 beds |
show details | |

|
#25
Summer St # 1
Lynn, MA 01905
|
3,179 sq. feet
|
2 baths 8 beds |
show details | |

|
#26
Farnham Rd
Rowley, MA 01969
|
1,106 sq. feet
|
2 baths 3 beds |
show details | |

|
#27
Belmont Ave
Lynn, MA 01905
|
867 sq. feet
|
1 baths 2 beds |
show details | |

|
#28
Birch St
Peabody, MA 01960
|
1,496 sq. feet
|
1 baths 3 beds |
show details | |

|
#29
Pennybrook Rd
Lynn, MA 01905
|
966 sq. feet
|
1 baths 2 beds |
show details | |

|
#30
Florence St
Lynn, MA 01905
|
1,091 sq. feet
|
1 baths 2 beds |
show details |
| Photo | Address | Area | Beds / Baths | Price | Details |
|---|---|---|---|---|---|

|
#31
Holyoke St
Lynn, MA 01905
|
1,484 sq. feet
|
2 baths 3 beds |
show details | |

|
#32
White Way
Nahant, MA 01908
|
1,184 sq. feet
|
2 baths 3 beds |
show details | |

|
#33
Boston St Un 14
Lynn, MA 01905
|
1,679 sq. feet
|
1 baths 2 beds |
show details | |

|
#34
W Sigourney St
Lynn, MA 01905
|
978 sq. feet
|
1 baths 3 beds |
show details | |

|
#35
Winthrop St
Lynn, MA 01904
|
1,456 sq. feet
|
1 baths 4 beds |
show details | |

|
#36
Clearview Ave
Lynn, MA 01904
|
1,408 sq. feet
|
1 baths 2 beds |
show details | |

|
#37
Albert Rd
Peabody, MA 01960
|
1,352 sq. feet
|
1 baths 3 beds |
show details | |

|
#38
Chestnut St # 2
Lynn, MA 01902
|
2,178 sq. feet
|
2 baths 4 beds |
show details | |

|
#39
Rowell Rd
Danvers, MA 01923
|
2,954 sq. feet
|
3 baths 5 beds |
show details | |

|
#40
Homestead Way
Topsfield, MA 01983
|
2,105 sq. feet
|
2 baths 5 beds |
show details |
| Photo | Address | Area | Beds / Baths | Price | Details |
|---|---|---|---|---|---|

|
#41
George Ave
Peabody, MA 01960
|
1,228 sq. feet
|
1 baths 3 beds |
show details | |

|
#42
Arbutus Pl
Lynn, MA 01902
|
1,265 sq. feet
|
1 baths 3 beds |
show details | |

|
#43
Birch St
Lynn, MA 01902
|
1,994 sq. feet
|
2 baths 4 beds |
show details | |

|
#44
Eutaw Ave
Lynn, MA 01902
|
1,185 sq. feet
|
1 baths 3 beds |
show details | |

|
#45
Western Ave
Gloucester, MA 01930
|
1,998 sq. feet
|
3 baths 2 beds |
show details | |

|
#46
Collins St
Lynn, MA 01902
|
1,815 sq. feet
|
2 baths 4 beds |
show details | |

|
#47
Bartholomew St
Peabody, MA 01960
|
960 sq. feet
|
1 baths 3 beds |
show details | |

|
#48
Stephen Ter
Lynn, MA 01902
|
998 sq. feet
|
1 baths 2 beds |
show details | |

|
#49
Clovelly St
Lynn, MA 01902
|
1,207 sq. feet
|
1 baths 3 beds |
show details | |

|
Check over 1 million property listings on Foreclosure.com!
|
browse all offers | |||

Household type by relationship:
Households: 726,687- In family households: 606,990 (122,043 male householders, 65,962 female householders)
136,841 spouses, 221,565 children (210,337 natural, 5,012 adopted, 6,216 stepchildren), 11,988 grandchildren, 7,913 brothers or sisters, 8,558 parents, foster children, 9,566 other relatives, 17,265 non-relatives
- In nonfamily households: 119,697 (41,801 male householders (32,274 living alone)), 56,150 female householders (48,012 living alone)), 21,746 nonrelatives
- In group quarters: 16,472 (6,766 institutionalized population)
125,244 married couples with children.
42,832 single-parent households (7,363 men, 35,469 women).
95.4% of residents of Manchester-by-the-Sea speak English at home.
0.8% of residents speak Spanish at home (100% speak English very well).
3.5% of residents speak other Indo-European language at home (100% speak English very well).
0.1% of residents speak Asian or Pacific Island language at home (100% speak English very well).
0.2% of residents speak other language at home (100% speak English very well).
Foreign born population: 507 (8.7%)
(85.0% of them are naturalized citizens)
| Here: | 7.7 |
| State: | 6.5 |
| Here: | 3.1 |
| State: | 4.0 |
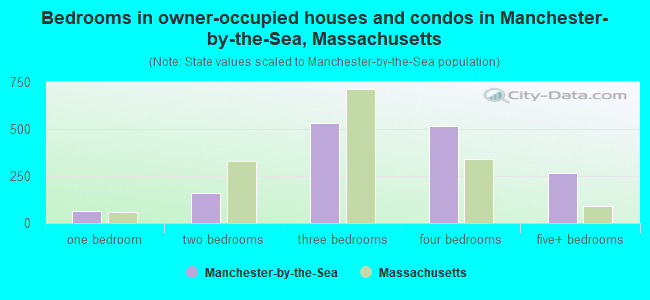
- Bedrooms in owner-occupied houses and condos in Manchester-by-the-Sea, Massachusetts
- 0no bedroom
- 651 bedroom
- 1612 bedrooms
- 5313 bedrooms
- 5144 bedrooms
- 2655+ bedrooms
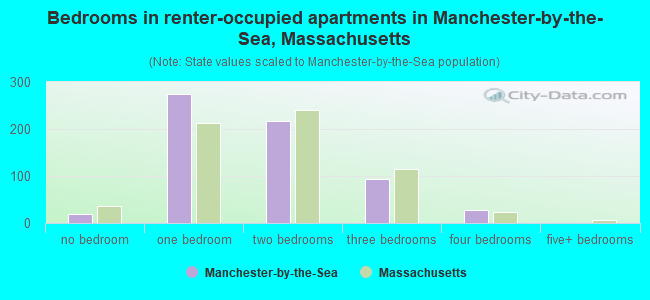
- Bedrooms in renter-occupied apartments in Manchester-by-the-Sea, Massachusetts
- 19no bedroom
- 2751 bedroom
- 2162 bedrooms
- 943 bedrooms
- 284 bedrooms
- 05+ bedrooms
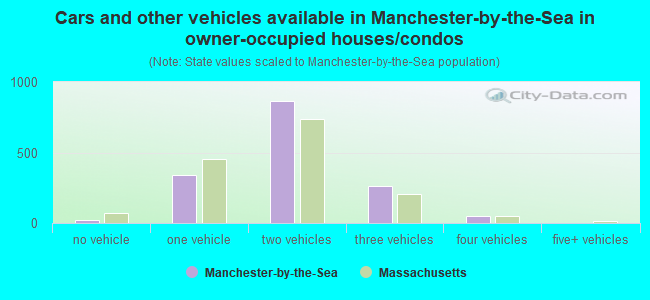
- Cars and other vehicles available in Manchester-by-the-Sea in owner-occupied houses/condos
- 19no vehicle
- 3381 vehicle
- 8652 vehicles
- 2613 vehicles
- 534 vehicles
- 05+ vehicles
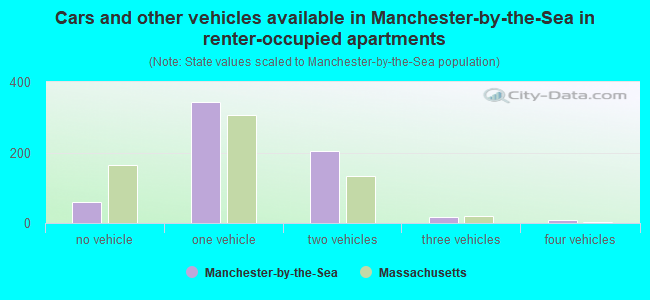
- Cars and other vehicles available in Manchester-by-the-Sea in renter-occupied apartments
- 60no vehicle
- 3431 vehicle
- 2042 vehicles
- 163 vehicles
- 94 vehicles
- 05+ vehicles
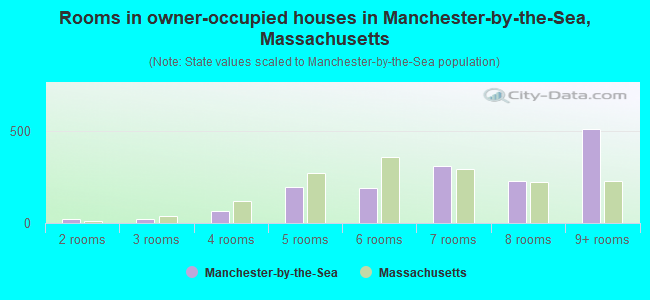
- Rooms in owner-occupied houses in Manchester-by-the-Sea, Massachusetts
- 01 room
- 192 rooms
- 193 rooms
- 644 rooms
- 1975 rooms
- 1916 rooms
- 3097 rooms
- 2288 rooms
- 5099+ rooms
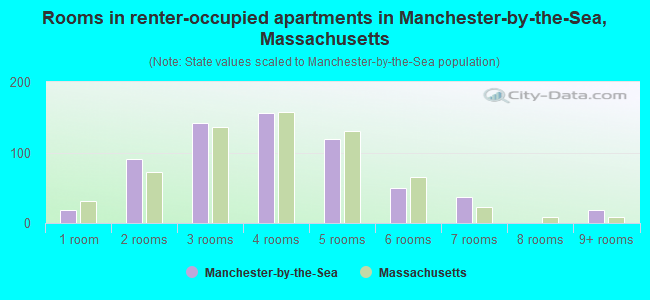
- Rooms in renter-occupied apartments in Manchester-by-the-Sea, Massachusetts
- 191 room
- 912 rooms
- 1423 rooms
- 1564 rooms
- 1195 rooms
- 496 rooms
- 377 rooms
- 08 rooms
- 199+ rooms
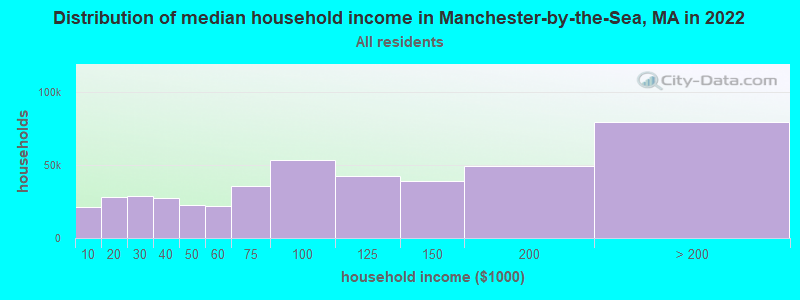
Manchester-by-the-Sea, MA household income distribution

- 20,899Less than $10,000
- 27,794$10,000 to $19,999
- 28,653$20,000 to $29,999
- 27,248$30,000 to $39,999
- 22,639$40,000 to $49,999
- 21,948$50,000 to $59,999
- 35,362$60,000 to $74,999
- 52,974$75,000 to $99,999
- 42,275$100,000 to $124,999
- 39,045$125,000 to $149,999
- 49,160$150,000 to $199,999
- 79,283$200,000 or more
Percentage of workers working in this county: 68.1%
Number of people working at home: 510 (16.3% of all workers)
Travel time to work (commute)
- Less than 5 minutes: 116
- 5 to 9 minutes: 376
- 10 to 14 minutes: 180
- 15 to 19 minutes: 357
- 20 to 24 minutes: 265
- 25 to 29 minutes: 73
- 30 to 34 minutes: 129
- 35 to 39 minutes: 75
- 40 to 44 minutes: 98
- 45 to 59 minutes: 239
- 60 to 89 minutes: 407
- 90 or more minutes: 82
Means of transportation to work:
- Drove a car alone: 1,975 (76.9%)
- Carpooled: 139 (5.4%)
- Railroad: 136 (5.3%)
- Bicycle: 5 (0.2%)
- Walked: 118 (4.6%)
- Other means: 24 (0.9%)
- Worked at home: 172 (6.7%)
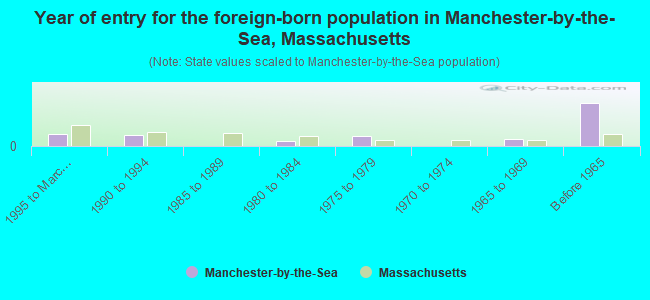
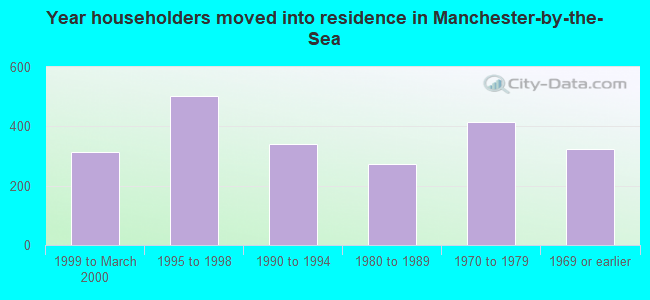
- Year of entry for the foreign-born population in Manchester-by-the-Sea, Massachusetts
- 351995 to March 2000
- 341990 to 1994
- 01985 to 1989
- 151980 to 1984
- 301975 to 1979
- 01970 to 1974
- 201965 to 1969
- 129Before 1965
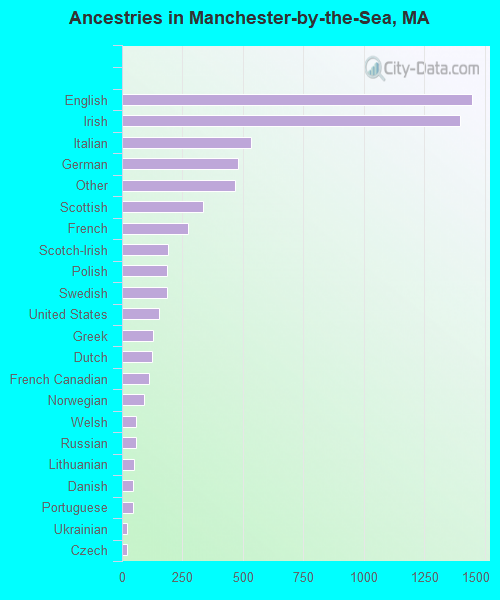
First ancestries reported:
- English: 1,445 (22.5%)
- Irish: 1,398 (21.7%)
- Italian: 534 (8.3%)
- German: 478 (7.4%)
- Other: 469 (7.3%)
- Scottish: 334 (5.2%)
- French: 274 (4.3%)
- Scotch-Irish: 190 (3.0%)
- Polish: 187 (2.9%)
- Swedish: 184 (2.9%)
- United States: 151 (2.3%)
- Greek: 128 (2.0%)
- Dutch: 124 (1.9%)
- French Canadian: 110 (1.7%)
- Norwegian: 92 (1.4%)
- Welsh: 59 (0.9%)
- Russian: 56 (0.9%)
- Lithuanian: 49 (0.8%)
- Danish: 44 (0.7%)
- Portuguese: 44 (0.7%)
- Ukrainian: 20 (0.3%)
- Czech: 19 (0.3%)
- Slovak: 11 (0.2%)
- Hungarian: 10 (0.2%)
- Swiss: 10 (0.2%)
- Arab: 7 (0.1%)
- West Indian: 7 (0.1%)
Most common places of birth for foreign-born residents (%):
| Manchester-by-the-Sea: | 21.3% (56) |
| Massachusetts: | 3.3% (25,403) |
| Manchester-by-the-Sea: | 16.0% (42) |
| Massachusetts: | 2.3% (17,987) |
| Manchester-by-the-Sea: | 14.4% (38) |
| Massachusetts: | 5.2% (40,247) |
| Manchester-by-the-Sea: | 9.9% (26) |
| Massachusetts: | 1.9% (14,883) |
| Manchester-by-the-Sea: | 8.4% (22) |
| Massachusetts: | 0.3% (2,470) |
| Manchester-by-the-Sea: | 8.0% (21) |
| Massachusetts: | 0.2% (1,418) |
| Manchester-by-the-Sea: | 3.8% (10) |
| Massachusetts: | 8.6% (66,627) |
| Manchester-by-the-Sea: | 3.4% (9) |
| Massachusetts: | 0.2% (1,303) |
| Manchester-by-the-Sea: | 3.4% (9) |
| Massachusetts: | 0.3% (2,242) |
| Manchester-by-the-Sea: | 3.4% (9) |
| Massachusetts: | 0.1% (417) |
| Manchester-by-the-Sea: | 3.0% (8) |
| Massachusetts: | 3.7% (28,319) |
| Manchester-by-the-Sea: | 2.7% (7) |
| Massachusetts: | 0.2% (1,273) |
| Manchester-by-the-Sea: | 2.3% (6) |
| Massachusetts: | 0.9% (7,258) |
Place of birth for U.S.-born residents:
- This state: 3,324
- Other state: 1,579
- Northeast: 958
- Midwest: 327
- South: 201
- West: 93
63% of Manchester-by-the-Sea residents lived in the same house 5 years ago.
Out of people who lived in different houses, 74% lived in this county.
Out of people who lived in different counties, 59% lived in Massachusetts.
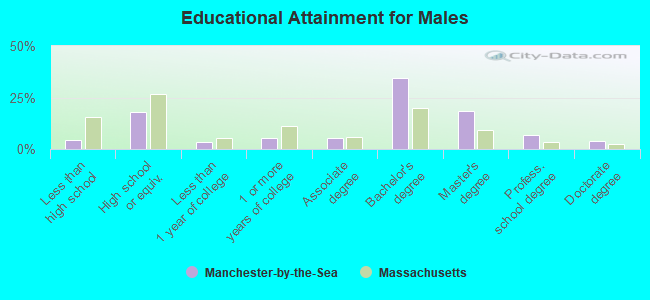
Education attainment for males 25 years and older:
- No schooling: 0
- Nursery to 4th grade: 0
- 5th and 6th grade: 10
- 7th and 8th grade: 0
- 9th grade: 8
- 10th grade: 34
- 11th grade: 5
- 12th grade, no diploma: 18
- High school graduate (or equivalency): 308
- Less than 1 year of college: 54
- Some college more than 1 year, no degree: 91
- Associate degree: 89
- Bachelor's degree: 592
- Master's degree: 315
- Professional school degree: 120
- Doctorate degree: 67
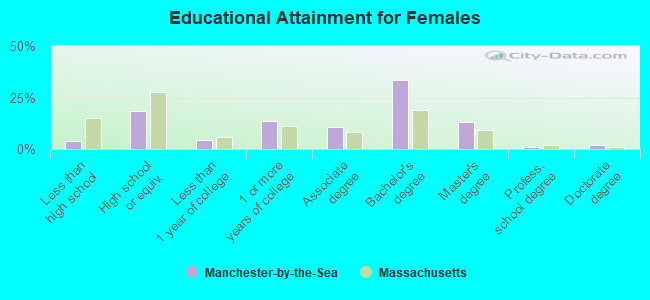
Education attainment for females 25 years and older:
- No schooling: 6
- Nursery to 4th grade: 0
- 5th and 6th grade: 8
- 7th and 8th grade: 10
- 9th grade: 0
- 10th grade: 50
- 11th grade: 0
- 12th grade, no diploma: 0
- High school graduate (or equivalency): 372
- Less than 1 year of college: 83
- Some college more than 1 year, no degree: 270
- Associate degree: 214
- Bachelor's degree: 665
- Master's degree: 257
- Professional school degree: 23
- Doctorate degree: 35
Housing units in structures:
- One, detached: 1,634
- One, attached: 22
- Two: 257
- 3 or 4: 189
- 5 to 9: 180
- 10 to 19: 45
Housing units lacking complete kitchen facilities: 0.4%
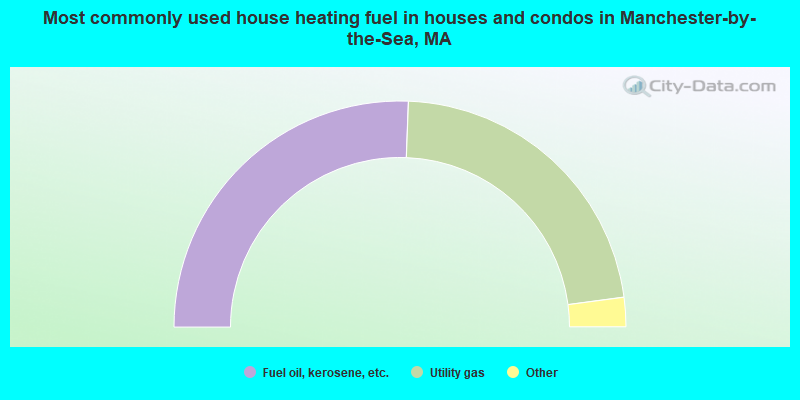
- 51.2%Fuel oil, kerosene, etc.
- 44.6%Utility gas
- 2.3%Electricity
- 1.8%Bottled, tank, or LP gas
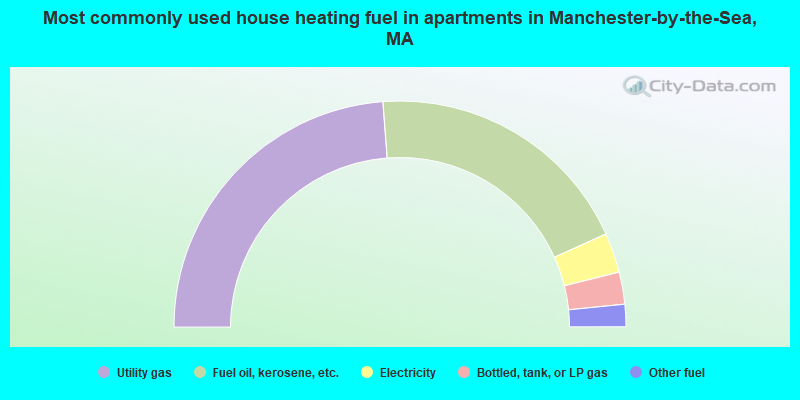
- 47.6%Utility gas
- 38.9%Fuel oil, kerosene, etc.
- 5.7%Electricity
- 4.6%Bottled, tank, or LP gas
- 3.2%Other fuel
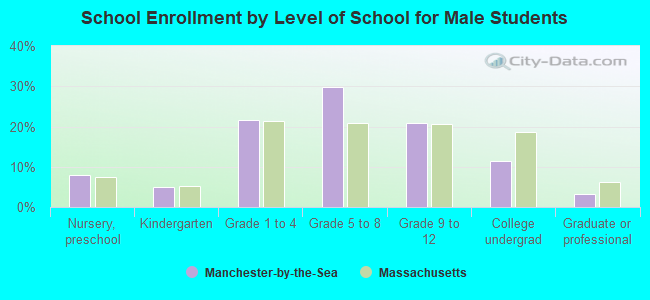
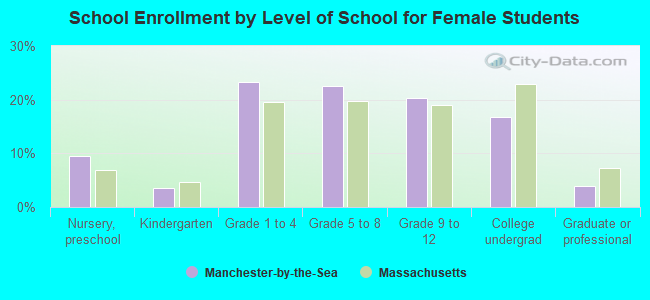
Private vs. public school enrollment:
| Here: | 13.9% |
| Massachusetts: | 10.8% |
| Here: | 22.6% |
| Massachusetts: | 12.2% |
| Here: | 48.3% |
| Massachusetts: | 48.2% |