Housing density: 1,554 houses/condos per square mile
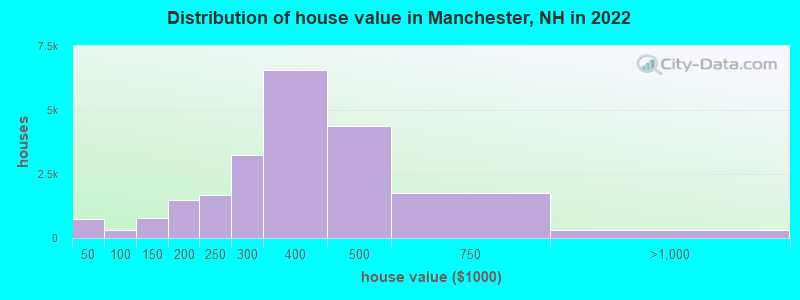
Median price asked for vacant for-sale houses and condos in 2022: $181,414.
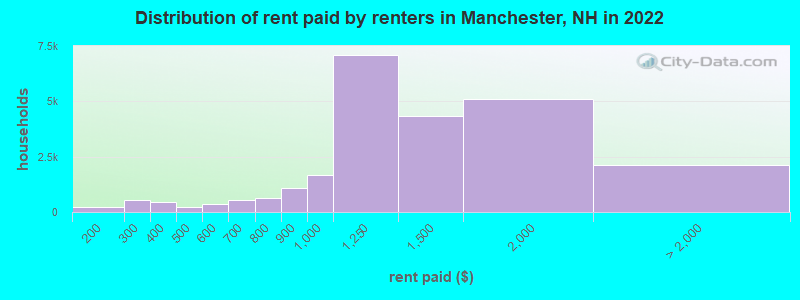
Median contract rent in 2022: $1,235 (lower quartile is $1,024, upper quartile is $1,540)
Median rent asked for vacant for-rent units in 2022: $1,110
Median gross rent in Manchester, NH in 2022: $1,438
Housing units in Manchester with a mortgage: 15,422 (1,541 second mortgage, 59 home equity loan, 1,401 both second mortgage and home equity loan) Houses without a mortgage: 661
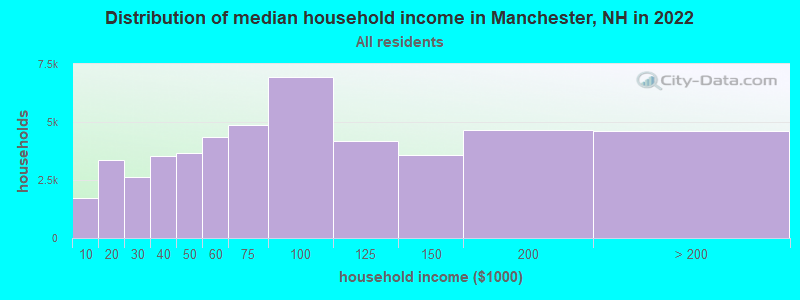
Median household income for houses/condos with a mortgage: $123,046
Median household income for apartments without a mortgage: $69,595
Size of family households: 12,972 2-persons, 5,826 3-persons, 5,606 4-persons, 2,601 5-persons, 565 6-persons, 280 7-or-more-persons.
Size of nonfamily households: 15,661 1-person, 4,056 2-persons, 501 3-persons.
8,823 married couples with children.
9,576 single-parent households (2,737 men, 6,839 women).
79.5% of residents of Manchester speak English at home.
9.3% of residents speak Spanish at home (47% speak English very well, 16% speak English well, 20% speak English not well, 17% don't speak English at all).
6.1% of residents speak other Indo-European language at home (67% speak English very well, 19% speak English well, 12% speak English not well, 2% don't speak English at all).
2.3% of residents speak Asian or Pacific Island language at home (42% speak English very well, 33% speak English well, 21% speak English not well, 4% don't speak English at all).
1.8% of residents speak other language at home (41% speak English very well, 30% speak English well, 21% speak English not well, 9% don't speak English at all).
Foreign born population: 14,574 (12.7%)
(66.6% of them are naturalized citizens)
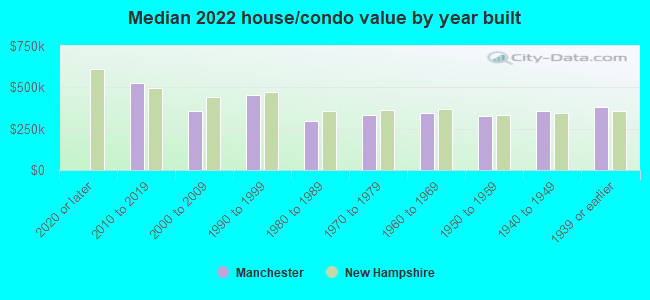
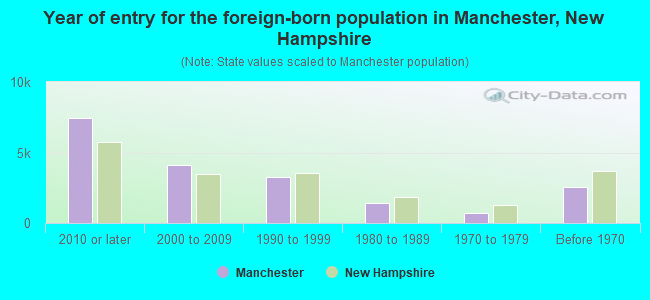
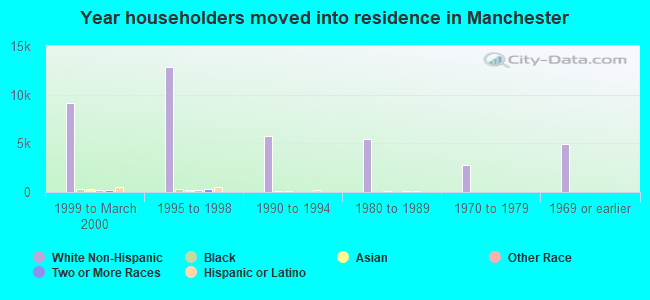
Year of entry for the foreign-born population in Manchester, New Hampshire
7,4322010 or later
4,0992000 to 2009
3,2791990 to 1999
1,4271980 to 1989
7031970 to 1979
2,569Before 1970
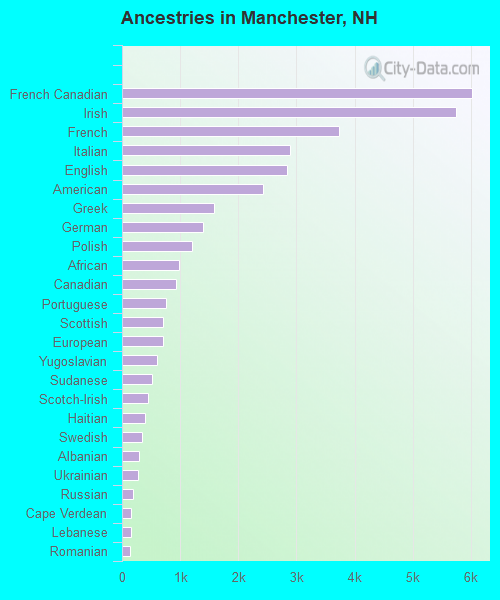
First ancestries reported:
French Canadian: 6,012 (10.9%)
Irish: 5,743 (10.4%)
French: 3,729 (6.7%)
Italian: 2,887 (5.2%)
English: 2,830 (5.1%)
American: 2,420 (4.4%)
Greek: 1,576 (2.8%)
German: 1,400 (2.5%)
Polish: 1,211 (2.2%)
African: 972 (1.8%)
Canadian: 931 (1.7%)
Portuguese: 760 (1.4%)
Scottish: 706 (1.3%)
European: 701 (1.3%)
Yugoslavian: 598 (1.1%)
Sudanese: 511 (0.9%)
Scotch-Irish: 448 (0.8%)
Haitian: 393 (0.7%)
Swedish: 342 (0.6%)
Albanian: 301 (0.5%)
Ukrainian: 279 (0.5%)
Russian: 192 (0.3%)
Cape Verdean: 162 (0.3%)
Lebanese: 156 (0.3%)
Romanian: 144 (0.3%)
Brazilian: 137 (0.2%)
West Indian: 136 (0.2%)
Eastern European: 132 (0.2%)
Turkish: 126 (0.2%)
Somali: 123 (0.2%)
Jordanian: 121 (0.2%)
Norwegian: 117 (0.2%)
Welsh: 114 (0.2%)
Jamaican: 103 (0.2%)
Iraqi: 101 (0.2%)
British: 93 (0.2%)
Afghan: 83 (0.1%)
Finnish: 75 (0.1%)
Zimbabwean: 74 (0.1%)
Hungarian: 58 (0.1%)
Armenian: 57 (0.1%)
Northern European: 55 (0.10%)
Lithuanian: 54 (0.10%)
Scandinavian: 53 (0.10%)
Kenyan: 52 (0.09%)
Liberian: 51 (0.09%)
Egyptian: 49 (0.09%)
Iranian: 48 (0.09%)
Serbian: 45 (0.08%)
Bulgarian: 43 (0.08%)
Guyanese: 23 (0.04%)
British West Indian: 22 (0.04%)
Slavic: 21 (0.04%)
Slovak: 19 (0.03%)
Belgian: 18 (0.03%)
Danish: 17 (0.03%)
Swiss: 17 (0.03%)
Barbadian: 17 (0.03%)
Latvian: 13 (0.02%)
Maltese: 12 (0.02%)
Dutch: 11 (0.02%)
Czechoslovakian: 10 (0.02%)
Nigerian: 9 (0.02%)
Slovene: 9 (0.02%)
Croatian: 5 (0.01%)
Most common places of birth for foreign-born residents (%):
Dominican Republic
Manchester:
8.6% (1,510)
New Hampshire:
7.0% (5,842)
Canada
Manchester:
6.2% (1,095)
New Hampshire:
9.1% (7,618)
Nepal
Manchester:
6.0% (1,047)
New Hampshire:
2.5% (2,112)
Honduras
Manchester:
5.7% (1,002)
New Hampshire:
1.5% (1,270)
Vietnam
Manchester:
5.0% (868)
New Hampshire:
2.2% (1,838)
India
Manchester:
4.2% (733)
New Hampshire:
9.1% (7,609)
Brazil
Manchester:
3.3% (578)
New Hampshire:
3.6% (2,964)
Guatemala
Manchester:
3.3% (572)
New Hampshire:
1.1% (913)
Other Eastern Africa
Manchester:
3.2% (558)
New Hampshire:
0.8% (653)
El Salvador
Manchester:
3.1% (548)
New Hampshire:
1.3% (1,066)
Bosnia and Herzegovina
Manchester:
3.1% (542)
New Hampshire:
1.3% (1,068)
Mexico
Manchester:
2.9% (515)
New Hampshire:
2.0% (1,650)
Bhutan
Manchester:
2.4% (424)
New Hampshire:
1.0% (799)
Democratic Republic of Congo (Zaire)
Manchester:
2.3% (407)
New Hampshire:
0.5% (437)
Colombia
Manchester:
2.2% (381)
New Hampshire:
1.4% (1,179)
Haiti
Manchester:
2.2% (378)
New Hampshire:
0.9% (735)
China, excluding Hong Kong and Taiwan
Manchester:
2.0% (355)
New Hampshire:
4.5% (3,775)
Nicaragua
Manchester:
2.0% (342)
New Hampshire:
0.4% (357)
Philippines
Manchester:
1.5% (270)
New Hampshire:
3.3% (2,768)
Place of birth for U.S.-born residents:
This state: 53,431
Other state: 45,478
Northeast: 33,560
Midwest: 3,266
South: 6,028
West: 2,624
87.1% of Manchester residents lived in the same house 1 years ago. Out of people who lived in different houses, 33.9% lived in this county. Out of people who lived in different counties, 39.6% lived in New Hampshire.
Manchester:
87.1%
State average:
89.8%
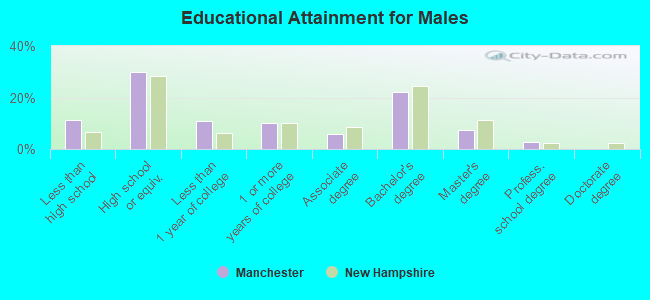
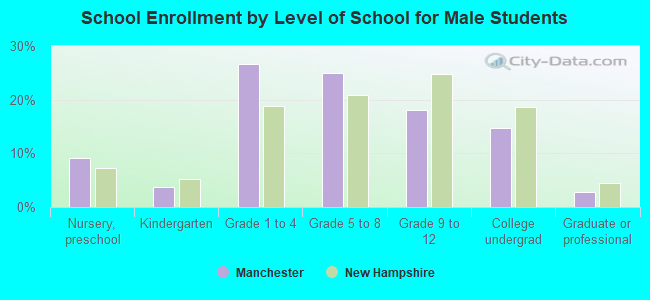
Education attainment for males 25 years and older:
No schooling: 887
Nursery to 4th grade: 124
5th and 6th grade: 96
7th and 8th grade: 742
9th grade: 583
10th grade: 327
11th grade: 697
12th grade, no diploma: 1,298
High school graduate (or equivalency): 12,442
Less than 1 year of college: 4,482
Some college more than 1 year, no degree: 4,239
Associate degree: 2,411
Bachelor's degree: 9,210
Master's degree: 3,111
Professional school degree: 1,124
Doctorate degree: 41
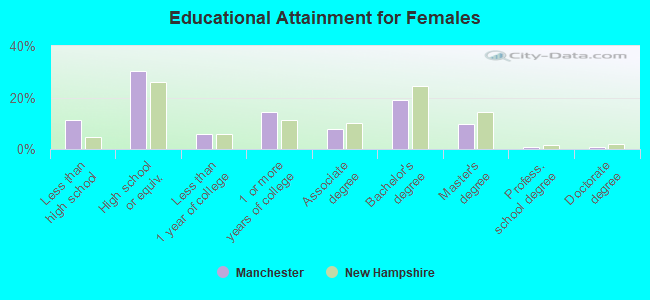
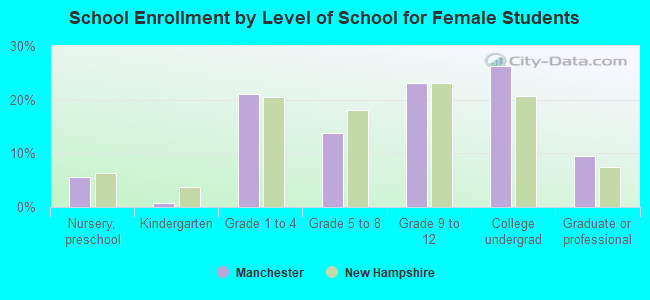
Education attainment for females 25 years and older:
No schooling: 350
Nursery to 4th grade: 103
5th and 6th grade: 322
7th and 8th grade: 717
9th grade: 550
10th grade: 476
11th grade: 1,026
12th grade, no diploma: 1,130
High school graduate (or equivalency): 12,477
Less than 1 year of college: 2,332
Some college more than 1 year, no degree: 5,965
Associate degree: 3,228
Bachelor's degree: 7,934
Master's degree: 4,070
Professional school degree: 294
Doctorate degree: 315
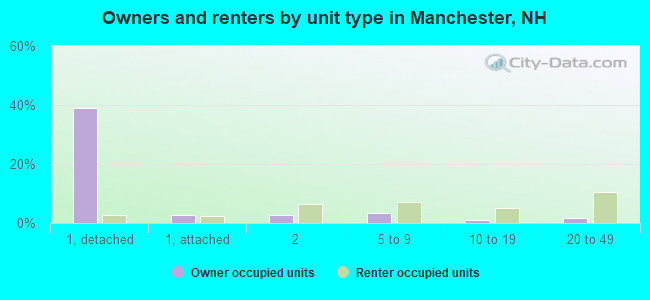
Housing units in structures:
One, detached: 20,249
One, attached: 2,306
Two: 5,006
3 or 4: 5,409
5 to 9: 5,706
10 to 19: 3,103
20 to 49: 6,421
50 or more: 2,836
Mobile homes: 275
Median worth of mobile homes: $81,734
Housing units lacking complete plumbing facilities in 2022: 0.5%
Housing units lacking complete kitchen facilities in 2022: 0.4%
House/condo owner moved in on average 12 years ago