Housing density: 890 houses/condos per square mile
Median price asked for vacant for-sale houses and condos in 2022 in this county: $360,195.
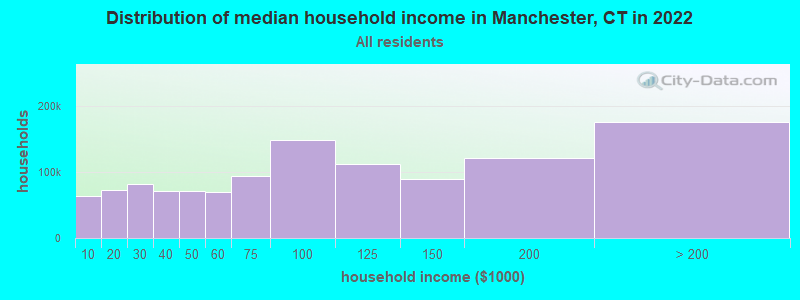
Median contract rent in 2022: $1,309 (lower quartile is $999, upper quartile is $1,660)
Median rent asked for vacant for-rent units in 2022: $1,394
Median gross rent in Manchester, CT in 2022: $1,505
Housing units in Manchester with a mortgage: 7,867 (923 second mortgage, 906 home equity loan, 21 both second mortgage and home equity loan) Houses without a mortgage: 3,426
In family households: 715,089 (143,179 male householders, 84,652 female householders)
161,327 spouses, 258,438 children (243,975 natural, 5,783 adopted, 8,680 stepchildren), 15,602 grandchildren, 8,779 brothers or sisters, 9,385 parents, foster children, 10,085 other relatives, 18,701 non-relatives
In nonfamily households: 150,698 (54,155 male householders (41,831 living alone)), 68,868 female householders (58,693 living alone)), 27,675 nonrelatives
In group quarters: 28,227 (15,383 institutionalized population)
135,700 married couples with children.
56,984 single-parent households (8,611 men, 48,373 women).
86.3% of residents of Manchester speak English at home.
5.6% of residents speak Spanish at home (78% speak English very well, 13% speak English well, 7% speak English not well, 2% don't speak English at all).
5.5% of residents speak other Indo-European language at home (65% speak English very well, 25% speak English well, 9% speak English not well, 1% don't speak English at all).
2.2% of residents speak Asian or Pacific Island language at home (49% speak English very well, 34% speak English well, 14% speak English not well, 2% don't speak English at all).
0.5% of residents speak other language at home (79% speak English very well, 12% speak English well, 3% speak English not well, 6% don't speak English at all).
Foreign born population: 7,118 (12.4%)
(54.6% of them are naturalized citizens)
Year of entry for the foreign-born population in Manchester, Connecticut
1,2501995 to March 2000
7511990 to 1994
5621985 to 1989
3761980 to 1984
2881975 to 1979
2621970 to 1974
2131965 to 1969
948Before 1965
First ancestries reported:
Other: 11,502 (17.8%)
Irish: 11,008 (17.0%)
Italian: 7,905 (12.2%)
English: 6,148 (9.5%)
German: 5,612 (8.7%)
French: 4,882 (7.5%)
Polish: 4,593 (7.1%)
French Canadian: 2,577 (4.0%)
United States: 2,002 (3.1%)
Swedish: 1,275 (2.0%)
Scottish: 1,123 (1.7%)
Scotch-Irish: 715 (1.1%)
Russian: 602 (0.9%)
Lithuanian: 566 (0.9%)
West Indian: 549 (0.8%)
Dutch: 440 (0.7%)
Portuguese: 431 (0.7%)
Danish: 367 (0.6%)
Norwegian: 334 (0.5%)
Hungarian: 323 (0.5%)
Greek: 285 (0.4%)
Ukrainian: 262 (0.4%)
Welsh: 231 (0.4%)
Czech: 218 (0.3%)
Subsaharan African: 207 (0.3%)
Swiss: 200 (0.3%)
Arab: 180 (0.3%)
Slovak: 145 (0.2%)
Most common places of birth for foreign-born residents (%):
Canada
Manchester:
11.9% (553)
Connecticut:
5.2% (19,083)
India
Manchester:
10.3% (477)
Connecticut:
4.1% (15,108)
Jamaica
Manchester:
6.9% (319)
Connecticut:
7.2% (26,819)
Philippines
Manchester:
4.8% (223)
Connecticut:
1.7% (6,247)
Germany
Manchester:
4.4% (206)
Connecticut:
3.1% (11,432)
Vietnam
Manchester:
3.8% (175)
Connecticut:
1.8% (6,680)
Colombia
Manchester:
3.6% (167)
Connecticut:
3.2% (12,009)
United Kingdom
Manchester:
3.5% (162)
Connecticut:
4.4% (16,395)
Poland
Manchester:
3.4% (160)
Connecticut:
6.9% (25,507)
Laos
Manchester:
3.3% (154)
Connecticut:
0.7% (2,692)
Italy
Manchester:
3.0% (141)
Connecticut:
7.0% (26,023)
Pakistan
Manchester:
2.7% (126)
Connecticut:
0.9% (3,317)
Korea
Manchester:
2.6% (121)
Connecticut:
1.5% (5,508)
Peru
Manchester:
2.5% (114)
Connecticut:
2.1% (7,612)
Other Eastern Europe
Manchester:
2.1% (96)
Connecticut:
2.1% (7,596)
Ireland
Manchester:
1.8% (83)
Connecticut:
1.2% (4,344)
Romania
Manchester:
1.8% (83)
Connecticut:
0.6% (2,371)
Dominican Republic
Manchester:
1.7% (77)
Connecticut:
2.3% (8,500)
Place of birth for U.S.-born residents:
This state: 33,171
Other state: 15,928
Northeast: 11,278
Midwest: 1,665
South: 2,317
West: 668
53% of Manchester residents lived in the same house 5 years ago. Out of people who lived in different houses, 64% lived in this county. Out of people who lived in different counties, 50% lived in Connecticut.
Education attainment for males 25 years and older:
No schooling: 72
Nursery to 4th grade: 26
5th and 6th grade: 148
7th and 8th grade: 394
9th grade: 385
10th grade: 385
11th grade: 234
12th grade, no diploma: 502
High school graduate (or equivalency): 4,816
Less than 1 year of college: 1,370
Some college more than 1 year, no degree: 2,202
Associate degree: 1,279
Bachelor's degree: 3,422
Master's degree: 1,578
Professional school degree: 522
Doctorate degree: 208
Education attainment for females 25 years and older:
No schooling: 166
Nursery to 4th grade: 20
5th and 6th grade: 152
7th and 8th grade: 479
9th grade: 326
10th grade: 478
11th grade: 406
12th grade, no diploma: 575
High school graduate (or equivalency): 6,255
Less than 1 year of college: 1,525
Some college more than 1 year, no degree: 2,663
Associate degree: 1,977
Bachelor's degree: 3,440
Master's degree: 1,583
Professional school degree: 370
Doctorate degree: 67
Housing units in structures:
One, detached: 11,586
One, attached: 1,587
Two: 2,757
3 or 4: 2,104
5 to 9: 1,883
10 to 19: 1,915
20 to 49: 993
50 or more: 1,415
Mobile homes: 16
Median worth of mobile homes: $75,296
Housing units lacking complete plumbing facilities: 0.4%
Housing units lacking complete kitchen facilities: 0.3%