Luray, TN (Tennessee) Houses and Residents
| Luray: | $172,339 |
| Tennessee: | $284,800 |
Total population: 5,102 (Urban population: 0, Rural population: 4,878 (204 farm, 4,674 nonfarm))
Houses: 2,097 (1,903 occupied: 1,630 owner occupied, 273 renter occupied)
| % of renters here: | 14% |
| State: | 33% |
Housing density: 17 houses/condos per square mile
Median price asked for vacant for-sale houses and condos in 2022 in this county: $218,749.
Median contract rent in 2022: $627 (lower quartile is $457, upper quartile is $773)
Median rent asked for vacant for-rent units in 2022: $423
Median gross rent in Luray, TN in 2022: $902
Housing units in Luray with a mortgage: 465 (20 second mortgage, 0 home equity loan, 0 both second mortgage and home equity loan)
Houses without a mortgage: 349


Household type by relationship:
Households: 27,551- In family households: 23,558 (5,447 male householders, 2,314 female householders)
5,766 spouses, 7,811 children (6,973 natural, 176 adopted, 662 stepchildren), 808 grandchildren, 153 brothers or sisters, 184 parents, foster children, 303 other relatives, 619 non-relatives
- In nonfamily households: 3,993 (1,585 male householders (1,323 living alone)), 1,878 female householders (1,714 living alone)), 530 nonrelatives
- In group quarters: 218 (211 institutionalized population)
4,114 married couples with children.
1,414 single-parent households (317 men, 1,097 women).
98.0% of residents of Luray speak English at home.
1.5% of residents speak Spanish at home (93% speak English very well, 7% speak English not well).
0.5% of residents speak other Indo-European language at home (48% speak English very well, 33% speak English well, 19% speak English not well).
Foreign born population: 10 (0.2%)
(120.0% of them are naturalized citizens)
| Here: | 6.3 |
| State: | 6.5 |
| Here: | 4.9 |
| State: | 4.4 |

- Bedrooms in owner-occupied houses and condos in Luray, Tennessee
- 13no bedroom
- 221 bedroom
- 4022 bedrooms
- 9643 bedrooms
- 1964 bedrooms
- 335+ bedrooms

- Bedrooms in renter-occupied apartments in Luray, Tennessee
- 9no bedroom
- 01 bedroom
- 1452 bedrooms
- 1133 bedrooms
- 64 bedrooms
- 05+ bedrooms

- Cars and other vehicles available in Luray in owner-occupied houses/condos
- 75no vehicle
- 3561 vehicle
- 7662 vehicles
- 2803 vehicles
- 1014 vehicles
- 525+ vehicles

- Cars and other vehicles available in Luray in renter-occupied apartments
- 37no vehicle
- 1211 vehicle
- 902 vehicles
- 253 vehicles
- 04 vehicles
- 05+ vehicles

- Rooms in owner-occupied houses in Luray, Tennessee
- 81 room
- 52 rooms
- 363 rooms
- 2244 rooms
- 5055 rooms
- 3866 rooms
- 2157 rooms
- 1088 rooms
- 1439+ rooms

- Rooms in renter-occupied apartments in Luray, Tennessee
- 91 room
- 02 rooms
- 233 rooms
- 864 rooms
- 745 rooms
- 496 rooms
- 177 rooms
- 88 rooms
- 79+ rooms


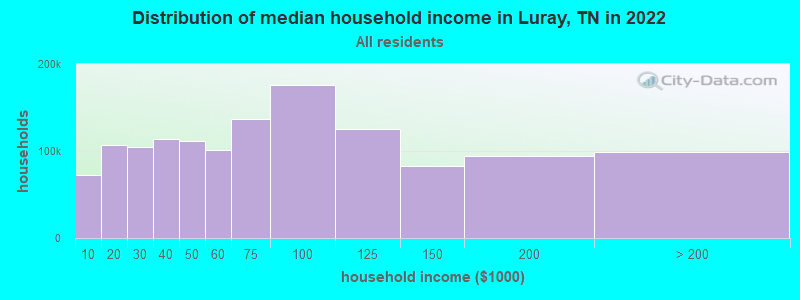
Luray, TN household income distribution

- 47,594Less than $10,000
- 79,830$10,000 to $19,999
- 75,708$20,000 to $29,999
- 77,408$30,000 to $39,999
- 74,843$40,000 to $49,999
- 69,274$50,000 to $59,999
- 94,447$60,000 to $74,999
- 120,384$75,000 to $99,999
- 90,034$100,000 to $124,999
- 53,628$125,000 to $149,999
- 58,862$150,000 to $199,999
- 49,759$200,000 or more
Percentage of workers working in this county: 57.7%
Number of people working at home: 248 (9.8% of all workers)
Travel time to work (commute)
- Less than 5 minutes: 38
- 5 to 9 minutes: 76
- 10 to 14 minutes: 139
- 15 to 19 minutes: 415
- 20 to 24 minutes: 488
- 25 to 29 minutes: 227
- 30 to 34 minutes: 420
- 35 to 39 minutes: 84
- 40 to 44 minutes: 64
- 45 to 59 minutes: 155
- 60 to 89 minutes: 56
- 90 or more minutes: 56
Means of transportation to work:
- Drove a car alone: 1,877 (83.1%)
- Carpooled: 296 (13.1%)
- Motorcycle: 5 (0.2%)
- Walked: 20 (0.9%)
- Other means: 20 (0.9%)
- Worked at home: 42 (1.9%)


- Year of entry for the foreign-born population in Luray, Tennessee
- 01995 to March 2000
- 01990 to 1994
- 01985 to 1989
- 01980 to 1984
- 01975 to 1979
- 01970 to 1974
- 01965 to 1969
- 5Before 1965
Most common places of birth for foreign-born residents (%):
| Luray: | 100.0% (5) |
| Tennessee: | 0.6% (937) |
Place of birth for U.S.-born residents:
- This state: 3,719
- Other state: 1,154
- Northeast: 75
- Midwest: 538
- South: 387
- West: 154
62% of Luray residents lived in the same house 5 years ago.
Out of people who lived in different houses, 53% lived in this county.
Out of people who lived in different counties, 58% lived in Tennessee.
Education attainment for males 25 years and older:
- No schooling: 6
- Nursery to 4th grade: 11
- 5th and 6th grade: 43
- 7th and 8th grade: 163
- 9th grade: 101
- 10th grade: 81
- 11th grade: 91
- 12th grade, no diploma: 62
- High school graduate (or equivalency): 672
- Less than 1 year of college: 65
- Some college more than 1 year, no degree: 85
- Associate degree: 71
- Bachelor's degree: 83
- Master's degree: 9
- Professional school degree: 18
- Doctorate degree: 0

Education attainment for females 25 years and older:
- No schooling: 26
- Nursery to 4th grade: 0
- 5th and 6th grade: 24
- 7th and 8th grade: 163
- 9th grade: 74
- 10th grade: 109
- 11th grade: 55
- 12th grade, no diploma: 81
- High school graduate (or equivalency): 686
- Less than 1 year of college: 87
- Some college more than 1 year, no degree: 152
- Associate degree: 62
- Bachelor's degree: 81
- Master's degree: 37
- Professional school degree: 19
- Doctorate degree: 5


Housing units in structures:
- One, detached: 1,342
- Mobile homes: 755
Median worth of mobile homes: $71,160
Housing units lacking complete kitchen facilities: 2.3%

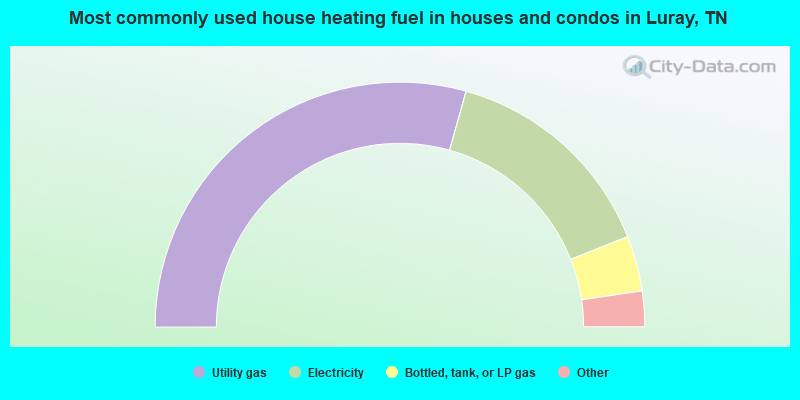
- 58.7%Utility gas
- 29.3%Electricity
- 7.3%Bottled, tank, or LP gas
- 3.1%Wood
- 1.5%Fuel oil, kerosene, etc.
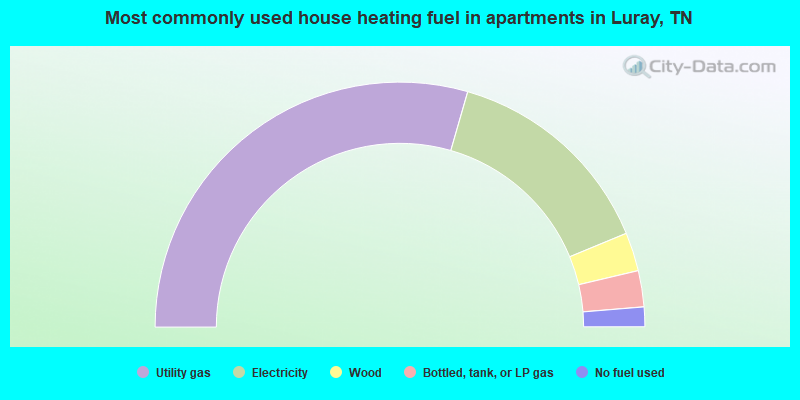
- 59.0%Utility gas
- 28.6%Electricity
- 5.1%Wood
- 4.8%Bottled, tank, or LP gas
- 2.6%No fuel used
Private vs. public school enrollment:
| Here: | 3.4% |
| Tennessee: | 9.5% |
| Here: | 0.0% |
| Tennessee: | 10.4% |
| Here: | 43.6% |
| Tennessee: | 22.8% |


