Luray, SC (South Carolina) Houses and Residents
| Luray: | |
| South Carolina: |
Mean price in 2022:
Detached houses: $93,934
Here: $93,934 State: $368,255 Mobile homes: $145,889
Here: $145,889 State: $102,531
Total population: 124 (Urban population: 0, Rural population: 98 (all nonfarm))
Houses: 79 (56 occupied: 35 owner occupied, 22 renter occupied)
| % of renters here: | 39% |
| State: | 28% |
Housing density: 74 houses/condos per square mile
Median price asked for vacant for-sale houses and condos in 2022 in this county: $52,611.
Housing units in Luray with a mortgage: 2 (0 second mortgage, 0 home equity loan, 0 both second mortgage and home equity loan)
Houses without a mortgage: 1
Median household income for apartments without a mortgage: $86,439
Median monthly housing costs: $-655,957,161
Compare current foreclosures near Luray, SC:
| Photo | Address | Area | Beds / Baths | Price | Details |
|---|---|---|---|---|---|

|
#1
Gum St E
Allendale, SC 29810
|
1,337 sq. feet
|
1 baths 3 beds |
show details | |

|
#2
Dunbar St
Allendale, SC 29810
|
2,012 sq. feet
|
2 baths 3 beds |
show details | |

|
#3
Newington Hwy
Sylvania, GA 30467
|
1,412 sq. feet
|
6 baths 6 beds |
show details | |

|
#4
Palmetto Ave W
Varnville, SC 29944
|
1,507 sq. feet
|
1 baths - beds |
show details | |

|
#5
Newington Hwy
Sylvania, GA 30467
|
- sq. feet
|
- baths - beds |
show details | |

|
#6
Gill Rd
Allendale, SC 29810
|
1,716 sq. feet
|
- baths - beds |
show details | |

|
#7
Bamberg Hwy
Brunson, SC 29911
|
- sq. feet
|
- baths - beds |
show details | |

|
#8
Porter Rd
Early Branch, SC 29916
|
- sq. feet
|
- baths - beds |
show details | |

|
#9
Short St
Allendale, SC 29810
|
833 sq. feet
|
- baths - beds |
show details | |

|
#10
Walterboro Hwy
Varnville, SC 29944
|
- sq. feet
|
- baths - beds |
show details |
| Photo | Address | Area | Beds / Baths | Price | Details |
|---|---|---|---|---|---|

|
#11
Rivers Hill Rd
Pineland, SC 29934
|
- sq. feet
|
- baths - beds |
show details | |

|
#12
Wagon Wheel Rd
Hampton, SC 29924
|
- sq. feet
|
- baths - beds |
show details | |

|
#13
Liberty Ave N
Estill, SC 29918
|
- sq. feet
|
- baths - beds |
show details | |

|
#14
7th St E
Fairfax, SC 29827
|
- sq. feet
|
- baths - beds |
show details | |

|
#15
Folk St E
Fairfax, SC 29827
|
- sq. feet
|
- baths - beds |
show details | |

|
#16
Mail Carriage Rd
Estill, SC 29918
|
- sq. feet
|
- baths - beds |
show details | |

|
#17
Isiah Loop
Brunson, SC 29911
|
- sq. feet
|
- baths - beds |
show details | |

|
#18
Chocolate City Rd
Estill, SC 29918
|
- sq. feet
|
- baths - beds |
show details | |

|
#19
Honey Hill Rd
Estill, SC 29918
|
- sq. feet
|
- baths - beds |
show details | |

|
#20
Speed Limit Rd
Varnville, SC 29944
|
- sq. feet
|
- baths - beds |
show details |
| Photo | Address | Area | Beds / Baths | Price | Details |
|---|---|---|---|---|---|

|
#21
Rainbow Bnd
Varnville, SC 29944
|
- sq. feet
|
- baths - beds |
show details | |

|
#22
Schley St
Hampton, SC 29924
|
- sq. feet
|
- baths - beds |
show details | |

|
#23
1st St W
Hampton, SC 29924
|
- sq. feet
|
- baths - beds |
show details | |

|
#24
Swan Rd
Varnville, SC 29944
|
- sq. feet
|
- baths - beds |
show details | |

|
#25
Folk St E
Fairfax, SC 29827
|
- sq. feet
|
- baths - beds |
show details | |

|
#26
Sandy Run Rd
Varnville, SC 29944
|
- sq. feet
|
- baths - beds |
show details | |

|
#27
Wade Hampton Rd
Hampton, SC 29924
|
- sq. feet
|
- baths - beds |
show details | |

|
#28
Nix St W
Hampton, SC 29924
|
- sq. feet
|
- baths - beds |
show details | |

|
#29
Cypress Creek Rd
Pineland, SC 29934
|
- sq. feet
|
- baths - beds |
show details | |

|
#30
Mill Pond Rd
Varnville, SC 29944
|
- sq. feet
|
- baths - beds |
show details |
| Photo | Address | Area | Beds / Baths | Price | Details |
|---|---|---|---|---|---|

|
#31
Glendale St
Hampton, SC 29924
|
- sq. feet
|
- baths - beds |
show details | |

|
#32
Washington Ln
Estill, SC 29918
|
- sq. feet
|
- baths - beds |
show details | |

|
Check over 1 million property listings on Foreclosure.com!
|
browse all offers | |||

Latest news about housing in Luray, SC collected exclusively by city-data.com from local newspapers, TV, and radio stations


Median year apartment built: 1992
Household type by relationship:
Households: 180- Male householders: 40 (5 living alone), Female householders: 16 (2 living alone)
35 spouses (35 opposite-sex spouses), 0 unmarried partners, (0 opposite-sex unmarried partners), 83 children (83 natural, 0 adopted, 0 stepchildren), 0 grandchildren, 0 brothers or sisters, 0 parents, 0 foster children, 5 other relatives, 0 non-relatives
Size of family households: 22 2-persons, 3 3-persons, 24 4-persons.
Size of nonfamily households: 7 1-person.
6 married couples with children.
4 single-parent households (0 men, 4 women).
35.4% of residents of Luray speak English at home.
65.2% of residents speak Spanish at home (53% speak English very well, 39% speak English well, 4% speak English not well, 3% don't speak English at all).
Foreign born population: 71 (39.4%)
(8.5% of them are naturalized citizens)
| Here: | 4.7 |
| State: | 6.4 |
| Here: | 5.8 |
| State: | 4.5 |

- Bedrooms in owner-occupied houses and condos in Luray, South Carolina
- 0no bedroom
- 01 bedroom
- 12 bedrooms
- 333 bedrooms
- 24 bedrooms
- 05+ bedrooms

- Bedrooms in renter-occupied apartments in Luray, South Carolina
- 0no bedroom
- 01 bedroom
- 02 bedrooms
- 203 bedrooms
- 24 bedrooms
- 05+ bedrooms

- Cars and other vehicles available in Luray in owner-occupied houses/condos
- 4no vehicle
- 21 vehicle
- 02 vehicles
- 183 vehicles
- 114 vehicles
- 15+ vehicles

- Cars and other vehicles available in Luray in renter-occupied apartments
- 4no vehicle
- 11 vehicle
- 52 vehicles
- 03 vehicles
- 124 vehicles
- 05+ vehicles

- Rooms in owner-occupied houses in Luray, South Carolina
- 01 room
- 02 rooms
- 03 rooms
- 154 rooms
- 165 rooms
- 26 rooms
- 17 rooms
- 28 rooms
- 09+ rooms

- Rooms in renter-occupied apartments in Luray, South Carolina
- 01 room
- 02 rooms
- 03 rooms
- 04 rooms
- 55 rooms
- 176 rooms
- 07 rooms
- 08 rooms
- 09+ rooms


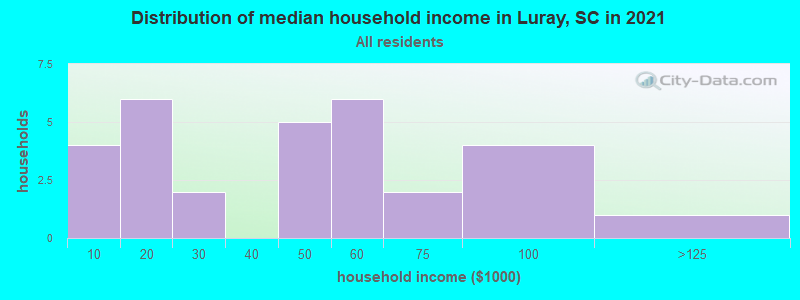
Luray, SC household income distribution

- 4Less than $10,000
- 2$10,000 to $19,999
- 2$20,000 to $29,999
- 6$30,000 to $39,999
- 7$40,000 to $49,999
- 16$50,000 to $59,999
- 16$75,000 to $99,999
- 3$100,000 to $124,999
- 1$125,000 to $149,999
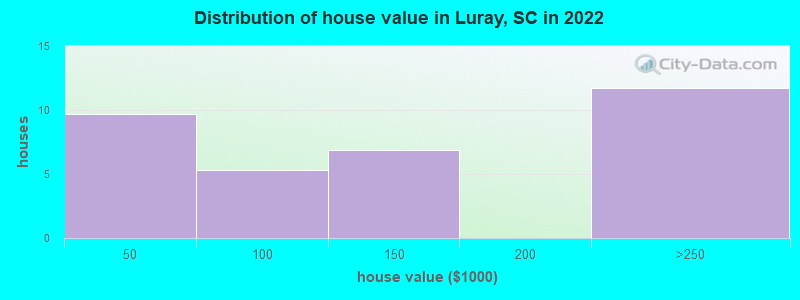
Home value of owner - occupied houses in 2022 in Luray, SC
-
- 3Less than $10,000
- 3$20,000 to $24,999
- 1$35,000 to $39,999
- 1$40,000 to $49,999
- 2$50,000 to $59,999
- 1$70,000 to $79,999
- 6$100,000 to $124,999
- 0$125,000 to $149,999
- 11$200,000 to $249,999
Rent paid by renters in 2022 in Luray, SC
-
- 3$350 to $399
- 0$550 to $599
- 11$750 to $799
- 4$1,000 to $1,249
- 0No cash rent


Percentage of workers working in this county: 34.8%
Number of people working at home: 0 (0.0% of all workers)
Travel time to work (commute)
- Less than 5 minutes: 4
- 5 to 9 minutes: 21
- 10 to 14 minutes: 4
- 15 to 19 minutes: 15
- 20 to 24 minutes: 0
- 25 to 29 minutes: 0
- 30 to 34 minutes: 2
- 35 to 39 minutes: 0
- 40 to 44 minutes: 0
- 45 to 59 minutes: 3
- 60 to 89 minutes: 39
- 90 or more minutes: 18
Means of transportation to work:
- Drove a car alone: 25 (80.6%)
- Carpooled: 2 (6.5%)
- Bus or trolley bus: 4 (12.9%)

- Unemployment by race in 2022
- Unemployment rate for White non-Hispanic residents
- 75.8%Females
- Unemployment rate for Black residents
- 24.7%Males
- 23.9%Females

- Year of entry for the foreign-born population in Luray, South Carolina
- 522010 or later
- 192000 to 2009
- 31990 to 1999
- 111980 to 1989
- 01970 to 1979
- 0Before 1970
Most common places of birth for foreign-born residents (%):
| Luray: | 93.0% (66) |
| South Carolina: | 22.5% (60,774) |
Place of birth for U.S.-born residents:
- This state: 80
- Other state: 21
- Northeast: 5
- Midwest: 3
- South: 12
- West: 0
100.0% of Luray residents lived in the same house 1 years ago.
| Luray: | 100.0% |
| State average: | 86.5% |
Education attainment for males 25 years and older:
- No schooling: 7
- Nursery to 4th grade: 0
- 5th and 6th grade: 0
- 7th and 8th grade: 0
- 9th grade: 0
- 10th grade: 6
- 11th grade: 0
- 12th grade, no diploma: 0
- High school graduate (or equivalency): 53
- Less than 1 year of college: 0
- Some college more than 1 year, no degree: 1
- Associate degree: 0
- Bachelor's degree: 5
- Master's degree: 0
- Professional school degree: 0
- Doctorate degree: 0

Education attainment for females 25 years and older:
- No schooling: 0
- Nursery to 4th grade: 0
- 5th and 6th grade: 0
- 7th and 8th grade: 4
- 9th grade: 0
- 10th grade: 7
- 11th grade: 0
- 12th grade, no diploma: 0
- High school graduate (or equivalency): 15
- Less than 1 year of college: 0
- Some college more than 1 year, no degree: 9
- Associate degree: 0
- Bachelor's degree: 1
- Master's degree: 0
- Professional school degree: 0
- Doctorate degree: 0


Housing units in structures:
- One, detached: 22
- One, attached: 4
- Mobile homes: 52
House/condo owner moved in on average 12 years ago
Renter moved in on average 5 years ago

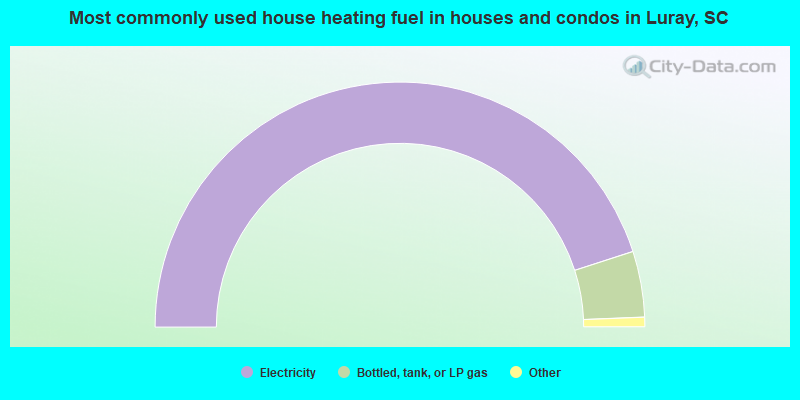
- 91.2%Electricity
- 8.8%Bottled, tank, or LP gas
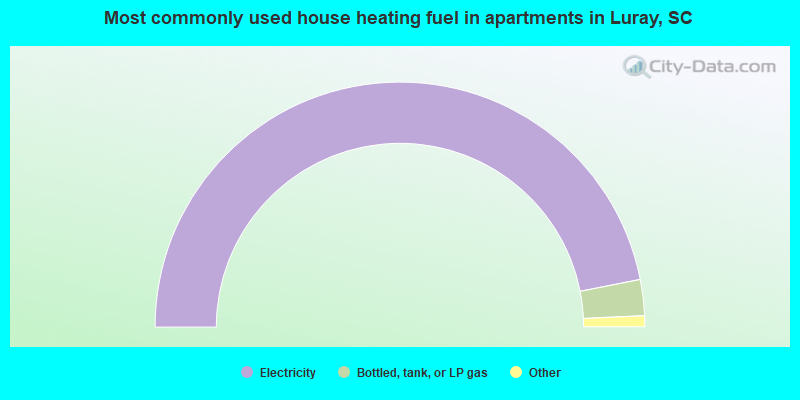
- 95.2%Electricity
- 4.8%Bottled, tank, or LP gas
| Here: | 0.0% |
| South Carolina: | 11.1% |
| Here: | 0.0% |
| South Carolina: | 21.9% |


