Lummi Island, WA (Washington) Houses and Residents
| Lummi Island: | $807,900 |
| Washington: | $569,500 |
Total population: 944 (Urban population: 0, Rural population: 821 (34 farm, 787 nonfarm))
Houses: 748 (387 occupied: 317 owner occupied, 70 renter occupied)
| % of renters here: | 18% |
| State: | 36% |
Housing density: 81 houses/condos per square mile
Median price asked for vacant for-sale houses and condos in 2022 in this county: $799,591.
Median contract rent in 2022: $1,634 (lower quartile is $1,174, upper quartile is $1,911)
Median gross rent in Lummi Island, WA in 2022: $1,655
Housing units in Lummi Island with a mortgage: 162 (22 second mortgage, 25 home equity loan, 0 both second mortgage and home equity loan)
Houses without a mortgage: 75


Household type by relationship:
Households: 195,436- In family households: 150,091 (35,414 male householders, 13,448 female householders)
38,577 spouses, 49,700 children (45,834 natural, 1,539 adopted, 2,327 stepchildren), 2,556 grandchildren, 1,556 brothers or sisters, 1,208 parents, foster children, 1,836 other relatives, 4,798 non-relatives
- In nonfamily households: 45,345 (15,226 male householders (10,293 living alone)), 16,282 female householders (12,064 living alone)), 13,837 nonrelatives
- In group quarters: 5,704 (1,259 institutionalized population)
28,721 married couples with children.
8,596 single-parent households (2,248 men, 6,348 women).
96.0% of residents of Lummi Island speak English at home.
2.4% of residents speak Spanish at home (68% speak English very well, 32% speak English well).
1.5% of residents speak other Indo-European language at home (100% speak English very well).
Foreign born population: 67 (5.9%)
(114.9% of them are naturalized citizens)
| Here: | 5.2 |
| State: | 6.5 |
| Here: | 2.8 |
| State: | 3.9 |

- Bedrooms in owner-occupied houses and condos in Lummi Island, Washington
- 6no bedroom
- 361 bedroom
- 1022 bedrooms
- 1223 bedrooms
- 384 bedrooms
- 135+ bedrooms

- Bedrooms in renter-occupied apartments in Lummi Island, Washington
- 0no bedroom
- 51 bedroom
- 552 bedrooms
- 103 bedrooms
- 04 bedrooms
- 05+ bedrooms

- Cars and other vehicles available in Lummi Island in owner-occupied houses/condos
- 14no vehicle
- 621 vehicle
- 1382 vehicles
- 633 vehicles
- 84 vehicles
- 325+ vehicles

- Cars and other vehicles available in Lummi Island in renter-occupied apartments
- 0no vehicle
- 391 vehicle
- 202 vehicles
- 113 vehicles
- 04 vehicles
- 05+ vehicles

- Rooms in owner-occupied houses in Lummi Island, Washington
- 61 room
- 132 rooms
- 283 rooms
- 584 rooms
- 915 rooms
- 376 rooms
- 377 rooms
- 318 rooms
- 169+ rooms

- Rooms in renter-occupied apartments in Lummi Island, Washington
- 01 room
- 52 rooms
- 213 rooms
- 274 rooms
- 115 rooms
- 06 rooms
- 07 rooms
- 68 rooms
- 09+ rooms


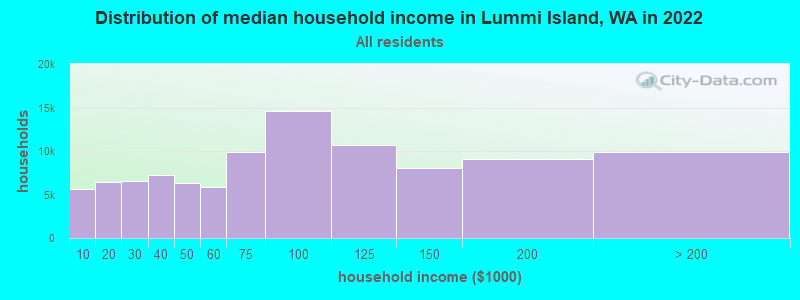
Lummi Island, WA household income distribution

- 5,613Less than $10,000
- 6,382$10,000 to $19,999
- 6,500$20,000 to $29,999
- 7,192$30,000 to $39,999
- 6,310$40,000 to $49,999
- 5,826$50,000 to $59,999
- 9,906$60,000 to $74,999
- 14,638$75,000 to $99,999
- 10,729$100,000 to $124,999
- 8,092$125,000 to $149,999
- 9,121$150,000 to $199,999
- 9,892$200,000 or more
Percentage of workers working in this county: 96.1%
Number of people working at home: 101 (15.7% of all workers)
Travel time to work (commute)
- Less than 5 minutes: 44
- 5 to 9 minutes: 49
- 10 to 14 minutes: 8
- 15 to 19 minutes: 0
- 20 to 24 minutes: 6
- 25 to 29 minutes: 21
- 30 to 34 minutes: 57
- 35 to 39 minutes: 6
- 40 to 44 minutes: 17
- 45 to 59 minutes: 92
- 60 to 89 minutes: 38
- 90 or more minutes: 51
Means of transportation to work:
- Drove a car alone: 307 (70.3%)
- Carpooled: 16 (3.7%)
- Streetcar or trolley car: 5 (1.1%)
- Walked: 56 (12.8%)
- Other means: 5 (1.1%)
- Worked at home: 48 (11.0%)


- Year of entry for the foreign-born population in Lummi Island, Washington
- 61995 to March 2000
- 01990 to 1994
- 01985 to 1989
- 01980 to 1984
- 51975 to 1979
- 01970 to 1974
- 01965 to 1969
- 35Before 1965
Most common places of birth for foreign-born residents (%):
| Lummi Island: | 47.8% (22) |
| Washington: | 7.7% (47,568) |
| Lummi Island: | 23.9% (11) |
| Washington: | 3.3% (20,321) |
| Lummi Island: | 15.2% (7) |
| Washington: | 0.6% (3,795) |
| Lummi Island: | 13.0% (6) |
| Washington: | 3.4% (21,167) |
Place of birth for U.S.-born residents:
- This state: 385
- Other state: 379
- Northeast: 35
- Midwest: 111
- South: 44
- West: 189
61% of Lummi Island residents lived in the same house 5 years ago.
Out of people who lived in different houses, 53% lived in this county.
Out of people who lived in different counties, 42% lived in Washington.
Education attainment for males 25 years and older:
- No schooling: 0
- Nursery to 4th grade: 0
- 5th and 6th grade: 0
- 7th and 8th grade: 0
- 9th grade: 0
- 10th grade: 0
- 11th grade: 10
- 12th grade, no diploma: 5
- High school graduate (or equivalency): 68
- Less than 1 year of college: 0
- Some college more than 1 year, no degree: 50
- Associate degree: 42
- Bachelor's degree: 40
- Master's degree: 64
- Professional school degree: 6
- Doctorate degree: 5

Education attainment for females 25 years and older:
- No schooling: 0
- Nursery to 4th grade: 0
- 5th and 6th grade: 0
- 7th and 8th grade: 0
- 9th grade: 0
- 10th grade: 0
- 11th grade: 0
- 12th grade, no diploma: 5
- High school graduate (or equivalency): 33
- Less than 1 year of college: 27
- Some college more than 1 year, no degree: 56
- Associate degree: 42
- Bachelor's degree: 100
- Master's degree: 44
- Professional school degree: 12
- Doctorate degree: 0


Housing units in structures:
- One, detached: 600
- One, attached: 32
- Two: 6
- 5 to 9: 6
- Mobile homes: 76
- Boats, RVs, vans, etc.: 28
Median worth of mobile homes: $173,329
Housing units lacking complete kitchen facilities: 3.7%

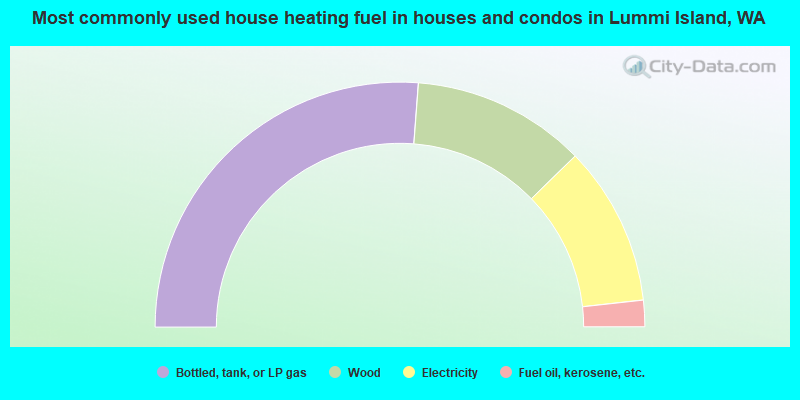
- 52.4%Bottled, tank, or LP gas
- 23.0%Wood
- 21.1%Electricity
- 3.5%Fuel oil, kerosene, etc.
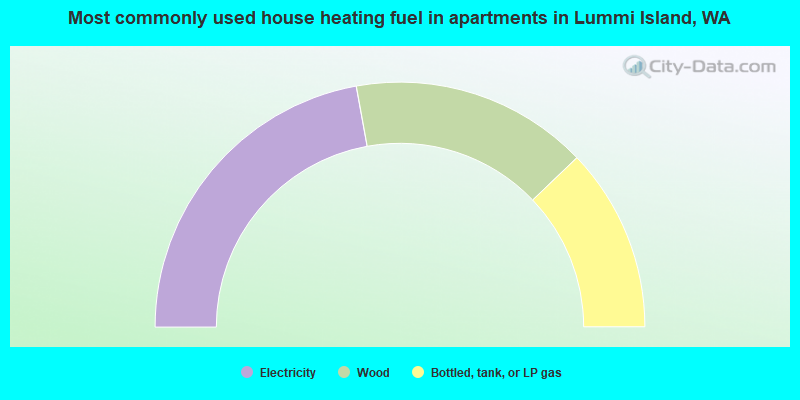
- 44.3%Electricity
- 31.4%Wood
- 24.3%Bottled, tank, or LP gas
Private vs. public school enrollment:
| Here: | 14.1% |
| Washington: | 9.2% |
| Here: | 12.0% |
| Washington: | 7.0% |
| Here: | 0.0% |
| Washington: | 15.7% |


