Lugoff, SC (South Carolina) Houses and Residents
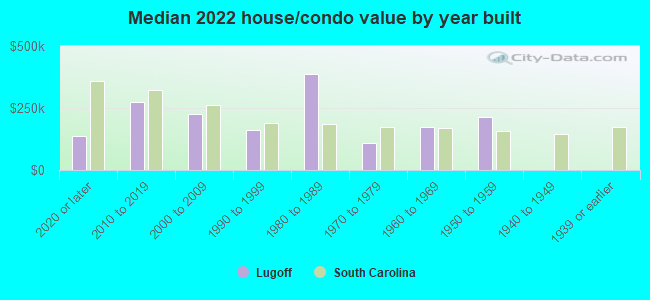
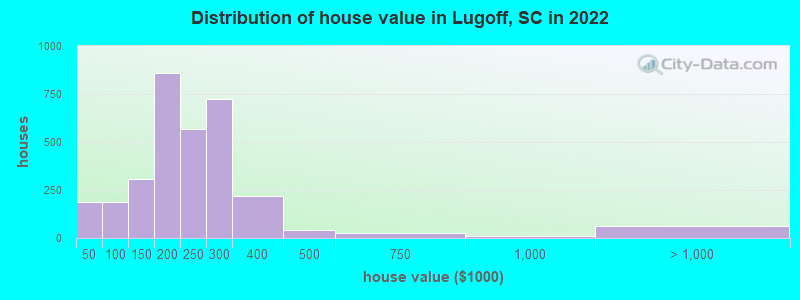
Estimated median house or condo value in 2022: $216,952 (it was $96,300 in 2000 )
Lugoff:
$216,952South Carolina:
$254,600
Lower value quartile - upper value quartile: $155,546 - $267,956Mean price in 2022: Detached houses: $235,512 Here:
$235,512State:
$368,255
Townhouses or other attached units: $312,504 Here:
$312,504State:
$292,023
Mobile homes: $68,265 Here:
$68,265State:
$102,531
Total population: 7,434 (Urban population: 3,884 (all inside urban clusters), Rural population: 2,233 (all nonfarm) )
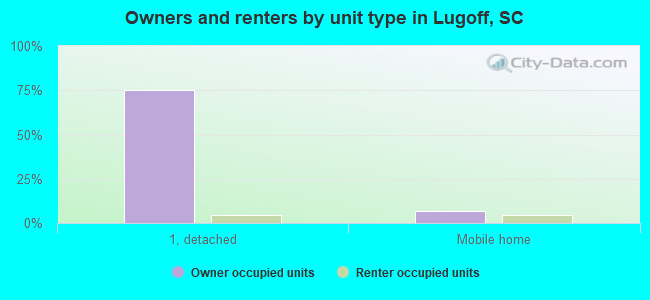
Houses: 3,942 (3,628 occupied: 3,281 owner occupied, 431 renter occupied )
% of renters here:
12%State:
28%
Housing density: 307 houses/condos per square mile
Median price asked for vacant for-sale houses and condos in 2022 in this county: $73,488.
Median contract rent in 2022: $728 (lower quartile is $584, upper quartile is $891)
Median rent asked for vacant for-rent units in 2022: $736
Median gross rent in Lugoff, SC in 2022: $843
Housing units in Lugoff with a mortgage: 1,917 (93 second mortgage, 0 home equity loan, 104 both second mortgage and home equity loan )Houses without a mortgage: 26
Median household income for houses/condos with a mortgage: $80,305
Median household income for apartments without a mortgage: $41,510
Median monthly housing costs: $849
Data:
Median house or condo value ($)
Median house or condo value ($ change since 2000)
Median house or condo value ($) - White
Median house or condo value ($) - Black or African American
Median house or condo value ($) - Asian
Median house or condo value ($) - Hispanic or Latino
Median house or condo value ($) - American Indian and Alaska Native
Median house or condo value ($) - Multirace
Median house or condo value ($) - Other Race
Median price asked for mobile homes ($)
Household density (households per square mile)
Mean house or condo value by units in structure - 1, detached ($)
Mean house or condo value by units in structure - 1, attached ($)
Mean house or condo value by units in structure - 2 ($)
Mean house or condo value by units in structure by units in structure - 3 or 4 ($)
Mean house or condo value by units in structure - 5 or more ($)
Mean house or condo value by units in structure - Boat, RV, van, etc. ($)
Mean house or condo value by units in structure - Mobile home ($)
Median contract rent ($)
Median contract rent - Lower quartile ($)
Median contract rent - Upper quartile ($)
Median gross rent ($)
Urban houses (%)
Rural houses (%)
Houses occupied (%)
Houses occupied (% change since 2000)
Houses owner occupied (%)
Houses owner occupied (% change since 2000)
Houses renter occupied (%)
Houses renter occupied (% change since 2000)
Vacant housing units - For rent (%)
Vacant housing units - For rent (% change since 2000)
Vacant housing units - For sale only (%)
Vacant housing units - For sale only (% change since 2000)
Vacant housing units - Rented or sold, not occupied (%)
Vacant housing units - Rented or sold, not occupied (% change since 2000)
Vacant housing units - For seasonal, recreational, or occasional use (%)
Vacant housing units - For seasonal, recreational, or occasional use (% change since 2000)
Vacant housing units - For migrant workers (%)
Vacant housing units - For migrant workers (% change since 2000)
Vacant housing units - Other vacant (%)
Vacant housing units - Other vacant (% change since 2000)
Median monthly housing costs ($)
Median household income for houses/condos with a mortgage ($)
Median household income for houses/condos without a mortgage ($)
Median household income ($)
Median household income ($) - White
Median household income ($) - Black or African American
Median household income ($) - Asian
Median household income ($) - Hispanic or Latino
Median household income ($) - American Indian and Alaska Native
Median household income ($) - Multirace
Median household income ($) - Other Race
Mortgage status - with mortgage (%)
Mortgage status - with second mortgage (%)
Mortgage status - with home equity loan (%)
Mortgage status - with both second mortgage and home equity loan (%)
Mortgage status - without a mortgage (%)
Median year house/condo built
Median year apartment built
Household type by relationship - Male householder living alone (%)
Household type by relationship - Male householder not living alone (%)
Household type by relationship - Female householder living alone (%)
Household type by relationship - Female householder not living alone (%)
Household type by relationship - Opposite-Sex spouse (%)
Household type by relationship - Same-Sex spouse (%)
Household type by relationship - Opposite-Sex unmarried partner (%)
Household type by relationship - Same-Sex unmarried partner (%)
Household type by relationship - In group quarters (%)
Size of family households - 2-person household (%)
Size of family households - 3-person household (%)
Size of family households - 4-person household (%)
Size of family households - 5-person household (%)
Size of family households - 6-person household (%)
Size of family households - 7-or-more-person household (%)
Size of nonfamily households - 1-person household (%)
Size of nonfamily households - 2-person household (%)
Size of nonfamily households - 3-person household (%)
Size of nonfamily households - 4-person household (%)
Size of nonfamily households - 5-person household (%)
Size of nonfamily households - 6-person household (%)
Size of nonfamily households - 7-or-moreperson household (%)
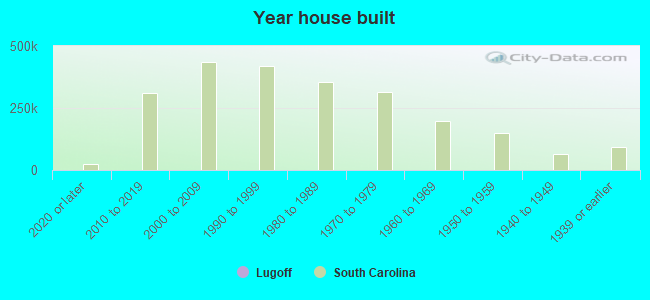
Year house built - Built 2010 or later (%)
Year house built - Built 2000 to 2009 (%)
Year house built - Built 1990 to 1999 (%)
Year house built - Built 1980 to 1989 (%)
Year house built - Built 1970 to 1979 (%)
Year house built - Built 1960 to 1969 (%)
Year house built - Built 1950 to 1959 (%)
Year house built - Built 1940 to 1949 (%)
Year house built - Built 1939 or earlier (%)
Median number of rooms in houses and condos
Median number of rooms in apartments
Median number of bedrooms in owner occupied houses
Mean number of bedrooms in owner occupied houses
Median number of bedrooms in renter occupied houses
Mean number of bedrooms in renter occupied houses
Median number of vehichles in owner occupied houses
Mean number of vehichles in owner occupied houses
Median number of vehichles in renter occupied houses
Mean number of vehichles in renter occupied houses
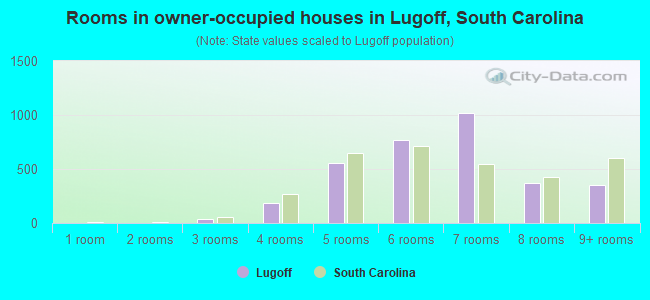
Rooms in owner-occupied houses - 1 room (%)
Rooms in owner-occupied houses - 2 rooms (%)
Rooms in owner-occupied houses - 3 rooms (%)
Rooms in owner-occupied houses - 4 rooms (%)
Rooms in owner-occupied houses - 5 rooms (%)
Rooms in owner-occupied houses - 6 rooms (%)
Rooms in owner-occupied houses - 7 rooms (%)
Rooms in owner-occupied houses - 8 rooms (%)
Rooms in owner-occupied houses - 9+ rooms (%)
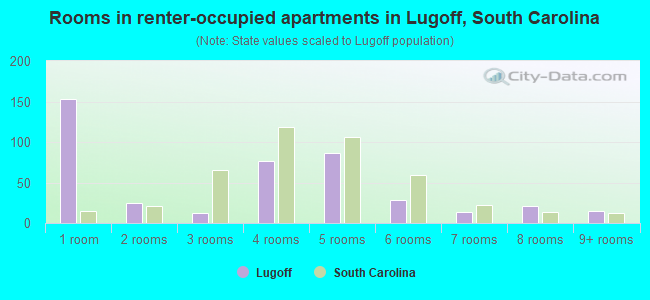
Rooms in renter-occupied houses - 1 room (%)
Rooms in renter-occupied houses - 2 rooms (%)
Rooms in renter-occupied houses - 3 rooms (%)
Rooms in renter-occupied houses - 4 rooms (%)
Rooms in renter-occupied houses - 5 rooms (%)
Rooms in renter-occupied houses - 6 rooms (%)
Rooms in renter-occupied houses - 7 rooms (%)
Rooms in renter-occupied houses - 8 rooms (%)
Rooms in renter-occupied houses - 9+ rooms (%)
Bedrooms in owner-occupied houses - no bedrooms (%)
Bedrooms in owner-occupied houses - 1 bedroom (%)
Bedrooms in owner-occupied houses - 2 bedrooms (%)
Bedrooms in owner-occupied houses - 3 bedrooms (%)
Bedrooms in owner-occupied houses - 4 bedrooms (%)
Bedrooms in owner-occupied houses - 5+ bedrooms (%)
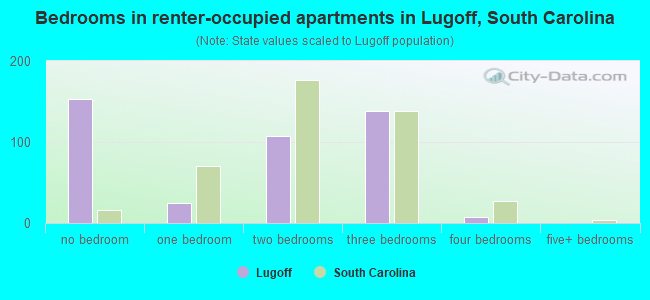
Bedrooms in renter-occupied houses - no bedrooms (%)
Bedrooms in renter-occupied houses - 1 bedroom (%)
Bedrooms in renter-occupied houses - 2 bedrooms (%)
Bedrooms in renter-occupied houses - 3 bedrooms (%)
Bedrooms in renter-occupied houses - 4 bedrooms (%)
Bedrooms in renter-occupied houses - 5+ bedrooms (%)
Vehicles available in owner-occupied houses - no vehicle available (%)
Vehicles available in owner-occupied houses - 1 vehicle available(%)
Vehicles available in owner-occupied houses - 2 Vehicles available (%)
Vehicles available in owner-occupied houses - 3 Vehicles available (%)
Vehicles available in owner-occupied houses - 4 Vehicles available (%)
Vehicles available in owner-occupied houses - 5+ Vehicles available (%)
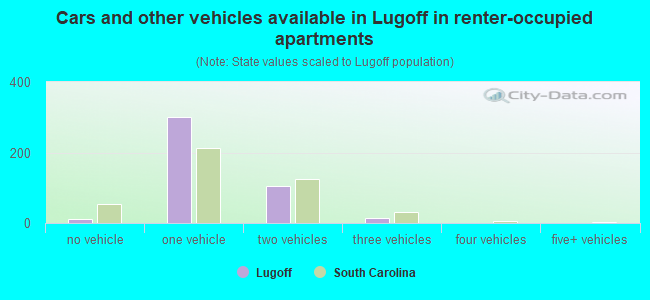
Vehicles available in renter-occupied houses - no vehicle available (%)
Vehicles available in renter-occupied houses - 1 vehicle available (%)
Vehicles available in renter-occupied houses - 2 Vehicles available (%)
Vehicles available in renter-occupied houses - 3 Vehicles available (%)
Vehicles available in renter-occupied houses - 4 Vehicles available (%)
Vehicles available in renter-occupied houses - 5+ Vehicles available (%)
Housing units in structures - 1, detached (%)
Housing units in structures - 1, attached (%)
Housing units in structures - 2 (%)
Housing units in structures - 3 or 4 (%)
Housing units in structures - 5 to 9 (%)
Housing units in structures - 10 to 19 (%)
Housing units in structures - 20 to 49 (%)
Housing units in structures - 50 or more (%)
Housing units in structures - Mobile home (%)
Housing units in structures - Boat, RV, van, etc. (%)
Housing units in structures - Owners - 1, detached (%)
Housing units in structures - Owners - 1, attached (%)
Housing units in structures - Owners - 2 (%)
Housing units in structures - Owners - 3 or 4 (%)
Housing units in structures - Owners - 5 to 9 (%)
Housing units in structures - Owners - 10 to 19 (%)
Housing units in structures - Owners - 20 to 49 (%)
Housing units in structures - Owners - 50 or more (%)
Housing units in structures - Owners - Mobile home (%)
Housing units in structures - Owners - Boat, RV, van, etc. (%)
Housing units in structures - Renters - 1, detached (%)
Housing units in structures - Renters - 1, attached (%)
Housing units in structures - Renters - 2 (%)
Housing units in structures - Renters - 3 or 4 (%)
Housing units in structures - Renters - 5 to 9 (%)
Housing units in structures - Renters - 10 to 19 (%)
Housing units in structures - Renters - 20 to 49 (%)
Housing units in structures - Renters - 50 or more (%)
Housing units in structures - Renters - Mobile home (%)
Housing units in structures - Renters - Boat, RV, van, etc. (%)
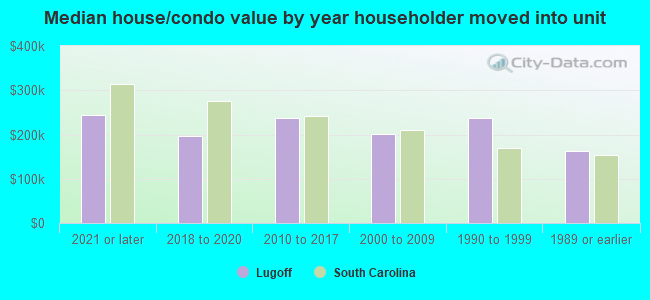
House/condo owner moved in on average (years ago)
Renter moved in on average (years ago)
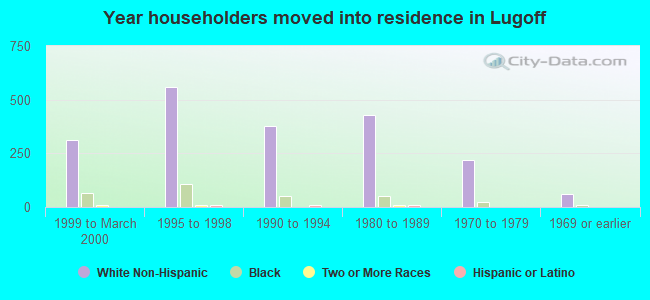
Year householder moved into unit - Moved in 1999 to March 2000 (%)
Year householder moved into unit - Moved in 1999 to March 2000 (%) - White
Year householder moved into unit - Moved in 1999 to March 2000 (%) - Black or African American
Year householder moved into unit - Moved in 1999 to March 2000 (%) - Asian
Year householder moved into unit - Moved in 1999 to March 2000 (%) - Hispanic or Latino
Year householder moved into unit - Moved in 1999 to March 2000 (%) - American Indian and Alaska Native
Year householder moved into unit - Moved in 1999 to March 2000 (%) - Multirace
Year householder moved into unit - Moved in 1999 to March 2000 (%) - Other Race
Year householder moved into unit - Moved in 1995 to 1998 (%)
Year householder moved into unit - Moved in 1995 to 1998 (%) - White
Year householder moved into unit - Moved in 1995 to 1998 (%) - Black or African American
Year householder moved into unit - Moved in 1995 to 1998 (%) - Asian
Year householder moved into unit - Moved in 1995 to 1998 (%) - Hispanic or Latino
Year householder moved into unit - Moved in 1995 to 1998 (%) - American Indian and Alaska Native
Year householder moved into unit - Moved in 1995 to 1998 (%) - Multirace
Year householder moved into unit - Moved in 1995 to 1998 (%) - Other Race
Year householder moved into unit - Moved in 1990 to 1994 (%)
Year householder moved into unit - Moved in 1990 to 1994 (%) - White
Year householder moved into unit - Moved in 1990 to 1994 (%) - Black or African American
Year householder moved into unit - Moved in 1990 to 1994 (%) - Asian
Year householder moved into unit - Moved in 1990 to 1994 (%) - Hispanic or Latino
Year householder moved into unit - Moved in 1990 to 1994 (%) - American Indian and Alaska Native
Year householder moved into unit - Moved in 1990 to 1994 (%) - Multirace
Year householder moved into unit - Moved in 1990 to 1994 (%) - Other Race
Year householder moved into unit - Moved in 1980 to 1989 (%)
Year householder moved into unit - Moved in 1980 to 1989 (%) - White
Year householder moved into unit - Moved in 1980 to 1989 (%) - Black or African American
Year householder moved into unit - Moved in 1980 to 1989 (%) - Asian
Year householder moved into unit - Moved in 1980 to 1989 (%) - Hispanic or Latino
Year householder moved into unit - Moved in 1980 to 1989 (%) - American Indian and Alaska Native
Year householder moved into unit - Moved in 1980 to 1989 (%) - Multirace
Year householder moved into unit - Moved in 1980 to 1989 (%) - Other Race
Year householder moved into unit - Moved in 1970 to 1979 (%)
Year householder moved into unit - Moved in 1970 to 1979 (%) - White
Year householder moved into unit - Moved in 1970 to 1979 (%) - Black or African American
Year householder moved into unit - Moved in 1970 to 1979 (%) - Asian
Year householder moved into unit - Moved in 1970 to 1979 (%) - Hispanic or Latino
Year householder moved into unit - Moved in 1970 to 1979 (%) - American Indian and Alaska Native
Year householder moved into unit - Moved in 1970 to 1979 (%) - Multirace
Year householder moved into unit - Moved in 1970 to 1979 (%) - Other Race
Year householder moved into unit - Moved in 1969 or earlier (%)
Year householder moved into unit - Moved in 1969 or earlier (%) - White
Year householder moved into unit - Moved in 1969 or earlier (%) - Black or African American
Year householder moved into unit - Moved in 1969 or earlier (%) - Asian
Year householder moved into unit - Moved in 1969 or earlier (%) - Hispanic or Latino
Year householder moved into unit - Moved in 1969 or earlier (%) - American Indian and Alaska Native
Year householder moved into unit - Moved in 1969 or earlier (%) - Multirace
Year householder moved into unit - Moved in 1969 or earlier (%) - Other Race
Housing units lacking complete plumbing facilities (%)
Housing units lacking complete kitchen facilities (%)
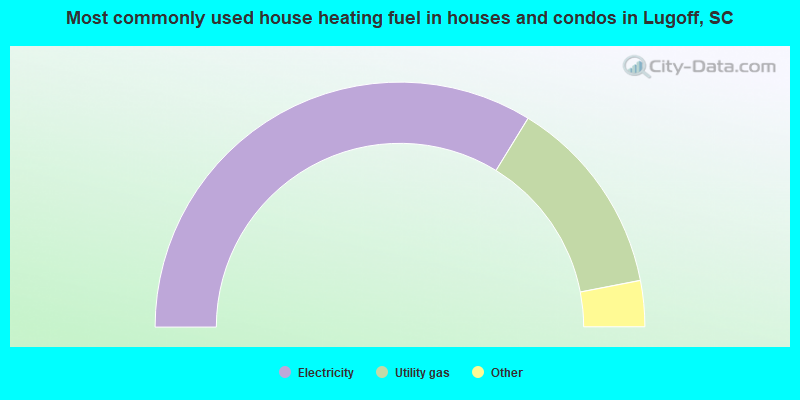
House heating fuel used in houses and condos - Utility gas (%)
House heating fuel used in houses and condos - Bottled, tank, or LP gas (%)
House heating fuel used in houses and condos - Electricity (%)
House heating fuel used in houses and condos - Fuel oil, kerosene, etc. (%)
House heating fuel used in houses and condos - Coal or coke (%)
House heating fuel used in houses and condos - Wood (%)
House heating fuel used in houses and condos - Solar energy (%)
House heating fuel used in houses and condos - Other fuel (%)
House heating fuel used in houses and condos - No fuel used (%)
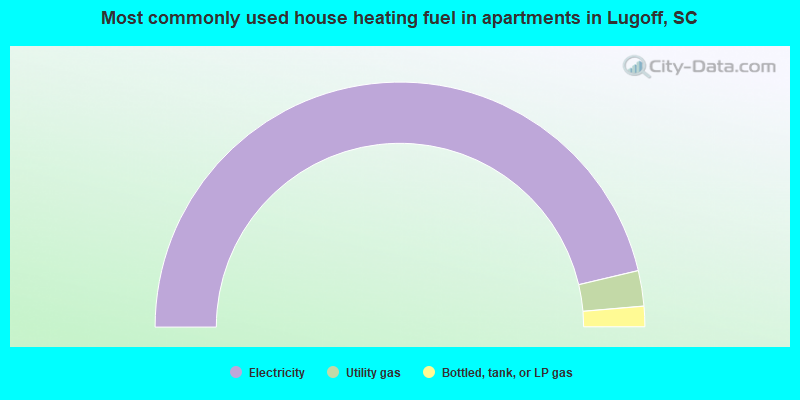
House heating fuel used in apartments - Utility gas (%)
House heating fuel used in apartments - Bottled, tank, or LP gas (%)
House heating fuel used in apartments - Electricity (%)
House heating fuel used in apartments - Fuel oil, kerosene, etc. (%)
House heating fuel used in apartments - Coal or coke (%)
House heating fuel used in apartments - Wood (%)
House heating fuel used in apartments - Solar energy (%)
House heating fuel used in apartments - Other fuel (%)
House heating fuel used in apartments - No fuel used (%)
Latest news about housing in Lugoff, SC collected exclusively by city-data.com from local newspapers, TV, and radio stations
Median year house/condo built: 1995Median year apartment built: 2003Household type by relationship:
Households: 9,705
Male householders: 2,001 (367 living alone ), Female householders: 1,606 (364 living alone )2,066 spouses (2,064 opposite-sex spouses ), 205 unmarried partners , (199 opposite-sex unmarried partners ), 3,135 children (2,857 natural , 176 adopted , 101 stepchildren ), 96 grandchildren , 4 brothers or sisters , 293 parents , 0 foster children , 53 other relatives , 221 non-relatives In group quarters: 20
Size of family households: 1,277 2-persons , 359 3-persons , 503 4-persons , 219 5-persons , 200 6-persons , 14 7-or-more-persons .
Size of nonfamily households: 759 1-person , 461 2-persons , 10 3-persons , 10 5-persons .
1,777 married couples with children. single-parent households (80 men , 411 women ).
94.4% of residents of Lugoff speak English at home. of residents speak Spanish at home (35% speak English very well , 55% speak English well , 10% speak English not well ).of residents speak other Indo-European language at home (36% speak English very well , 64% speak English well ).of residents speak Asian or Pacific Island language at home (100% speak English well ).
Foreign born population: 86 (0.9%)of them are naturalized citizens )
Median number of rooms in houses and condos:
Median number of rooms in apartments
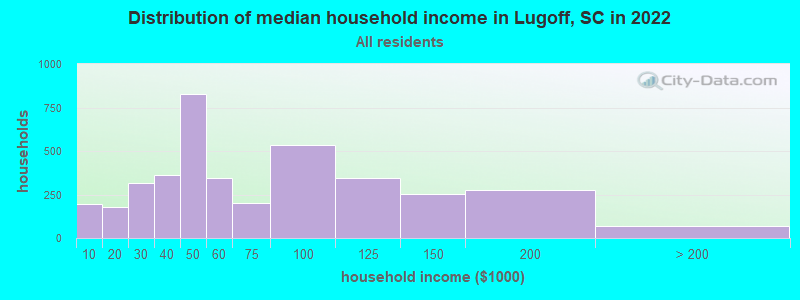
Lugoff, SC household income distribution 193 Less than $10,000176 $10,000 to $19,999317 $20,000 to $29,999361 $30,000 to $39,999825 $40,000 to $49,999347 $50,000 to $59,999199 $60,000 to $74,999532 $75,000 to $99,999347 $100,000 to $124,999253 $125,000 to $149,999273 $150,000 to $199,99969 $200,000 or more
Home value of owner - occupied houses in 2022 in Lugoff, SC 46 Less than $10,00036 $10,000 to $14,9994 $15,000 to $19,99927 $20,000 to $24,99928 $25,000 to $29,99922 $35,000 to $39,99919 $40,000 to $49,9997 $50,000 to $59,99958 $60,000 to $69,9999 $70,000 to $79,99945 $80,000 to $89,99943 $90,000 to $99,999216 $100,000 to $124,99992 $125,000 to $149,999462 $150,000 to $174,999395 $175,000 to $199,999566 $200,000 to $249,999726 $250,000 to $299,999220 $300,000 to $399,99942 $400,000 to $499,99928 $500,000 to $749,99911 $750,000 to $999,99940 $1,000,000 to $1,499,99920 $1,500,000 to $1,999,999Rent paid by renters in 2022 in Lugoff, SC 6 Less than $10011 $100 to $1495 $200 to $24965 $400 to $4498 $450 to $49915 $500 to $54959 $550 to $59919 $600 to $64933 $650 to $699121 $700 to $74922 $750 to $7997 $1,000 to $1,24917 No cash rent
Percentage of workers working in this county: 52.6%Number of people working at home: 456 (10.6% of all workers )
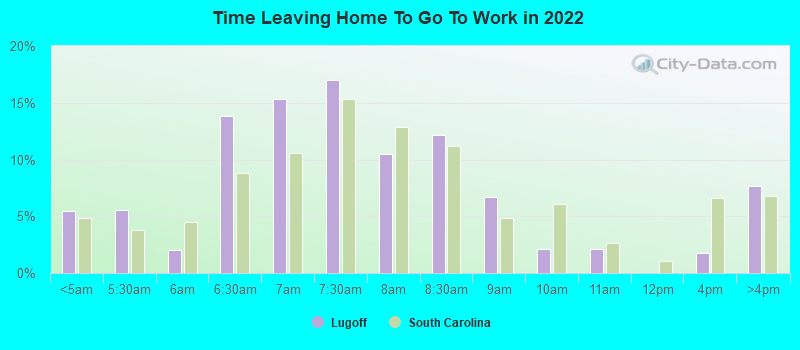
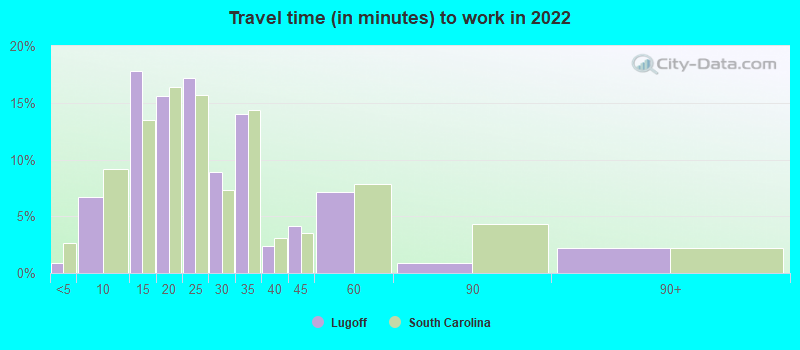
Travel time to work (commute)
Less than 5 minutes: 395 to 9 minutes: 48610 to 14 minutes: 37115 to 19 minutes: 36020 to 24 minutes: 39425 to 29 minutes: 36730 to 34 minutes: 1,01535 to 39 minutes: 19740 to 44 minutes: 33445 to 59 minutes: 26260 to 89 minutes: 7990 or more minutes: 45
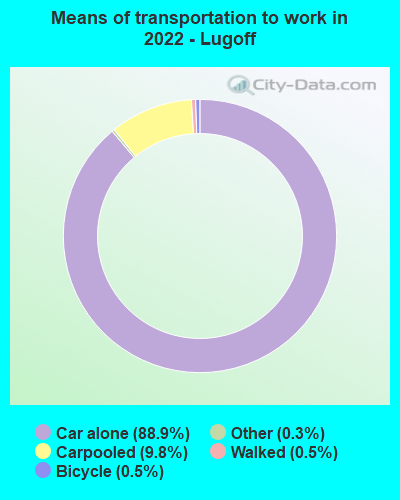
Means of transportation to work:
Drove a car alone: 4,340 (80.2%)Carpooled: 503 (9.3%)Taxi: 18 (0.3%)Bicycle: 27 (0.5%)Walked: 20 (0.4%)Worked at home: 456 (8.4%)
Unemployment by race in 2022
Unemployment rate for White non-Hispanic residents 0.3% Males2.3% FemalesUnemployment rate for Black residents 16.6% Males4.8% FemalesUnemployment rate for other race residents 100.0% FemalesUnemployment rate for Hispanic or Latino residents 20.4% Females
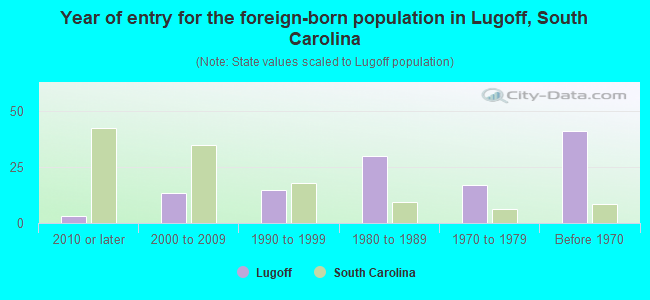
Year of entry for the foreign-born population in Lugoff, South Carolina
3 2010 or later 14 2000 to 2009 15 1990 to 1999 30 1980 to 1989 17 1970 to 1979 41 Before 1970
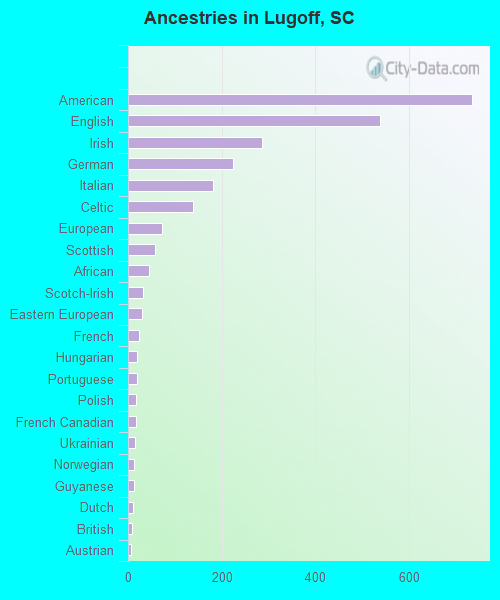
First ancestries reported:
American: 734 (13.5%)
English: 537 (9.9%)
Irish: 287 (5.3%)
German: 225 (4.1%)
Italian: 182 (3.4%)
Celtic: 138 (2.5%)
European: 72 (1.3%)
Scottish: 58 (1.1%)
African: 44 (0.8%)
Scotch-Irish: 31 (0.6%)
Eastern European: 29 (0.5%)
French: 24 (0.4%)
Hungarian: 20 (0.4%)
Portuguese: 20 (0.4%)
Polish: 18 (0.3%)
French Canadian: 17 (0.3%)
Ukrainian: 14 (0.3%)
Norwegian: 13 (0.2%)
Guyanese: 12 (0.2%)
Dutch: 11 (0.2%)
British: 9 (0.2%)
Austrian: 7 (0.1%)
Danish: 4 (0.07%) Most common places of birth for foreign-born residents (%): Germany Lugoff:
33.6% (39)South Carolina:
3.7% (9,982)
Dominican Republic Lugoff:
16.4% (19)South Carolina:
0.9% (2,357)
Colombia Lugoff:
11.2% (13)South Carolina:
4.3% (11,533)
Guyana Lugoff:
11.2% (13)South Carolina:
0.2% (598)
Korea Lugoff:
9.5% (11)South Carolina:
1.7% (4,513)
Netherlands Lugoff:
8.6% (10)South Carolina:
0.3% (727)
Canada Lugoff:
7.8% (9)South Carolina:
3.0% (8,193)
England Lugoff:
4.3% (5)South Carolina:
1.9% (5,117)
Denmark Lugoff:
2.6% (3)South Carolina:
0.1% (347)
Belgium Lugoff:
1.7% (2)South Carolina:
0.1% (285)
United Kingdom, excluding England and Scotland Lugoff:
1.7% (2)South Carolina:
1.2% (3,296)
Place of birth for U.S.-born residents:
This state: 5,233Other state: 4,282Northeast: 1,209Midwest: 690South: 1,617West: 808 91.8% of Lugoff residents lived in the same house 1 years ago.
Out of people who lived in different houses, 10.8% lived in this county.
Out of people who lived in different counties, 40.8% lived in South Carolina.
Lugoff:
91.8%State average:
86.5%
Education attainment for males 25 years and older:
No schooling: 44Nursery to 4th grade: 05th and 6th grade: 07th and 8th grade: 129th grade: 710th grade: 4811th grade: 3512th grade, no diploma: 143High school graduate (or equivalency): 948Less than 1 year of college: 346Some college more than 1 year, no degree: 550Associate degree: 203Bachelor's degree: 373Master's degree: 190Professional school degree: 44Doctorate degree: 46
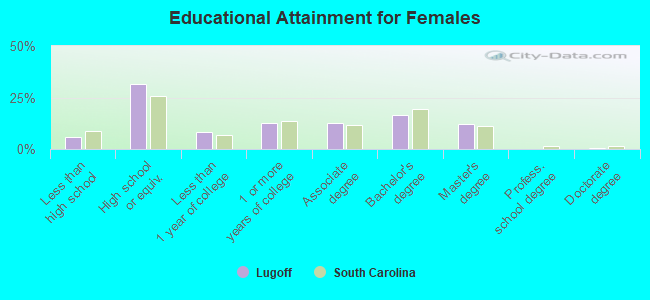
Education attainment for females 25 years and older:
No schooling: 9Nursery to 4th grade: 35th and 6th grade: 67th and 8th grade: 09th grade: 1110th grade: 8911th grade: 3012th grade, no diploma: 52High school graduate (or equivalency): 1,042Less than 1 year of college: 282Some college more than 1 year, no degree: 420Associate degree: 424Bachelor's degree: 544Master's degree: 398Professional school degree: 0Doctorate degree: 14
Housing units in structures:
One, detached: 3,038One, attached: 25Two: 443 or 4: 435 to 9: 9420 to 49: 3450 or more: 121Mobile homes: 539Median worth of mobile homes: $61,922
House/condo owner moved in on average 12 years ago
Renter moved in on average 3 years ago
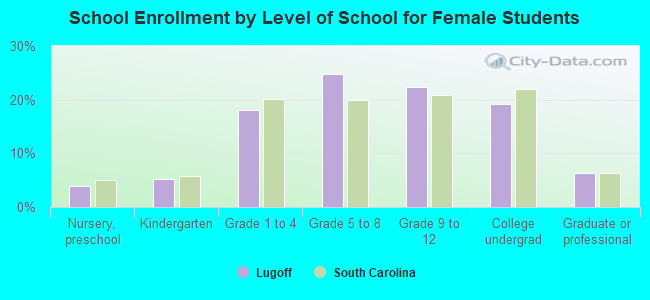
Private vs. public school enrollment:
Students in private schools in grades 1 to 8 (elementary and middle school): 256 Here:
21.5%South Carolina:
14.4%
Students in private schools in grades 9 to 12 (high school): 65 Here:
10.6%South Carolina:
11.1%
Students in private undergraduate colleges: 12 Here:
3.1%South Carolina:
21.9%