Ludlow, KY (Kentucky) Houses and Residents
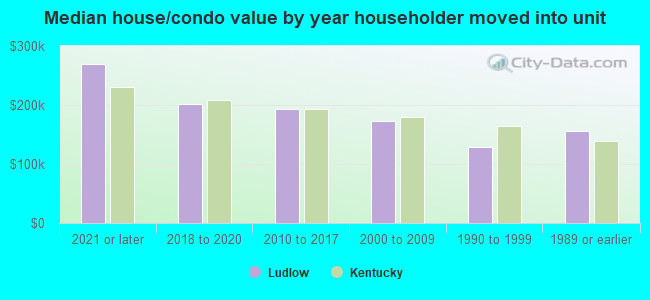
| Ludlow: | $169,285 |
| Kentucky: | $196,300 |
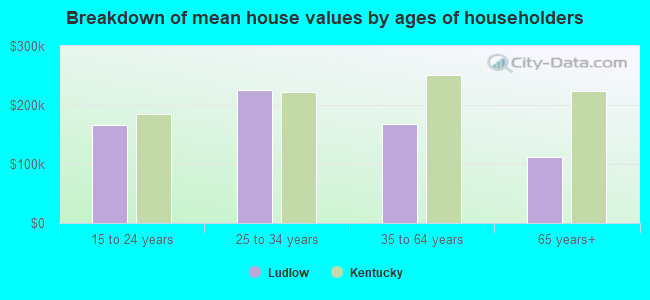
Mean price in 2022:
Detached houses: $157,820
Here: $157,820 State: $256,452 Townhouses or other attached units: $299,645
Here: $299,645 State: $264,090 In 2-unit structures: $104,866
Here: $104,866 State: $211,203 In 3-to-4-unit structures: $288,068
Here: $288,068 State: $169,074 In 5-or-more-unit structures: $334,332
Here: $334,332 State: $245,174
Total population: 4,543 (Urban population: 4,407, Rural population: 0)
Houses: 2,229 (1,932 occupied: 1,500 owner occupied, 397 renter occupied)
| % of renters here: | 21% |
| State: | 31% |
Housing density: 2,599 houses/condos per square mile
Median price asked for vacant for-sale houses and condos in 2022: $325,367.
Median contract rent in 2022: $811 (lower quartile is $588, upper quartile is $1,126)
Median rent asked for vacant for-rent units in 2022: $821
Median gross rent in Ludlow, KY in 2022: $1,110
Housing units in Ludlow with a mortgage: 1,075 (134 second mortgage, 0 home equity loan, 130 both second mortgage and home equity loan)
Houses without a mortgage: 52
Median household income for houses/condos with a mortgage: $75,664
Median household income for apartments without a mortgage: $30,583
Median monthly housing costs: $1,073
Compare current foreclosures near Ludlow, KY:
| Photo | Address | Area | Beds / Baths | Price | Details |
|---|---|---|---|---|---|

|
#1
Werner Ave
Cincinnati, OH 45231
|
1,032 sq. feet
|
1 baths 2 beds |
$124,900
|
show details |

|
#2
Beechwood Dr
Fairfield, OH 45014
|
2,468 sq. feet
|
4 baths 5 beds |
$264,900
|
show details |

|
#3
3495 Boudinot Ave
Cincinnati, OH 45211
|
1,825 sq. feet
|
2 baths 4 beds |
show details | |

|
#4
Regent Rd
Cincinnati, OH 45245
|
1,886 sq. feet
|
3 baths 3 beds |
show details | |

|
#5
Lexington Dr
Erlanger, KY 41018
|
1,063 sq. feet
|
1 baths 3 beds |
show details | |

|
#6
Orangeburg Ct
Cincinnati, OH 45251
|
936 sq. feet
|
1 baths 3 beds |
show details | |

|
#7
W North Bend Rd
Cincinnati, OH 45224
|
1,743 sq. feet
|
2 baths 3 beds |
show details | |

|
#8
Williams St
Cincinnati, OH 45215
|
1,152 sq. feet
|
1 baths 2 beds |
show details | |

|
#9
Musket Cir
Independence, KY 41051
|
1,147 sq. feet
|
2 baths 3 beds |
show details | |

|
#10
Leway Dr
Fairfield, OH 45014
|
960 sq. feet
|
1 baths 4 beds |
show details |
| Photo | Address | Area | Beds / Baths | Price | Details |
|---|---|---|---|---|---|

|
#11
Terrydel Ln
Cincinnati, OH 45245
|
832 sq. feet
|
1 baths 2 beds |
show details | |

|
#12
Perry St
Cincinnati, OH 45231
|
1,176 sq. feet
|
1 baths 2 beds |
show details | |

|
#13
Delryan Dr
Cincinnati, OH 45238
|
1,484 sq. feet
|
1 baths 3 beds |
show details | |

|
#14
Alex Ct
Hebron, KY 41048
|
1,432 sq. feet
|
2 baths 3 beds |
show details | |

|
#15
Dieckman Ln
Cincinnati, OH 45245
|
1,316 sq. feet
|
1 baths 3 beds |
show details | |

|
#16
Glade Ave
Cincinnati, OH 45230
|
1,138 sq. feet
|
1 baths 3 beds |
show details | |

|
#17
Cascade Rd
Cincinnati, OH 45240
|
1,423 sq. feet
|
1 baths 4 beds |
show details | |

|
#18
Linda Dr
Cincinnati, OH 45238
|
1,131 sq. feet
|
2 baths 3 beds |
show details | |

|
#19
Ramble Vw Unit 102
Cincinnati, OH 45231
|
1,129 sq. feet
|
2 baths 2 beds |
show details | |

|
#20
Kinney Ave
Cincinnati, OH 45207
|
1,057 sq. feet
|
1 baths 3 beds |
show details |
| Photo | Address | Area | Beds / Baths | Price | Details |
|---|---|---|---|---|---|

|
#21
Andrew St
Cincinnati, OH 45217
|
1,172 sq. feet
|
1 baths 3 beds |
show details | |

|
#22
Jupiter Dr
Cincinnati, OH 45238
|
900 sq. feet
|
1 baths 2 beds |
show details | |

|
#23
Ann St
Newport, KY 41071
|
939 sq. feet
|
1 baths 2 beds |
show details | |

|
#24
Knollridge Ln
Cincinnati, OH 45231
|
1,307 sq. feet
|
2 baths 3 beds |
show details | |

|
#25
Stormy Way
Cincinnati, OH 45230
|
2,448 sq. feet
|
2 baths 4 beds |
show details | |

|
#26
Bertus St
Cincinnati, OH 45217
|
1,488 sq. feet
|
2 baths 2 beds |
show details | |

|
#27
Riverside Dr
Cincinnati, OH 45202
|
2,500 sq. feet
|
3 baths 3 beds |
show details | |

|
#28
Kims Ln
Erlanger, KY 41018
|
1,120 sq. feet
|
2 baths 3 beds |
show details | |

|
#29
Race Rd
Cincinnati, OH 45211
|
1,523 sq. feet
|
2 baths 3 beds |
show details | |

|
#30
Richwood Ave
Cincinnati, OH 45208
|
2,336 sq. feet
|
2 baths 4 beds |
show details |
| Photo | Address | Area | Beds / Baths | Price | Details |
|---|---|---|---|---|---|

|
#31
Glenn Dr
Lawrenceburg, IN 47025
|
2,002 sq. feet
|
2 baths 3 beds |
show details | |

|
#32
Philloret Dr
Cincinnati, OH 45239
|
1,233 sq. feet
|
1 baths 3 beds |
show details | |

|
#33
Delhi Ave
Cincinnati, OH 45204
|
950 sq. feet
|
1 baths 3 beds |
show details | |

|
#34
Creekhill Dr
Cincinnati, OH 45231
|
1,352 sq. feet
|
3 baths 3 beds |
show details | |

|
#35
Stewart Ave # 1
Cincinnati, OH 45227
|
1,520 sq. feet
|
2 baths 2 beds |
show details | |

|
#36
Glenview Dr
Hebron, KY 41048
|
1,892 sq. feet
|
2 baths 4 beds |
show details | |

|
#37
Cabot Dr
Cincinnati, OH 45231
|
1,080 sq. feet
|
1 baths 3 beds |
show details | |

|
#38
Rogers Park Pl # 1
Cincinnati, OH 45213
|
2,450 sq. feet
|
2 baths 4 beds |
show details | |

|
#39
Voll Rd
Cincinnati, OH 45230
|
1,053 sq. feet
|
1 baths 3 beds |
show details | |

|
#40
Ravenna St
Cincinnati, OH 45227
|
1,029 sq. feet
|
1 baths 2 beds |
show details |
| Photo | Address | Area | Beds / Baths | Price | Details |
|---|---|---|---|---|---|

|
#41
Birchway Dr
Cincinnati, OH 45251
|
576 sq. feet
|
1 baths 1 beds |
show details | |

|
#42
Chandler St
Cincinnati, OH 45227
|
816 sq. feet
|
1 baths 1 beds |
show details | |

|
#43
Fontainebleau Ter
Cincinnati, OH 45231
|
1,560 sq. feet
|
1 baths 3 beds |
show details | |

|
#44
Bluelark Dr
Cincinnati, OH 45231
|
1,386 sq. feet
|
1 baths 3 beds |
show details | |

|
#45
Skyline Dr
Florence, KY 41042
|
1,280 sq. feet
|
2 baths 3 beds |
show details | |

|
#46
Meadow Wood Dr
Florence, KY 41042
|
1,418 sq. feet
|
1 baths 3 beds |
show details | |

|
#47
Deer Run Dr
Burlington, KY 41005
|
1,728 sq. feet
|
2 baths 4 beds |
show details | |

|
#48
Benjamin Ln
Hebron, KY 41048
|
1,455 sq. feet
|
2 baths 3 beds |
show details | |

|
#49
Brierwood Ct
Florence, KY 41042
|
1,768 sq. feet
|
2 baths 4 beds |
show details | |

|
Check over 1 million property listings on Foreclosure.com!
|
browse all offers | |||

Latest news about housing in Ludlow, KY collected exclusively by city-data.com from local newspapers, TV, and radio stations


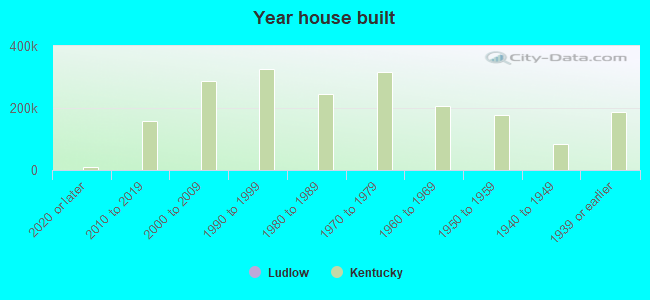
Median year apartment built: 1943
Household type by relationship:
Households: 4,416- Male householders: 754 (257 living alone), Female householders: 1,173 (526 living alone)
530 spouses (530 opposite-sex spouses), 205 unmarried partners, (188 opposite-sex unmarried partners), 1,404 children (1,242 natural, 59 adopted, 102 stepchildren), 49 grandchildren, 8 brothers or sisters, 77 parents, 0 foster children, 11 other relatives, 184 non-relatives
- In group quarters: 17
Size of family households: 487 2-persons, 125 3-persons, 145 4-persons, 54 5-persons, 49 6-persons, 95 7-or-more-persons.
Size of nonfamily households: 799 1-person, 186 2-persons.
366 married couples with children.
608 single-parent households (110 men, 498 women).
96.0% of residents of Ludlow speak English at home.
1.6% of residents speak Spanish at home (100% speak English very well).
1.4% of residents speak other Indo-European language at home (100% speak English very well).
1.0% of residents speak other language at home (44% speak English very well, 56% speak English well).
Foreign born population: 42 (1.0%)
(50.0% of them are naturalized citizens)
| Here: | 5.6 |
| State: | 6.4 |
| Here: | 4.2 |
| State: | 4.4 |
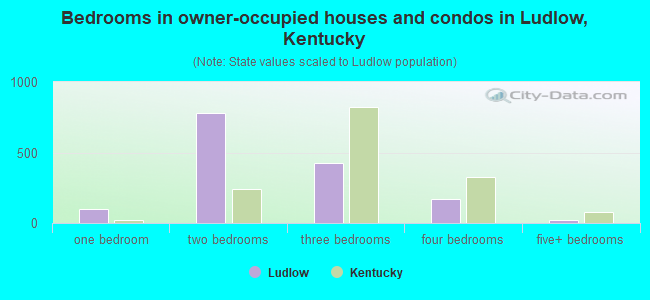
- Bedrooms in owner-occupied houses and condos in Ludlow, Kentucky
- 0no bedroom
- 1001 bedroom
- 7832 bedrooms
- 4263 bedrooms
- 1714 bedrooms
- 205+ bedrooms
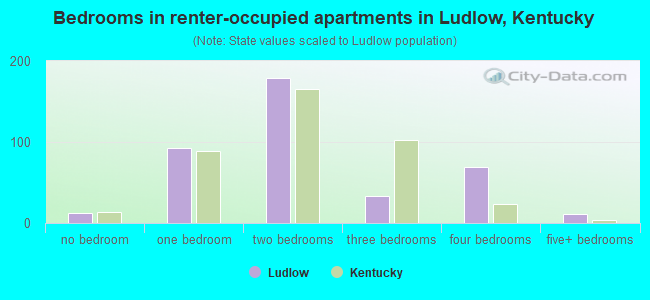
- Bedrooms in renter-occupied apartments in Ludlow, Kentucky
- 12no bedroom
- 931 bedroom
- 1792 bedrooms
- 333 bedrooms
- 694 bedrooms
- 115+ bedrooms
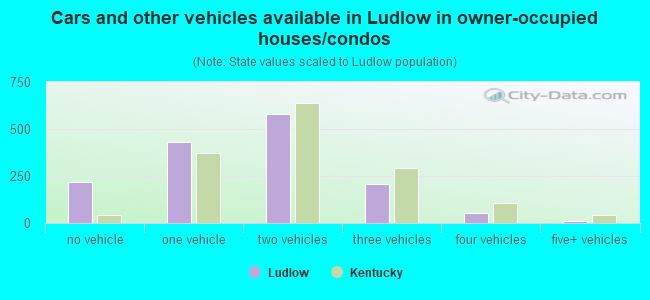
- Cars and other vehicles available in Ludlow in owner-occupied houses/condos
- 219no vehicle
- 4291 vehicle
- 5802 vehicles
- 2053 vehicles
- 544 vehicles
- 135+ vehicles
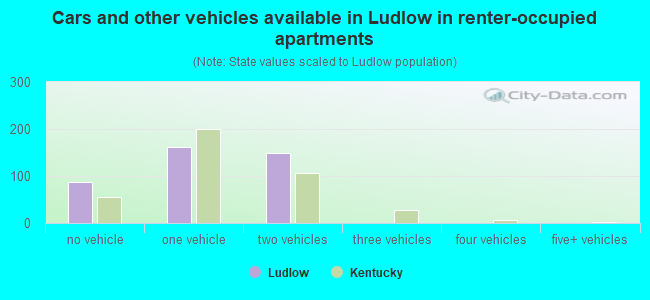
- Cars and other vehicles available in Ludlow in renter-occupied apartments
- 88no vehicle
- 1611 vehicle
- 1492 vehicles
- 03 vehicles
- 04 vehicles
- 05+ vehicles
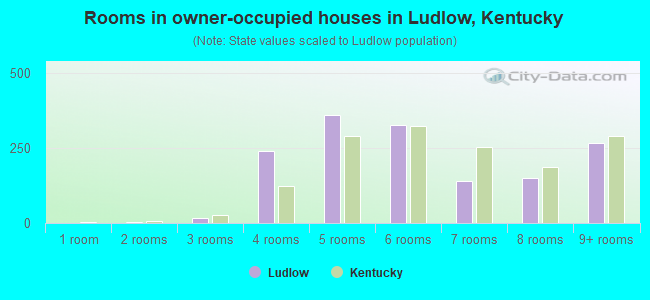
- Rooms in owner-occupied houses in Ludlow, Kentucky
- 01 room
- 42 rooms
- 173 rooms
- 2384 rooms
- 3605 rooms
- 3266 rooms
- 1407 rooms
- 1508 rooms
- 2669+ rooms
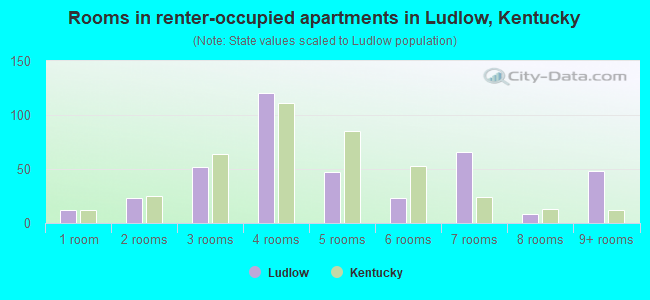
- Rooms in renter-occupied apartments in Ludlow, Kentucky
- 121 room
- 232 rooms
- 523 rooms
- 1204 rooms
- 475 rooms
- 236 rooms
- 667 rooms
- 88 rooms
- 489+ rooms
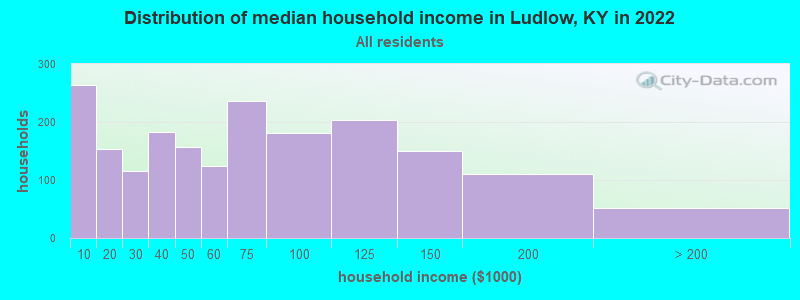
Ludlow, KY household income distribution

- 263Less than $10,000
- 153$10,000 to $19,999
- 116$20,000 to $29,999
- 182$30,000 to $39,999
- 157$40,000 to $49,999
- 124$50,000 to $59,999
- 236$60,000 to $74,999
- 181$75,000 to $99,999
- 204$100,000 to $124,999
- 150$125,000 to $149,999
- 110$150,000 to $199,999
- 52$200,000 or more
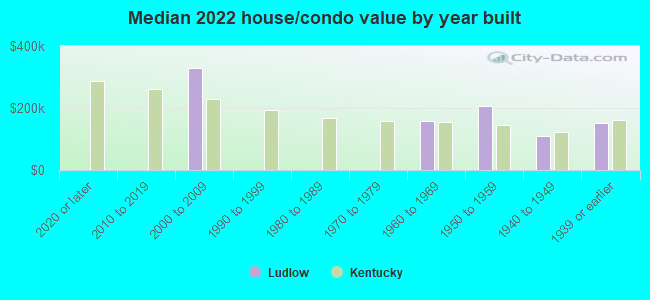
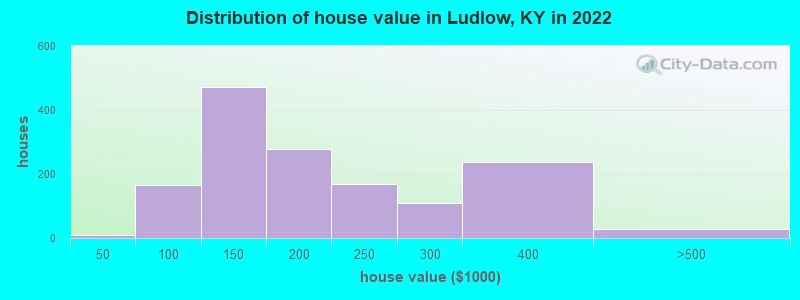
Home value of owner - occupied houses in 2022 in Ludlow, KY
-
- 8Less than $10,000
- 61$50,000 to $59,999
- 56$70,000 to $79,999
- 14$80,000 to $89,999
- 35$90,000 to $99,999
- 220$100,000 to $124,999
- 250$125,000 to $149,999
- 194$150,000 to $174,999
- 84$175,000 to $199,999
- 169$200,000 to $249,999
- 110$250,000 to $299,999
- 236$300,000 to $399,999
- 29$400,000 to $499,999
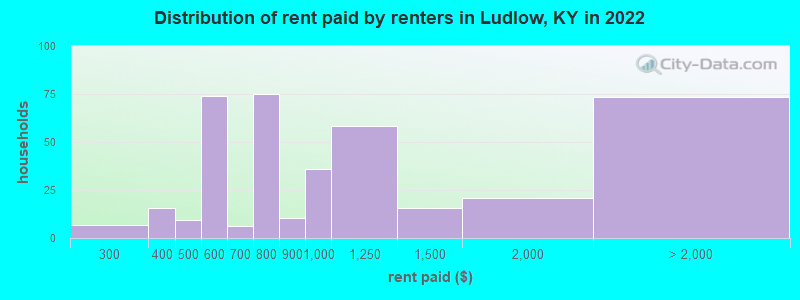
Rent paid by renters in 2022 in Ludlow, KY
-
- 6$250 to $299
- 15$350 to $399
- 9$450 to $499
- 60$500 to $549
- 13$550 to $599
- 6$600 to $649
- 15$700 to $749
- 59$750 to $799
- 10$800 to $899
- 35$900 to $999
- 58$1,000 to $1,249
- 15$1,250 to $1,499
- 21$1,500 to $1,999
- 10$2,000 to $2,499
- 62No cash rent
Percentage of workers working in this county: 50.8%
Number of people working at home: 292 (13.0% of all workers)
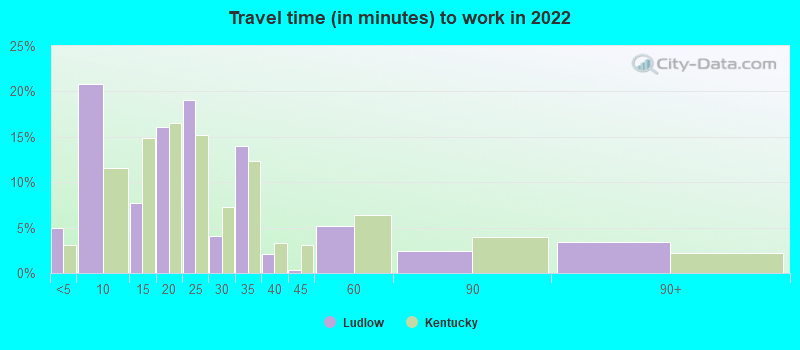
Travel time to work (commute)
- Less than 5 minutes: 37
- 5 to 9 minutes: 116
- 10 to 14 minutes: 328
- 15 to 19 minutes: 384
- 20 to 24 minutes: 307
- 25 to 29 minutes: 170
- 30 to 34 minutes: 404
- 35 to 39 minutes: 23
- 40 to 44 minutes: 57
- 45 to 59 minutes: 28
- 60 to 89 minutes: 61
- 90 or more minutes: 0
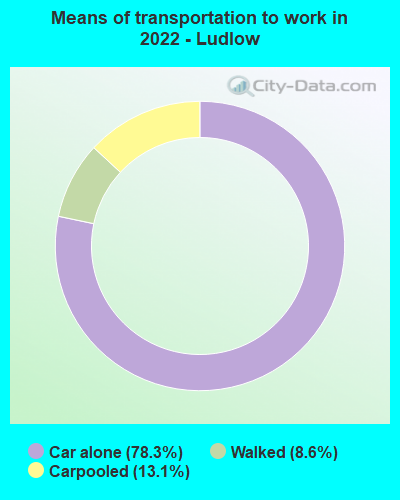
Means of transportation to work:
- Drove a car alone: 474 (58.2%)
- Carpooled: 87 (10.7%)
- Walked: 52 (6.4%)
- Worked at home: 245 (30.1%)
- Unemployment by race in 2022
- Unemployment rate for White non-Hispanic residents
- 9.1%Males
- 1.0%Females
- Unemployment rate for Black residents
- 100.0%Females
- Unemployment rate for two or more race residents
- 15.3%Males
- 83.3%Females
- Unemployment rate for Hispanic or Latino residents
- 34.1%Females
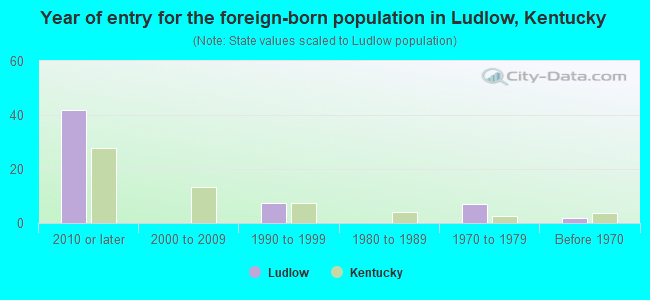
- Year of entry for the foreign-born population in Ludlow, Kentucky
- 422010 or later
- 02000 to 2009
- 71990 to 1999
- 01980 to 1989
- 71970 to 1979
- 2Before 1970
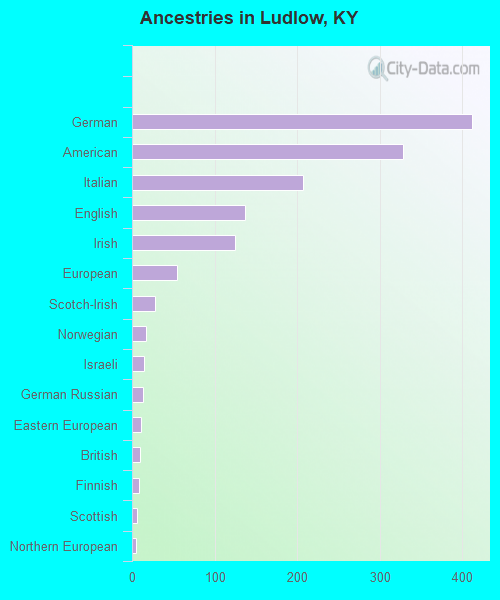
First ancestries reported:
- German: 412 (25.6%)
- American: 328 (20.4%)
- Italian: 207 (12.9%)
- English: 137 (8.5%)
- Irish: 125 (7.8%)
- European: 54 (3.4%)
- Scotch-Irish: 28 (1.7%)
- Norwegian: 17 (1.1%)
- Israeli: 14 (0.9%)
- German Russian: 13 (0.8%)
- Eastern European: 11 (0.7%)
- British: 10 (0.6%)
- Finnish: 9 (0.6%)
- Scottish: 6 (0.4%)
- Northern European: 5 (0.3%)
Most common places of birth for foreign-born residents (%):
| Ludlow: | 51.1% (23) |
| Kentucky: | 0.4% (780) |
| Ludlow: | 33.3% (15) |
| Kentucky: | 0.1% (264) |
| Ludlow: | 17.8% (8) |
| Kentucky: | 0.8% (1,529) |
Place of birth for U.S.-born residents:
- This state: 2,402
- Other state: 1,971
- Northeast: 87
- Midwest: 1,647
- South: 132
- West: 103
92.3% of Ludlow residents lived in the same house 1 years ago.
Out of people who lived in different houses, 35.9% lived in this county.
Out of people who lived in different counties, 43.4% lived in Kentucky.
| Ludlow: | 92.3% |
| State average: | 87.2% |
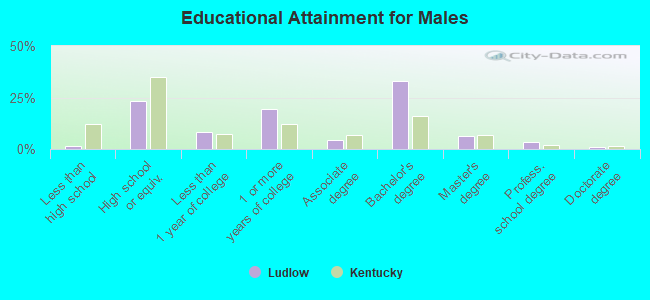
Education attainment for males 25 years and older:
- No schooling: 9
- Nursery to 4th grade: 0
- 5th and 6th grade: 0
- 7th and 8th grade: 0
- 9th grade: 3
- 10th grade: 0
- 11th grade: 10
- 12th grade, no diploma: 1
- High school graduate (or equivalency): 321
- Less than 1 year of college: 113
- Some college more than 1 year, no degree: 267
- Associate degree: 59
- Bachelor's degree: 456
- Master's degree: 84
- Professional school degree: 49
- Doctorate degree: 12
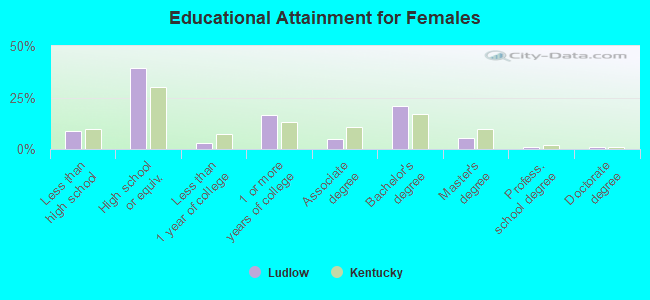
Education attainment for females 25 years and older:
- No schooling: 0
- Nursery to 4th grade: 0
- 5th and 6th grade: 0
- 7th and 8th grade: 0
- 9th grade: 9
- 10th grade: 68
- 11th grade: 59
- 12th grade, no diploma: 5
- High school graduate (or equivalency): 647
- Less than 1 year of college: 46
- Some college more than 1 year, no degree: 270
- Associate degree: 83
- Bachelor's degree: 346
- Master's degree: 90
- Professional school degree: 15
- Doctorate degree: 14


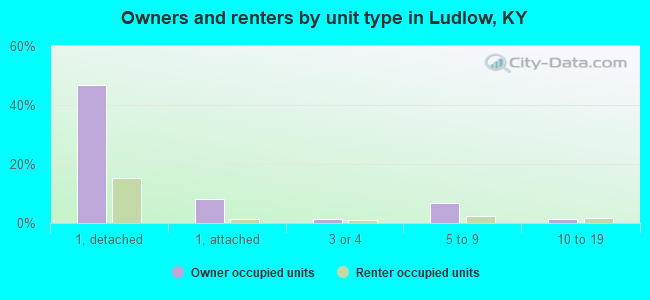
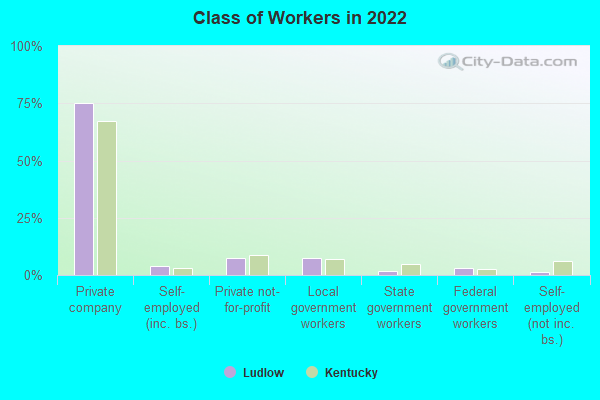
Housing units in structures:
- One, detached: 1,404
- One, attached: 407
- Two: 181
- 3 or 4: 43
- 5 to 9: 50
- 10 to 19: 114
- 20 to 49: 27
Housing units lacking complete kitchen facilities in 2022: 6.4%
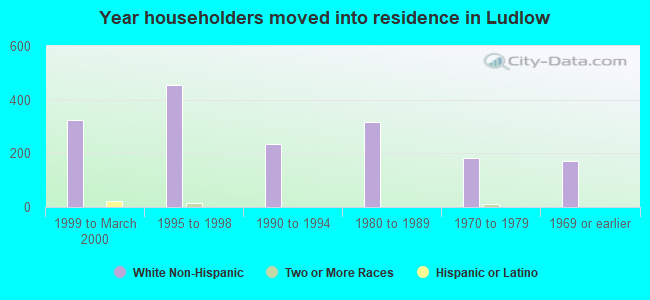
House/condo owner moved in on average 11 years ago
Renter moved in on average 1 years ago
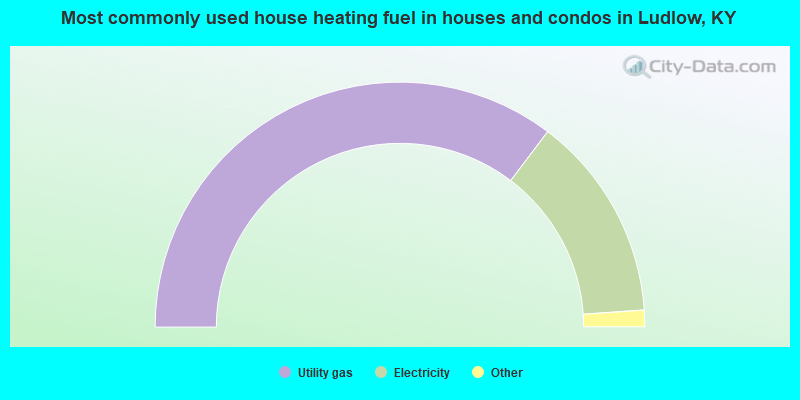
- 70.7%Utility gas
- 27.2%Electricity
- 1.1%Bottled, tank, or LP gas
- 1.0%Wood
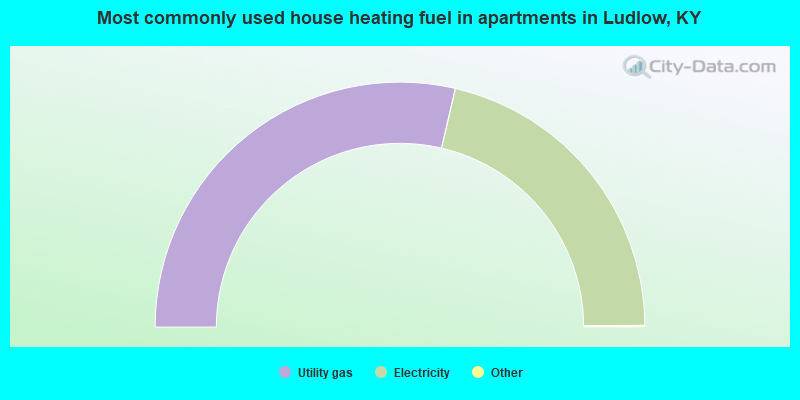
- 57.4%Utility gas
- 42.6%Electricity
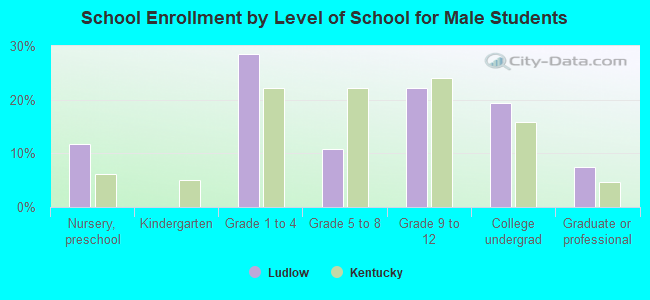
Private vs. public school enrollment:
| Here: | 13.2% |
| Kentucky: | 17.2% |
| Here: | 24.5% |
| Kentucky: | 15.2% |
| Here: | 37.0% |
| Kentucky: | 19.6% |