Lower Rutherford Creek, TN (Tennessee) Houses and Residents
| Lower Rutherford Creek: | $461,954 |
| Tennessee: | $284,800 |
Total population: 7,726 (Urban population: 1,779 (all inside urban clusters), Rural population: 4,917 (160 farm, 4,757 nonfarm))
Houses: 2,406 (2,303 occupied: 2,111 owner occupied, 192 renter occupied)
| % of renters here: | 8% |
| State: | 33% |
Housing density: 37 houses/condos per square mile
Median price asked for vacant for-sale houses and condos in 2022 in this county: $642,492.
Median contract rent in 2022: $1,040 (lower quartile is $970, upper quartile is $1,386)
Median rent asked for vacant for-rent units in 2022: $885
Median gross rent in Lower Rutherford Creek, TN in 2022: $1,195
Housing units in Lower Rutherford Creek with a mortgage: 1,315 (176 second mortgage, 114 home equity loan, 0 both second mortgage and home equity loan)
Houses without a mortgage: 265
Compare current foreclosures near Lower Rutherford Creek, TN:
| Photo | Address | Area | Beds / Baths | Price | Details |
|---|---|---|---|---|---|

|
#1
Lindsey Ln
Chapel Hill, TN 37034
|
2,012 sq. feet
|
3 baths 3 beds |
show details | |

|
#2
Lequire Lane
Spring Hill, TN 37174
|
3,045 sq. feet
|
4 baths 6 beds |
show details | |

|
#3
Trey Dr
Lewisburg, TN 37091
|
1,190 sq. feet
|
2 baths 3 beds |
show details | |

|
#4
Webb Rd
Lewisburg, TN 37091
|
1,378 sq. feet
|
2 baths 3 beds |
show details | |

|
#5
Remington Trl
Columbia, TN 38401
|
1,806 sq. feet
|
2 baths 4 beds |
show details | |

|
#6
Addison Avenue
Chapel Hill, TN 37034
|
2,208 sq. feet
|
2 baths - beds |
show details | |

|
#7
Zion Rd
Columbia, TN 38401
|
2,370 sq. feet
|
3 baths - beds |
show details | |

|
#8
Hunters Chase Dr
Chapel Hill, TN 37034
|
1,316 sq. feet
|
2 baths - beds |
show details | |

|
#9
Carters Creek Pike
Columbia, TN 38401
|
1,512 sq. feet
|
2 baths - beds |
show details | |

|
#10
W 15th St
Columbia, TN 38401
|
948 sq. feet
|
1 baths - beds |
show details |
| Photo | Address | Area | Beds / Baths | Price | Details |
|---|---|---|---|---|---|

|
#11
Weaver St
Lewisburg, TN 37091
|
886 sq. feet
|
1 baths - beds |
show details | |

|
#12
Highland Ave
Columbia, TN 38401
|
744 sq. feet
|
1 baths - beds |
show details | |

|
#13
Granada Dr
Columbia, TN 38401
|
1,375 sq. feet
|
1 baths - beds |
show details | |

|
#14
Avra Ct
Columbia, TN 38401
|
1,194 sq. feet
|
2 baths - beds |
show details | |

|
#15
W 17th St
Columbia, TN 38401
|
744 sq. feet
|
1 baths - beds |
show details | |

|
#16
Hunters Chase Dr
Chapel Hill, TN 37034
|
1,288 sq. feet
|
2 baths - beds |
show details | |

|
#17
Woods Ave N
Lewisburg, TN 37091
|
1,246 sq. feet
|
1 baths - beds |
show details | |

|
#18
Silver St
Lewisburg, TN 37091
|
630 sq. feet
|
1 baths - beds |
show details | |

|
#19
University Dr
Columbia, TN 38401
|
1,511 sq. feet
|
2 baths - beds |
show details | |

|
#20
Tommy Dr
Columbia, TN 38401
|
1,178 sq. feet
|
2 baths - beds |
show details |
| Photo | Address | Area | Beds / Baths | Price | Details |
|---|---|---|---|---|---|

|
#21
Galloway St
Columbia, TN 38401
|
1,736 sq. feet
|
1 baths - beds |
show details | |

|
#22
Creekview Dr
Columbia, TN 38401
|
1,876 sq. feet
|
2 baths - beds |
show details | |

|
#23
Carters Creek Pike
Columbia, TN 38401
|
3,888 sq. feet
|
3 baths - beds |
show details | |

|
#24
White Dr
Lewisburg, TN 37091
|
1,690 sq. feet
|
1 baths - beds |
show details | |

|
#25
Mccoury Ln
Spring Hill, TN 37174
|
2,853 sq. feet
|
4 baths - beds |
show details | |

|
#26
Amber Lynn Cir
Columbia, TN 38401
|
1,518 sq. feet
|
1 baths - beds |
show details | |

|
#27
Lee Dr
Columbia, TN 38401
|
2,118 sq. feet
|
1 baths - beds |
show details | |

|
#28
Stonewall Dr
Columbia, TN 38401
|
2,614 sq. feet
|
2 baths - beds |
show details | |

|
#29
Autumn Ridge Ln
Columbia, TN 38401
|
1,804 sq. feet
|
3 baths - beds |
show details | |

|
#30
Gale Ct
Spring Hill, TN 37174
|
1,852 sq. feet
|
3 baths - beds |
show details |
| Photo | Address | Area | Beds / Baths | Price | Details |
|---|---|---|---|---|---|

|
#31
Polk St
Columbia, TN 38401
|
684 sq. feet
|
1 baths - beds |
show details | |

|
#32
Limestone Ave
Lewisburg, TN 37091
|
2,542 sq. feet
|
1 baths - beds |
show details | |

|
#33
Fremantle Cir
Spring Hill, TN 37174
|
3,142 sq. feet
|
4 baths - beds |
show details | |

|
#34
Crestview Dr
Columbia, TN 38401
|
1,209 sq. feet
|
1 baths - beds |
show details | |

|
#35
Parker St
Columbia, TN 38401
|
1,122 sq. feet
|
1 baths - beds |
show details | |

|
#36
Whitney Dr
Columbia, TN 38401
|
2,246 sq. feet
|
2 baths - beds |
show details | |

|
#37
Brown Hollow Rd
Columbia, TN 38401
|
1,418 sq. feet
|
1 baths - beds |
show details | |

|
#38
Buchanan St
Lewisburg, TN 37091
|
893 sq. feet
|
1 baths - beds |
show details | |

|
#39
Highland Ave
Columbia, TN 38401
|
1,583 sq. feet
|
2 baths - beds |
show details | |

|
#40
Apple St
Lewisburg, TN 37091
|
936 sq. feet
|
1 baths - beds |
show details |
| Photo | Address | Area | Beds / Baths | Price | Details |
|---|---|---|---|---|---|

|
#41
Pickens Ln
Columbia, TN 38401
|
900 sq. feet
|
1 baths - beds |
show details | |

|
#42
Chance Ave
Lewisburg, TN 37091
|
1,134 sq. feet
|
2 baths - beds |
show details | |

|
#43
Wedgewood Dr
Columbia, TN 38401
|
2,340 sq. feet
|
2 baths - beds |
show details | |

|
#44
Sumerset Cir
Lewisburg, TN 37091
|
1,231 sq. feet
|
2 baths - beds |
show details | |

|
#45
Ewing Ln
Lewisburg, TN 37091
|
1,566 sq. feet
|
2 baths - beds |
show details | |

|
#46
Dodson Dr
Lewisburg, TN 37091
|
1,477 sq. feet
|
2 baths - beds |
show details | |

|
#47
Zurich Dr
Spring Hill, TN 37174
|
1,944 sq. feet
|
3 baths - beds |
show details | |

|
#48
Edge Park Ct
Columbia, TN 38401
|
1,230 sq. feet
|
2 baths - beds |
show details | |

|
#49
Wade Brown Rd
Lewisburg, TN 37091
|
1,336 sq. feet
|
1 baths - beds |
show details | |

|
Check over 1 million property listings on Foreclosure.com!
|
browse all offers | |||

Household type by relationship:
Households: 79,947- In family households: 68,892 (15,712 male householders, 6,737 female householders)
16,490 spouses, 23,112 children (21,164 natural, 628 adopted, 1,320 stepchildren), 2,173 grandchildren, 664 brothers or sisters, 635 parents, foster children, 1,015 other relatives, 1,878 non-relatives
- In nonfamily households: 11,055 (4,086 male householders (3,213 living alone)), 5,128 female householders (4,492 living alone)), 1,841 nonrelatives
- In group quarters: 1,009 (890 institutionalized population)
11,882 married couples with children.
4,148 single-parent households (821 men, 3,327 women).
95.5% of residents of Lower Rutherford Creek speak English at home.
3.3% of residents speak Spanish at home (54% speak English very well, 13% speak English well, 31% speak English not well, 2% don't speak English at all).
1.0% of residents speak other Indo-European language at home (86% speak English very well, 14% speak English not well).
0.2% of residents speak Asian or Pacific Island language at home (100% speak English very well).
Foreign born population: 219 (2.1%)
(126.0% of them are naturalized citizens)
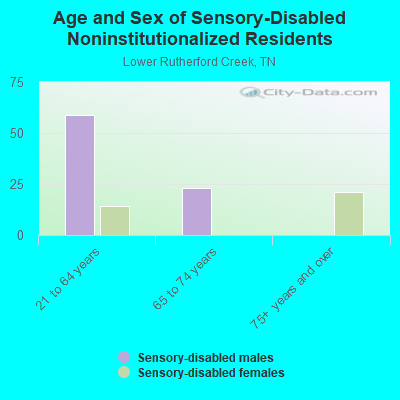
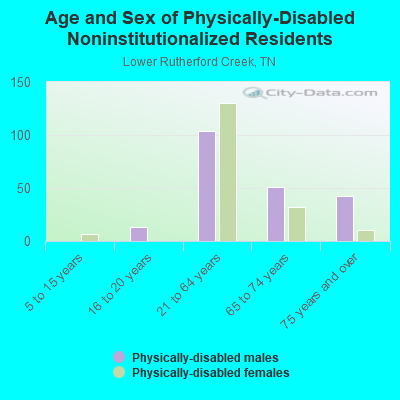
| Here: | 6.7 |
| State: | 6.5 |
| Here: | 5.8 |
| State: | 4.4 |
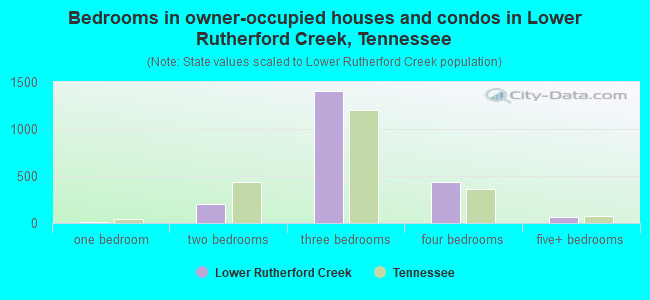
- Bedrooms in owner-occupied houses and condos in Lower Rutherford Creek, Tennessee
- 0no bedroom
- 81 bedroom
- 1972 bedrooms
- 1,4003 bedrooms
- 4404 bedrooms
- 665+ bedrooms
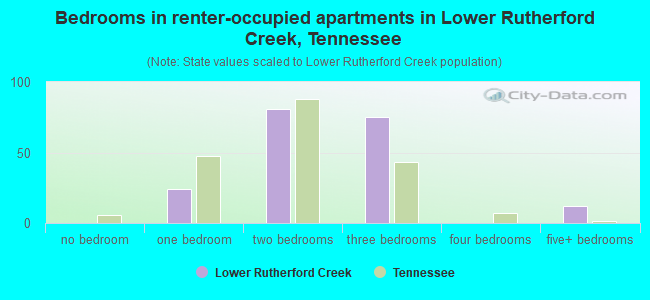
- Bedrooms in renter-occupied apartments in Lower Rutherford Creek, Tennessee
- 0no bedroom
- 241 bedroom
- 812 bedrooms
- 753 bedrooms
- 04 bedrooms
- 125+ bedrooms
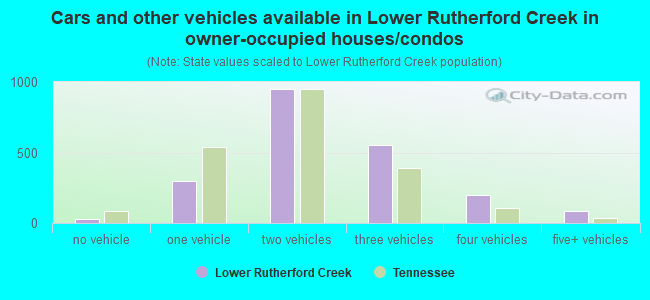
- Cars and other vehicles available in Lower Rutherford Creek in owner-occupied houses/condos
- 28no vehicle
- 2981 vehicle
- 9482 vehicles
- 5513 vehicles
- 2014 vehicles
- 855+ vehicles
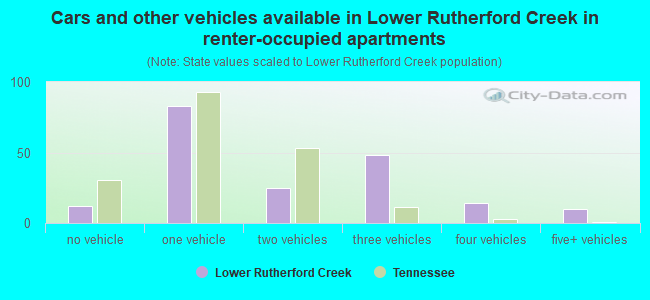
- Cars and other vehicles available in Lower Rutherford Creek in renter-occupied apartments
- 12no vehicle
- 831 vehicle
- 252 vehicles
- 483 vehicles
- 144 vehicles
- 105+ vehicles
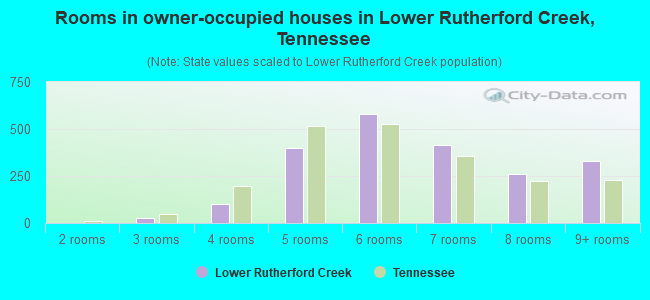
- Rooms in owner-occupied houses in Lower Rutherford Creek, Tennessee
- 01 room
- 02 rooms
- 293 rooms
- 994 rooms
- 3985 rooms
- 5796 rooms
- 4157 rooms
- 2638 rooms
- 3289+ rooms
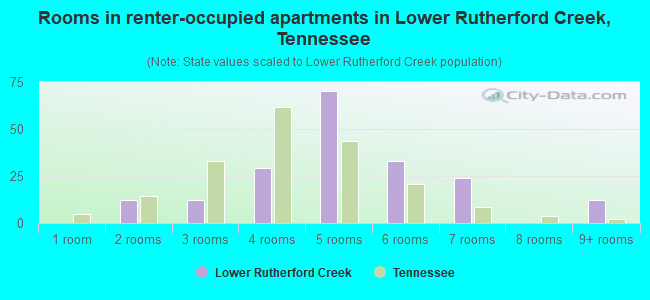
- Rooms in renter-occupied apartments in Lower Rutherford Creek, Tennessee
- 01 room
- 122 rooms
- 123 rooms
- 294 rooms
- 705 rooms
- 336 rooms
- 247 rooms
- 08 rooms
- 129+ rooms
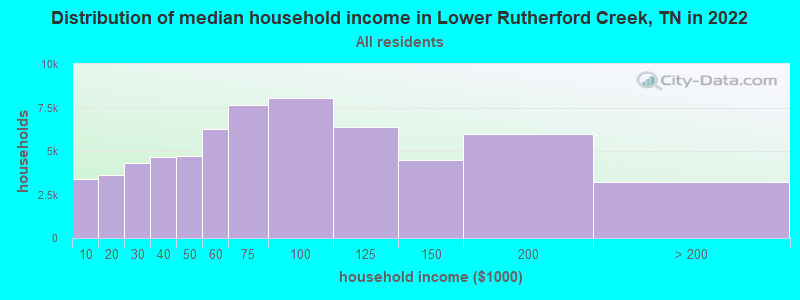
Lower Rutherford Creek, TN household income distribution

- 3,400Less than $10,000
- 3,639$10,000 to $19,999
- 4,286$20,000 to $29,999
- 4,631$30,000 to $39,999
- 4,713$40,000 to $49,999
- 6,251$50,000 to $59,999
- 7,634$60,000 to $74,999
- 8,056$75,000 to $99,999
- 6,385$100,000 to $124,999
- 4,490$125,000 to $149,999
- 5,968$150,000 to $199,999
- 3,191$200,000 or more
Percentage of workers working in this county: 62.4%
Number of people working at home: 472 (11.3% of all workers)
Travel time to work (commute)
- Less than 5 minutes: 37
- 5 to 9 minutes: 181
- 10 to 14 minutes: 481
- 15 to 19 minutes: 633
- 20 to 24 minutes: 537
- 25 to 29 minutes: 361
- 30 to 34 minutes: 428
- 35 to 39 minutes: 94
- 40 to 44 minutes: 138
- 45 to 59 minutes: 352
- 60 to 89 minutes: 164
- 90 or more minutes: 30
Means of transportation to work:
- Drove a car alone: 3,020 (86.0%)
- Carpooled: 349 (9.9%)
- Bus or trolley bus: 12 (0.3%)
- Motorcycle: 8 (0.2%)
- Bicycle: 8 (0.2%)
- Walked: 23 (0.7%)
- Other means: 16 (0.5%)
- Worked at home: 75 (2.1%)
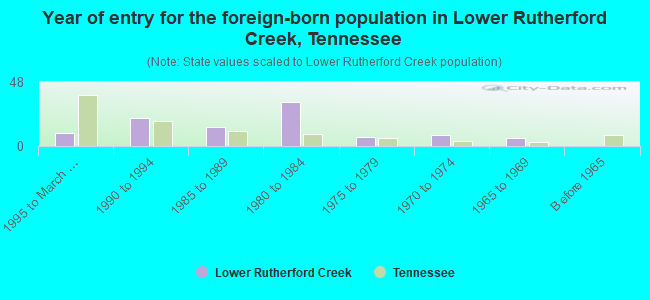
- Year of entry for the foreign-born population in Lower Rutherford Creek, Tennessee
- 101995 to March 2000
- 211990 to 1994
- 141985 to 1989
- 331980 to 1984
- 71975 to 1979
- 81970 to 1974
- 61965 to 1969
- 0Before 1965
Most common places of birth for foreign-born residents (%):
| Lower Rutherford Creek: | 36.4% (36) |
| Tennessee: | 28.1% (44,682) |
| Lower Rutherford Creek: | 18.2% (18) |
| Tennessee: | 0.3% (407) |
| Lower Rutherford Creek: | 15.2% (15) |
| Tennessee: | 2.3% (3,669) |
| Lower Rutherford Creek: | 14.1% (14) |
| Tennessee: | 4.8% (7,701) |
| Lower Rutherford Creek: | 8.1% (8) |
| Tennessee: | 0.3% (519) |
| Lower Rutherford Creek: | 4.0% (4) |
| Tennessee: | 0.3% (486) |
| Lower Rutherford Creek: | 4.0% (4) |
| Tennessee: | 0.5% (811) |
Place of birth for U.S.-born residents:
- This state: 3,166
- Other state: 3,359
- Northeast: 386
- Midwest: 1,900
- South: 917
- West: 156
62% of Lower Rutherford Creek residents lived in the same house 5 years ago.
Out of people who lived in different houses, 37% lived in this county.
Out of people who lived in different counties, 54% lived in Tennessee.
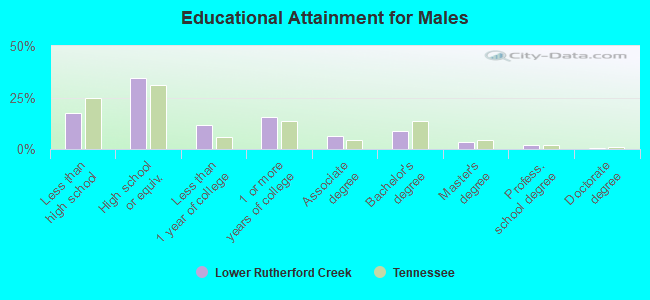
Education attainment for males 25 years and older:
- No schooling: 20
- Nursery to 4th grade: 0
- 5th and 6th grade: 16
- 7th and 8th grade: 99
- 9th grade: 63
- 10th grade: 86
- 11th grade: 29
- 12th grade, no diploma: 82
- High school graduate (or equivalency): 782
- Less than 1 year of college: 263
- Some college more than 1 year, no degree: 355
- Associate degree: 137
- Bachelor's degree: 202
- Master's degree: 73
- Professional school degree: 40
- Doctorate degree: 11
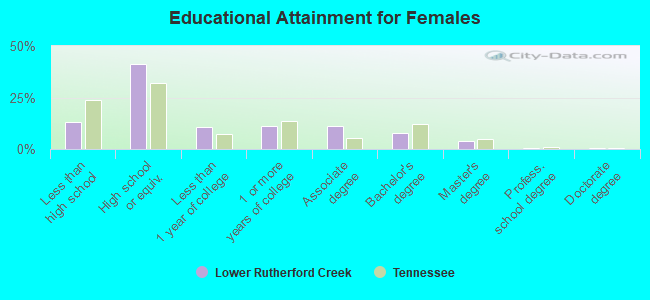
Education attainment for females 25 years and older:
- No schooling: 11
- Nursery to 4th grade: 4
- 5th and 6th grade: 0
- 7th and 8th grade: 22
- 9th grade: 73
- 10th grade: 48
- 11th grade: 27
- 12th grade, no diploma: 96
- High school graduate (or equivalency): 896
- Less than 1 year of college: 226
- Some college more than 1 year, no degree: 239
- Associate degree: 246
- Bachelor's degree: 167
- Master's degree: 87
- Professional school degree: 13
- Doctorate degree: 7
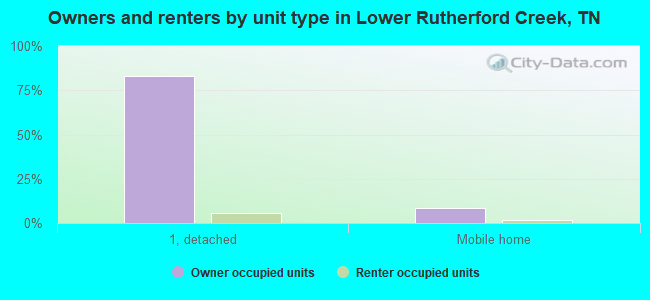
Housing units in structures:
- One, detached: 2,130
- Two: 12
- 3 or 4: 9
- Mobile homes: 255
Median worth of mobile homes: $253,021
Housing units lacking complete kitchen facilities: 1.2%
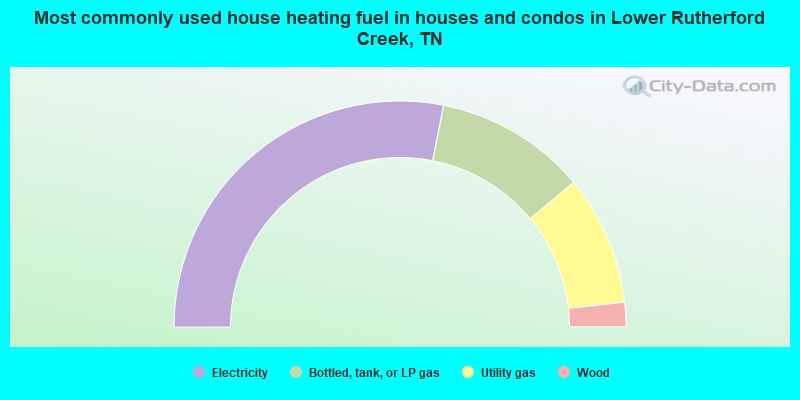
- 56.2%Electricity
- 21.7%Bottled, tank, or LP gas
- 18.6%Utility gas
- 3.5%Wood
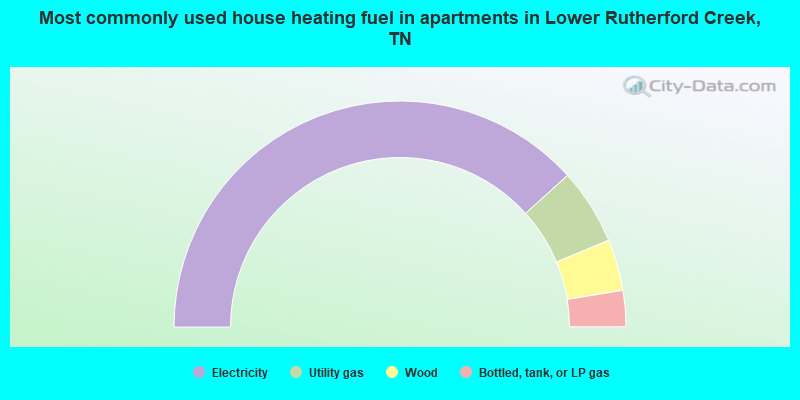
- 76.6%Electricity
- 10.9%Utility gas
- 7.3%Wood
- 5.2%Bottled, tank, or LP gas
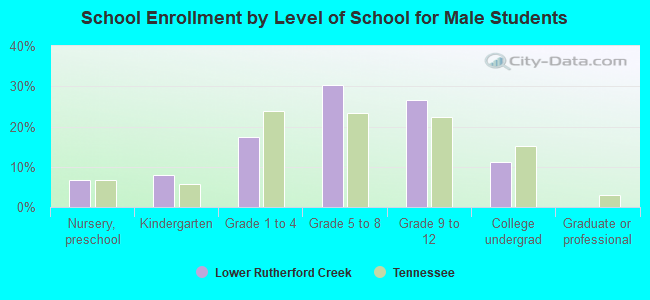
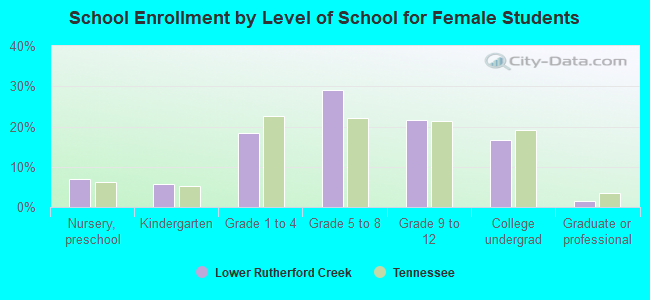
Private vs. public school enrollment:
| Here: | 11.6% |
| Tennessee: | 9.5% |
| Here: | 28.8% |
| Tennessee: | 10.4% |
| Here: | 0.0% |
| Tennessee: | 22.8% |