Long Beach, CA (California) Houses and Residents
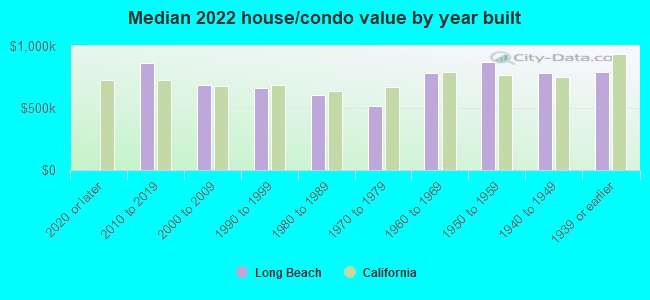
| Long Beach: | $772,500 |
| California: | $715,900 |
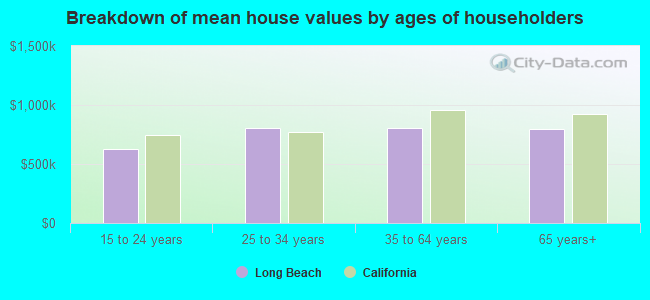
Mean price in 2022:
Detached houses: $921,752
Here: $921,752 State: $988,808 Townhouses or other attached units: $680,027
Here: $680,027 State: $838,546 In 2-unit structures: $1,005,129
Here: $1,005,129 State: $1,138,100 In 3-to-4-unit structures: $523,902
Here: $523,902 State: $824,253 In 5-or-more-unit structures: $514,129
Here: $514,129 State: $730,996 Mobile homes: $225,621
Here: $225,621 State: $184,506 Occupied boats, RVs, vans, etc.: $22,411
Here: $22,411 State: $204,957
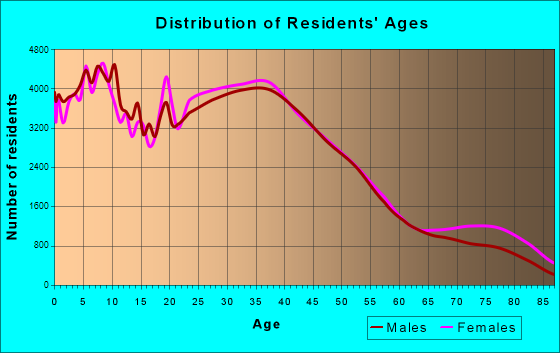
Total population: 473,577 (Urban population: 461,381, Rural population: 0)
Houses: 181,251 (170,965 occupied: 71,928 owner occupied, 99,037 renter occupied)
| % of renters here: | 58% |
| State: | 44% |
Housing density: 3,593 houses/condos per square mile
Median price asked for vacant for-sale houses and condos in 2022: $2,039,190.
Median contract rent in 2022: $1,643 (lower quartile is $1,284, upper quartile is $1,990)
Median rent asked for vacant for-rent units in 2022: $2,385
Median gross rent in Long Beach, CA in 2022: $1,743
Housing units in Long Beach with a mortgage: 50,502 (4,538 second mortgage, 407 home equity loan, 3,282 both second mortgage and home equity loan)
Houses without a mortgage: 221
Median household income for houses/condos with a mortgage: $137,145
Median household income for apartments without a mortgage: $92,223
Median monthly housing costs: $1,806
Compare current foreclosures in Long Beach, CA:
| Photo | Address | Area | Beds / Baths | Price | Details |
|---|---|---|---|---|---|

|
#1
Redondo Avenue, Units 5-8
Long Beach, CA 90804
|
3,360 sq. feet
|
4 baths 8 beds |
show details | |

|
#2
Mira Mar Ave
Long Beach, CA 90814
|
1,902 sq. feet
|
2 baths 4 beds |
show details | |

|
#3
W Arbor St # 57
Long Beach, CA 90805
|
1,585 sq. feet
|
2 baths 3 beds |
show details | |

|
#4
E Poppy St
Long Beach, CA 90805
|
1,091 sq. feet
|
2 baths 2 beds |
show details | |

|
#5
Myrtle Ave
Long Beach, CA 90807
|
3,563 sq. feet
|
4 baths 6 beds |
show details | |

|
#6
Lees Ave
Long Beach, CA 90808
|
887 sq. feet
|
1 baths 2 beds |
show details | |

|
#7
Regway Ave
Long Beach, CA 90810
|
924 sq. feet
|
1 baths 2 beds |
show details | |

|
#8
Walnut Ave
Long Beach, CA 90807
|
1,912 sq. feet
|
3 baths 2 beds |
show details | |

|
#9
E 7th St
Long Beach, CA 90813
|
2,456 sq. feet
|
4 baths 6 beds |
show details | |

|
#10
E Barclay St
Long Beach, CA 90805
|
963 sq. feet
|
1 baths 3 beds |
show details |
| Photo | Address | Area | Beds / Baths | Price | Details |
|---|---|---|---|---|---|

|
#11
Malaga Pl
Long Beach, CA 90814
|
2,927 sq. feet
|
3 baths 5 beds |
show details | |

|
#12
Johnson Ave
Long Beach, CA 90805
|
1,252 sq. feet
|
2 baths 3 beds |
show details | |

|
#13
Faust Ave
Long Beach, CA 90808
|
1,434 sq. feet
|
2 baths 3 beds |
show details | |

|
#14
Hathaway Ave Unit 26
Long Beach, CA 90815
|
957 sq. feet
|
2 baths 2 beds |
show details | |

|
#15
E Keynote St
Long Beach, CA 90808
|
1,064 sq. feet
|
1 baths 2 beds |
show details | |

|
#16
W Home St
Long Beach, CA 90805
|
1,628 sq. feet
|
2 baths 3 beds |
show details | |

|
#17
E 59th St
Long Beach, CA 90805
|
1,036 sq. feet
|
1 baths 2 beds |
show details | |

|
#18
W Plymouth St
Long Beach, CA 90805
|
1,045 sq. feet
|
1 baths 3 beds |
show details | |

|
#19
Adriatic Ave
Long Beach, CA 90810
|
2,138 sq. feet
|
1 baths 2 beds |
show details | |

|
#20
W Harcourt St
Long Beach, CA 90805
|
2,070 sq. feet
|
3 baths 4 beds |
show details |
| Photo | Address | Area | Beds / Baths | Price | Details |
|---|---|---|---|---|---|

|
#21
E Jefferson St
Long Beach, CA 90810
|
1,144 sq. feet
|
1 baths 2 beds |
show details | |

|
#22
Jaymills Ave
Long Beach, CA 90805
|
1,388 sq. feet
|
2 baths 3 beds |
show details | |

|
#23
E 3rd St Apt 20
Long Beach, CA 90802
|
1,031 sq. feet
|
2 baths 2 beds |
show details | |

|
#24
E Garford St
Long Beach, CA 90815
|
1,817 sq. feet
|
2 baths 3 beds |
show details | |

|
#25
E 3rd St Apt 20
Long Beach, CA 90802
|
1,031 sq. feet
|
2 baths 2 beds |
show details | |

|
#26
Linden Ave
Long Beach, CA 90805
|
741 sq. feet
|
1 baths 2 beds |
show details | |

|
#27
Hathaway Ave Apt 134
Long Beach, CA 90815
|
660 sq. feet
|
1 baths 1 beds |
show details | |

|
#28
W Columbia St
Long Beach, CA 90806
|
1,333 sq. feet
|
2 baths 3 beds |
show details | |

|
#29
Fidler Ave
Long Beach, CA 90808
|
1,156 sq. feet
|
1 baths 3 beds |
show details | |

|
#30
N Tribune Ct
Long Beach, CA 90813
|
1,056 sq. feet
|
1 baths 2 beds |
show details |
| Photo | Address | Area | Beds / Baths | Price | Details |
|---|---|---|---|---|---|

|
#31
Knoxville Ave
Long Beach, CA 90808
|
1,210 sq. feet
|
1 baths 3 beds |
show details | |

|
#32
Falcon Ave
Long Beach, CA 90807
|
810 sq. feet
|
1 baths 2 beds |
show details | |

|
#33
Walnut Ave
Long Beach, CA 90807
|
1,912 sq. feet
|
3 baths 2 beds |
show details | |

|
#34
E 7th St
Long Beach, CA 90804
|
1,239 sq. feet
|
1 baths 2 beds |
show details | |

|
#35
Alamitos Ave
Long Beach, CA 90813
|
2,028 sq. feet
|
5 baths 8 beds |
show details | |

|
#36
E Lanai St
Long Beach, CA 90808
|
1,353 sq. feet
|
1 baths 2 beds |
show details | |

|
#37
Termino Ave
Long Beach, CA 90804
|
1,545 sq. feet
|
2 baths 3 beds |
show details | |

|
#38
E Dominguez St
Long Beach, CA 90810
|
1,176 sq. feet
|
2 baths 2 beds |
show details | |

|
#39
W 32nd St
Long Beach, CA 90810
|
1,200 sq. feet
|
2 baths 3 beds |
show details | |

|
#40
Atlantic Ave
Long Beach, CA 90806
|
1,037 sq. feet
|
2 baths 2 beds |
show details |
| Photo | Address | Area | Beds / Baths | Price | Details |
|---|---|---|---|---|---|

|
#41
Santa Fe Ave
Long Beach, CA 90810
|
1,203 sq. feet
|
3 baths 3 beds |
show details | |

|
#42
Olive Ave
Long Beach, CA 90805
|
884 sq. feet
|
1 baths 2 beds |
show details | |

|
#43
Maine Ave
Long Beach, CA 90806
|
1,199 sq. feet
|
2 baths 3 beds |
show details | |

|
#44
E Harding St
Long Beach, CA 90805
|
1,017 sq. feet
|
2 baths 2 beds |
show details | |

|
#45
E 7th St
Long Beach, CA 90813
|
2,142 sq. feet
|
3 baths 9 beds |
show details | |

|
#46
E Artesia Blvd Apt 34
Long Beach, CA 90805
|
857 sq. feet
|
2 baths 2 beds |
show details | |

|
#47
Linden Ave
Long Beach, CA 90805
|
741 sq. feet
|
1 baths 2 beds |
show details | |

|
#48
Chestnut Ave
Long Beach, CA 90806
|
1,784 sq. feet
|
2 baths 3 beds |
show details | |

|
#49
E Platt St
Long Beach, CA 90805
|
1,515 sq. feet
|
3 baths 3 beds |
show details | |

|
Check over 1 million property listings on Foreclosure.com!
|
browse all offers | |||


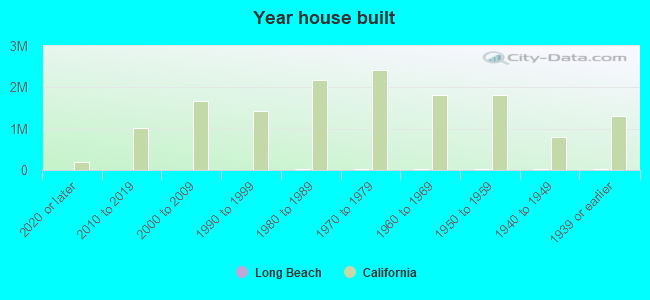
Median year apartment built: 1966
Household type by relationship:
Households: 451,319- Male householders: 83,542 (25,479 living alone), Female householders: 87,423 (28,183 living alone)
60,180 spouses (58,090 opposite-sex spouses), 16,694 unmarried partners, (14,455 opposite-sex unmarried partners), 126,624 children (118,920 natural, 1,495 adopted, 6,209 stepchildren), 11,041 grandchildren, 11,589 brothers or sisters, 9,870 parents, 482 foster children, 13,105 other relatives, 19,370 non-relatives
- In group quarters: 11,399
Size of family households: 36,875 2-persons, 22,567 3-persons, 21,374 4-persons, 12,214 5-persons, 3,104 6-persons, 3,325 7-or-more-persons.
Size of nonfamily households: 53,662 1-person, 14,414 2-persons, 2,016 3-persons, 1,020 4-persons, 243 5-persons, 151 7-or-more-persons.
42,195 married couples with children.
32,587 single-parent households (7,702 men, 24,885 women).
56.5% of residents of Long Beach speak English at home.
31.6% of residents speak Spanish at home (67% speak English very well, 15% speak English well, 13% speak English not well, 5% don't speak English at all).
2.5% of residents speak other Indo-European language at home (71% speak English very well, 23% speak English well, 4% speak English not well, 2% don't speak English at all).
8.9% of residents speak Asian or Pacific Island language at home (60% speak English very well, 24% speak English well, 13% speak English not well, 3% don't speak English at all).
0.5% of residents speak other language at home (86% speak English very well, 12% speak English well, 2% speak English not well).
Foreign born population: 107,014 (23.7%)
(56.8% of them are naturalized citizens)
| Here: | 5.5 |
| State: | 6.0 |
| Here: | 3.6 |
| State: | 3.9 |
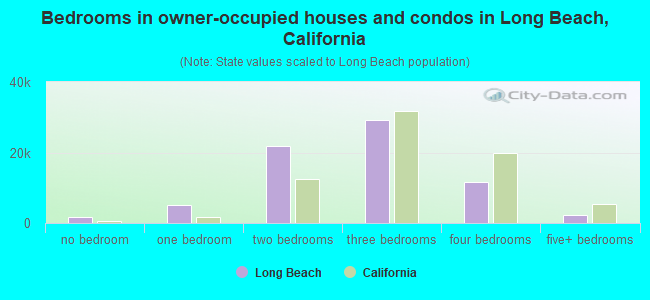
- Bedrooms in owner-occupied houses and condos in Long Beach, California
- 1,646no bedroom
- 5,1811 bedroom
- 21,8802 bedrooms
- 29,3113 bedrooms
- 11,5794 bedrooms
- 2,3315+ bedrooms

- Bedrooms in renter-occupied apartments in Long Beach, California
- 13,562no bedroom
- 31,8581 bedroom
- 39,0452 bedrooms
- 11,8373 bedrooms
- 2,2594 bedrooms
- 4765+ bedrooms
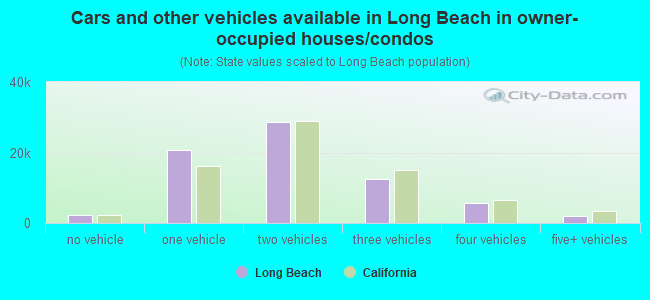
- Cars and other vehicles available in Long Beach in owner-occupied houses/condos
- 2,368no vehicle
- 20,6441 vehicle
- 28,6042 vehicles
- 12,3813 vehicles
- 5,8064 vehicles
- 2,1255+ vehicles
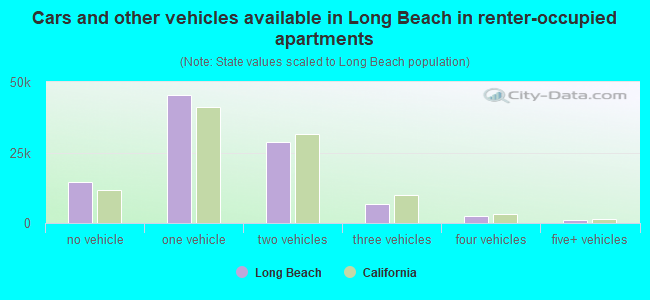
- Cars and other vehicles available in Long Beach in renter-occupied apartments
- 14,422no vehicle
- 45,3921 vehicle
- 28,8902 vehicles
- 6,8913 vehicles
- 2,5334 vehicles
- 9095+ vehicles
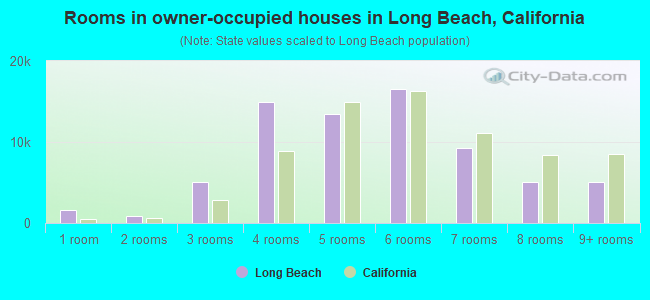
- Rooms in owner-occupied houses in Long Beach, California
- 1,6461 room
- 8952 rooms
- 5,0513 rooms
- 14,9724 rooms
- 13,4345 rooms
- 16,5666 rooms
- 9,2237 rooms
- 5,0548 rooms
- 5,0879+ rooms
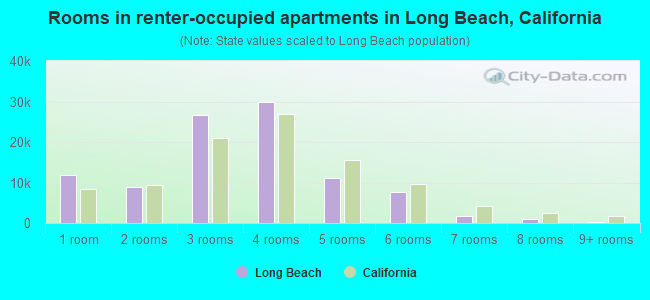
- Rooms in renter-occupied apartments in Long Beach, California
- 11,7831 room
- 8,8252 rooms
- 26,6903 rooms
- 29,9194 rooms
- 11,0085 rooms
- 7,5836 rooms
- 1,8217 rooms
- 1,0878 rooms
- 3219+ rooms
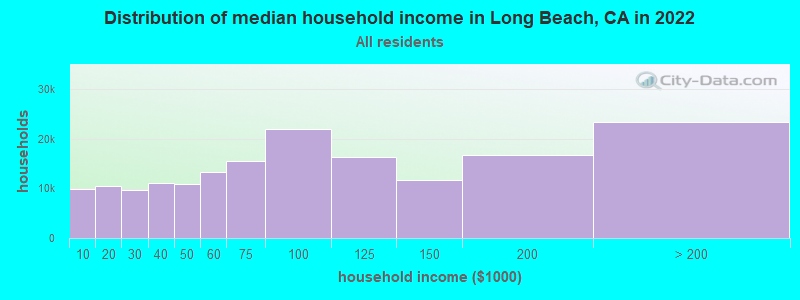
Long Beach, CA household income distribution

- 9,905Less than $10,000
- 10,461$10,000 to $19,999
- 9,649$20,000 to $29,999
- 11,184$30,000 to $39,999
- 10,806$40,000 to $49,999
- 13,366$50,000 to $59,999
- 15,562$60,000 to $74,999
- 21,960$75,000 to $99,999
- 16,273$100,000 to $124,999
- 11,691$125,000 to $149,999
- 16,730$150,000 to $199,999
- 23,378$200,000 or more
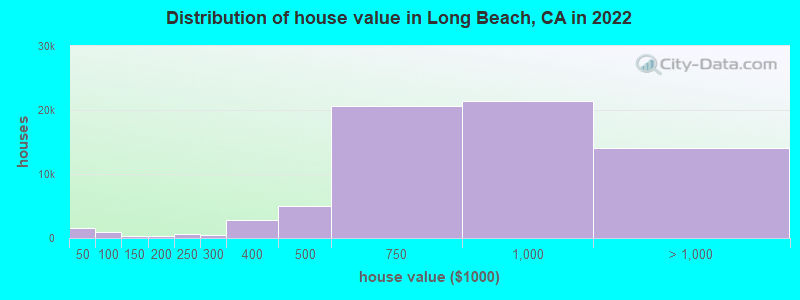
Home value of owner - occupied houses in 2022 in Long Beach, CA
-
- 1,158Less than $10,000
- 53$10,000 to $14,999
- 35$15,000 to $19,999
- 30$20,000 to $24,999
- 54$25,000 to $29,999
- 37$30,000 to $34,999
- 78$35,000 to $39,999
- 169$40,000 to $49,999
- 317$50,000 to $59,999
- 90$60,000 to $69,999
- 64$70,000 to $79,999
- 234$80,000 to $89,999
- 97$90,000 to $99,999
- 304$100,000 to $124,999
- 36$125,000 to $149,999
- 154$150,000 to $174,999
- 85$175,000 to $199,999
- 570$200,000 to $249,999
- 416$250,000 to $299,999
- 2,817$300,000 to $399,999
- 4,968$400,000 to $499,999
- 20,653$500,000 to $749,999
- 21,358$750,000 to $999,999
- 9,521$1,000,000 to $1,499,999
- 2,625$1,500,000 to $1,999,999
- 1,918$2,000,000 or more
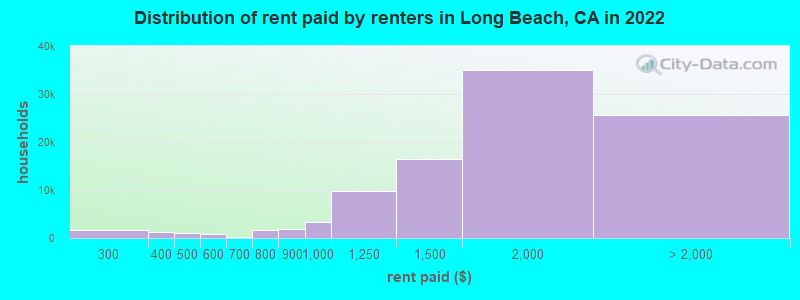
Rent paid by renters in 2022 in Long Beach, CA
-
- 272Less than $100
- 696$200 to $249
- 920$250 to $299
- 1,126$300 to $349
- 195$350 to $399
- 667$400 to $449
- 282$450 to $499
- 533$500 to $549
- 350$550 to $599
- 175$650 to $699
- 931$700 to $749
- 717$750 to $799
- 1,923$800 to $899
- 3,310$900 to $999
- 9,862$1,000 to $1,249
- 16,484$1,250 to $1,499
- 34,907$1,500 to $1,999
- 10,438$2,000 to $2,499
- 6,449$2,500 to $2,999
- 5,106$3,000 to $3,499
- 1,511$3,500 or more
- 2,183No cash rent

Percentage of workers working in this county: 84.8%
Number of people working at home: 34,015 (14.9% of all workers)

Travel time to work (commute)
- Less than 5 minutes: 1,615
- 5 to 9 minutes: 12,555
- 10 to 14 minutes: 22,882
- 15 to 19 minutes: 26,147
- 20 to 24 minutes: 29,549
- 25 to 29 minutes: 8,683
- 30 to 34 minutes: 33,698
- 35 to 39 minutes: 6,950
- 40 to 44 minutes: 10,393
- 45 to 59 minutes: 19,859
- 60 to 89 minutes: 15,981
- 90 or more minutes: 5,871

Means of transportation to work:
- Drove a car alone: 128,432 (66.3%)
- Carpooled: 14,479 (7.5%)
- Bus: 5,439 (2.8%)
- Subway or elevated rail: 103 (0.1%)
- Long-distance train or commuter rail: 216 (0.1%)
- Light rail, streetcar or trolley: 37 (0.0%)
- Taxi: 3,182 (1.6%)
- Bicycle: 1,778 (0.9%)
- Walked: 6,162 (3.2%)
- Worked at home: 34,015 (17.5%)

- Unemployment by race in 2022
- Unemployment rate for White non-Hispanic residents
- 5.8%Males
- 2.9%Females
- Unemployment rate for Black residents
- 5.9%Males
- 7.4%Females
- Unemployment rate for American Indian and Alaska Native residents
- 3.9%Males
- 3.6%Females
- Unemployment rate for Asian residents
- 2.2%Males
- 5.6%Females
- Unemployment rate for other race residents
- 3.8%Males
- 8.2%Females
- Unemployment rate for two or more race residents
- 5.1%Males
- 6.2%Females
- Unemployment rate for Hispanic or Latino residents
- 4.0%Males
- 6.6%Females

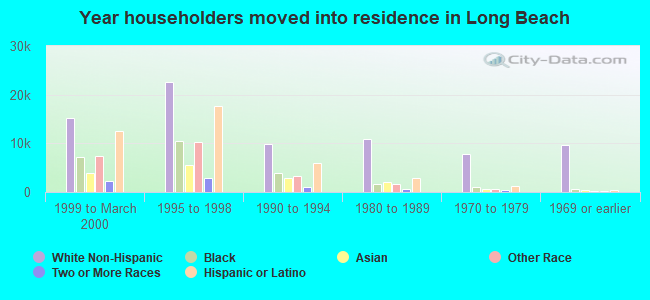
- Year of entry for the foreign-born population in Long Beach, California
- 16,1572010 or later
- 22,2542000 to 2009
- 23,2441990 to 1999
- 53,5461980 to 1989
- 22,2531970 to 1979
- 9,809Before 1970
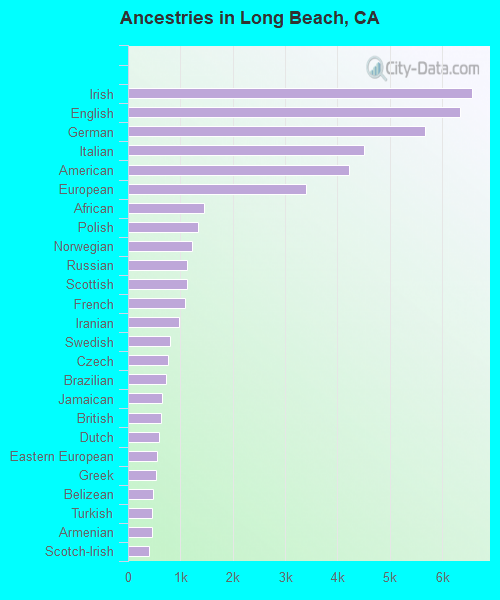
First ancestries reported:
- Irish: 6,568 (2.4%)
- English: 6,345 (2.3%)
- German: 5,674 (2.1%)
- Italian: 4,506 (1.6%)
- American: 4,217 (1.5%)
- European: 3,399 (1.2%)
- African: 1,445 (0.5%)
- Polish: 1,342 (0.5%)
- Norwegian: 1,227 (0.4%)
- Russian: 1,127 (0.4%)
- Scottish: 1,126 (0.4%)
- French: 1,083 (0.4%)
- Iranian: 969 (0.4%)
- Swedish: 806 (0.3%)
- Czech: 756 (0.3%)
- Brazilian: 731 (0.3%)
- Jamaican: 643 (0.2%)
- British: 628 (0.2%)
- Dutch: 593 (0.2%)
- Eastern European: 553 (0.2%)
- Greek: 526 (0.2%)
- Belizean: 469 (0.2%)
- Turkish: 461 (0.2%)
- Armenian: 458 (0.2%)
- Scotch-Irish: 405 (0.1%)
- French Canadian: 363 (0.1%)
- Welsh: 330 (0.1%)
- Ukrainian: 329 (0.1%)
- Scandinavian: 323 (0.1%)
- Portuguese: 320 (0.1%)
- Canadian: 314 (0.1%)
- Danish: 308 (0.1%)
- Egyptian: 276 (0.10%)
- Nigerian: 264 (0.10%)
- Israeli: 260 (0.09%)
- Sudanese: 260 (0.09%)
- Hungarian: 221 (0.08%)
- Croatian: 198 (0.07%)
- Kenyan: 197 (0.07%)
- Northern European: 184 (0.07%)
- Lebanese: 181 (0.07%)
- Belgian: 179 (0.06%)
- West Indian: 155 (0.06%)
- Lithuanian: 151 (0.05%)
- Trinidadian and Tobagonian: 133 (0.05%)
- Finnish: 116 (0.04%)
- South African: 108 (0.04%)
- Dutch West Indian: 106 (0.04%)
- Albanian: 99 (0.04%)
- Czechoslovakian: 83 (0.03%)
- Austrian: 79 (0.03%)
- Slovak: 75 (0.03%)
- Romanian: 71 (0.03%)
- Cape Verdean: 62 (0.02%)
- Cajun: 62 (0.02%)
- Swiss: 60 (0.02%)
- Icelander: 59 (0.02%)
- Australian: 58 (0.02%)
- Serbian: 56 (0.02%)
- Ethiopian: 55 (0.02%)
- Haitian: 54 (0.02%)
- British West Indian: 52 (0.02%)
- Slavic: 49 (0.02%)
- Yugoslavian: 42 (0.02%)
- Ghanaian: 40 (0.01%)
- Arab: 37 (0.01%)
- Latvian: 29 (0.01%)
- Jordanian: 26 (0.01%)
- Pennsylvania German: 23 (0.01%)
- Assyrian: 21 (0.01%)
- Palestinian: 20 (0.01%)
- Slovene: 17 (0.01%)
- Basque: 14 (0.01%)
Most common places of birth for foreign-born residents (%):
| Long Beach: | 44.8% (49,496) |
| California: | 37.2% (3,881,193) |
| Long Beach: | 11.9% (13,178) |
| California: | 7.8% (818,297) |
| Long Beach: | 8.3% (9,151) |
| California: | 0.5% (51,974) |
| Long Beach: | 3.8% (4,201) |
| California: | 4.2% (440,287) |
| Long Beach: | 3.1% (3,379) |
| California: | 2.8% (290,436) |
| Long Beach: | 2.6% (2,861) |
| California: | 0.6% (66,590) |
| Long Beach: | 1.9% (2,081) |
| California: | 4.9% (512,335) |
| Long Beach: | 1.6% (1,727) |
| California: | 3.0% (315,248) |
Place of birth for U.S.-born residents:
- This state: 281,529
- Other state: 56,608
- Northeast: 12,566
- Midwest: 14,806
- South: 20,095
- West: 9,141
88.9% of Long Beach residents lived in the same house 1 years ago.
Out of people who lived in different houses, 40.8% lived in this county.
Out of people who lived in different counties, 61.3% lived in California.
| Long Beach: | 88.9% |
| State average: | 88.9% |
Education attainment for males 25 years and older:
- No schooling: 9,738
- Nursery to 4th grade: 1,074
- 5th and 6th grade: 2,266
- 7th and 8th grade: 1,219
- 9th grade: 2,054
- 10th grade: 922
- 11th grade: 2,401
- 12th grade, no diploma: 4,281
- High school graduate (or equivalency): 29,191
- Less than 1 year of college: 9,512
- Some college more than 1 year, no degree: 27,523
- Associate degree: 7,688
- Bachelor's degree: 35,576
- Master's degree: 12,593
- Professional school degree: 2,859
- Doctorate degree: 2,714

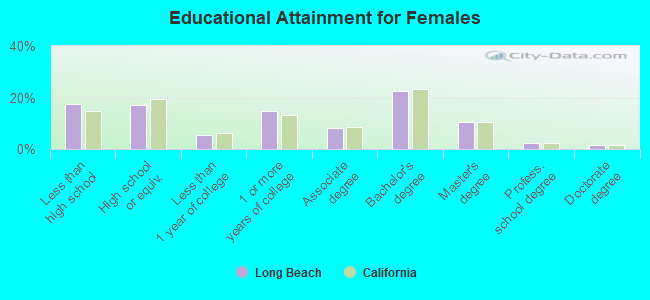
Education attainment for females 25 years and older:
- No schooling: 12,035
- Nursery to 4th grade: 1,336
- 5th and 6th grade: 4,602
- 7th and 8th grade: 1,992
- 9th grade: 1,191
- 10th grade: 1,446
- 11th grade: 2,144
- 12th grade, no diploma: 4,006
- High school graduate (or equivalency): 28,153
- Less than 1 year of college: 9,099
- Some college more than 1 year, no degree: 23,997
- Associate degree: 13,306
- Bachelor's degree: 37,090
- Master's degree: 17,459
- Professional school degree: 3,563
- Doctorate degree: 2,286
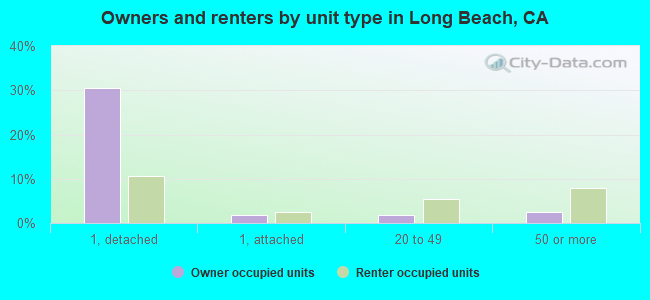
Housing units in structures:
- One, detached: 73,643
- One, attached: 8,755
- Two: 7,133
- 3 or 4: 17,872
- 5 to 9: 20,009
- 10 to 19: 18,955
- 20 to 49: 12,839
- 50 or more: 19,524
- Mobile homes: 2,346
- Boats, RVs, vans, etc.: 175
Median worth of mobile homes: $58,500
Housing units lacking complete kitchen facilities in 2022: 2.8%
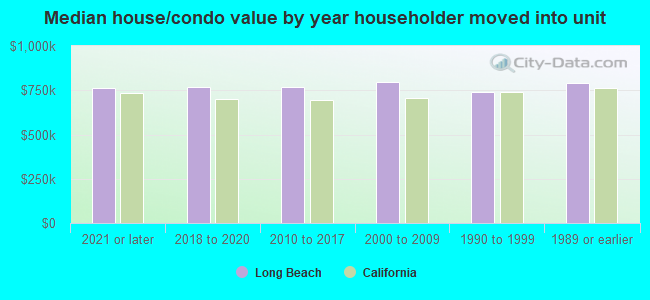
House/condo owner moved in on average 15 years ago
Renter moved in on average 4 years ago
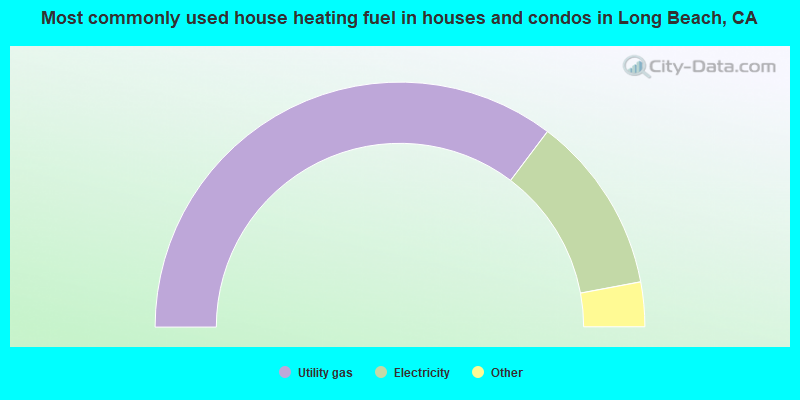
- 70.6%Utility gas
- 23.5%Electricity
- 3.8%No fuel used
- 1.1%Bottled, tank, or LP gas
- 0.7%Solar energy
- 0.2%Wood
- 0.2%Other fuel
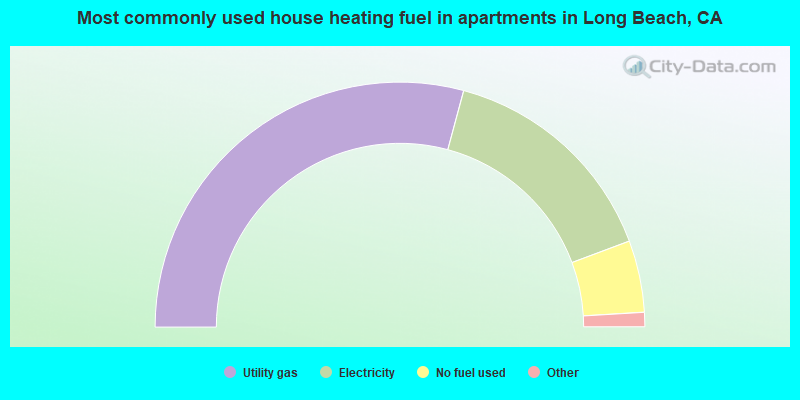
- 58.4%Utility gas
- 30.2%Electricity
- 9.5%No fuel used
- 1.5%Bottled, tank, or LP gas
- 0.1%Fuel oil, kerosene, etc.
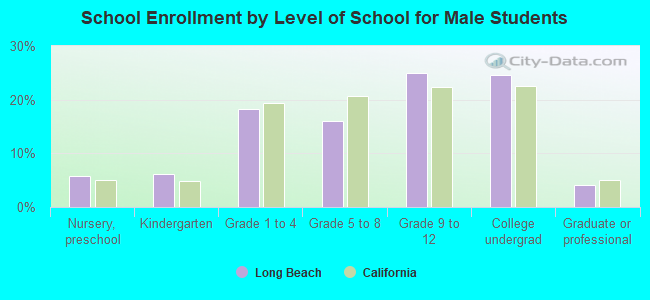
Private vs. public school enrollment:
| Here: | 4.8% |
| California: | 10.5% |
| Here: | 3.5% |
| California: | 8.5% |
| Here: | 12.3% |
| California: | 15.9% |