Housing density: 1,404 houses/condos per square mile
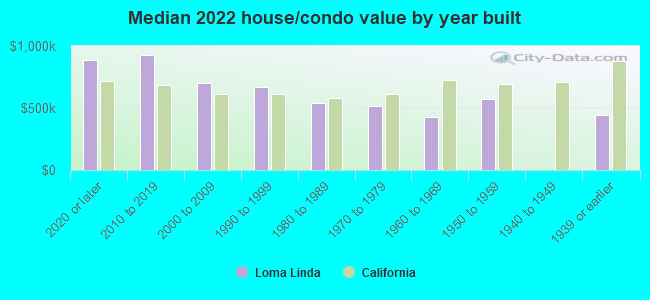
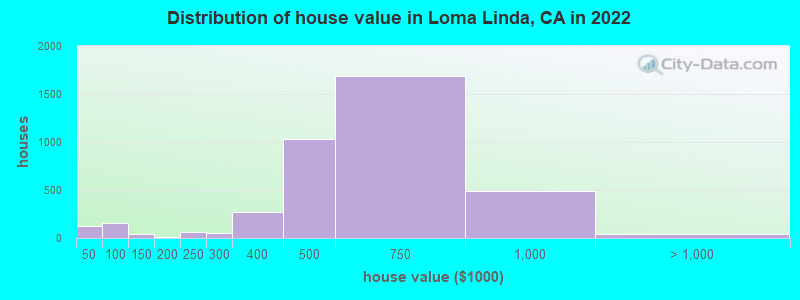
Median price asked for vacant for-sale houses and condos in 2022: $958,645.
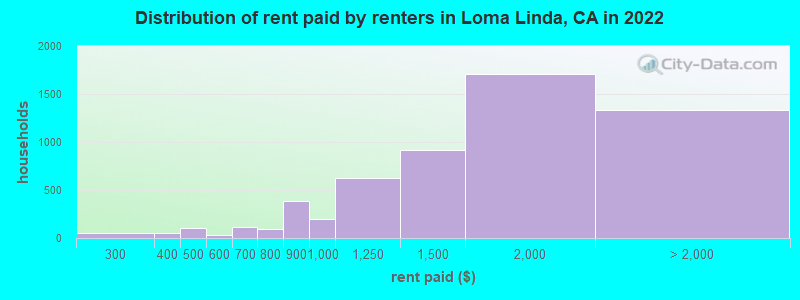
Median contract rent in 2022: $1,564 (lower quartile is $1,157, upper quartile is $1,986)
Median rent asked for vacant for-rent units in 2022: $1,561
Median gross rent in Loma Linda, CA in 2022: $1,711
Housing units in Loma Linda with a mortgage: 2,175 (72 second mortgage, 0 home equity loan, 76 both second mortgage and home equity loan) Houses without a mortgage: 32
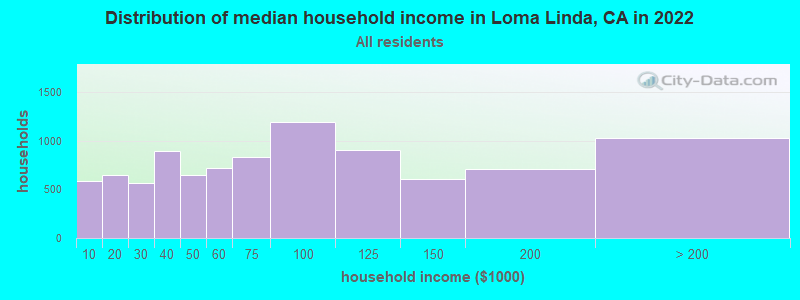
Median household income for houses/condos with a mortgage: $138,435
Median household income for apartments without a mortgage: $94,807
3,241 married couples with children.
916 single-parent households (171 men, 745 women).
52.1% of residents of Loma Linda speak English at home.
21.2% of residents speak Spanish at home (69% speak English very well, 20% speak English well, 7% speak English not well, 4% don't speak English at all).
4.1% of residents speak other Indo-European language at home (65% speak English very well, 13% speak English well, 13% speak English not well, 9% don't speak English at all).
16.2% of residents speak Asian or Pacific Island language at home (64% speak English very well, 23% speak English well, 12% speak English not well, 1% don't speak English at all).
7.2% of residents speak other language at home (86% speak English very well, 9% speak English well, 4% speak English not well).
Foreign born population: 7,731 (30.9%)
(58.8% of them are naturalized citizens)
Percentage of workers working in this county: 88.9% Number of people working at home: 1,538 (13.6% of all workers)
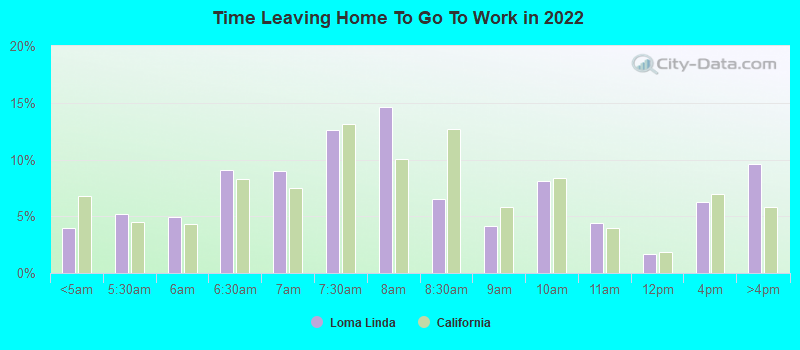
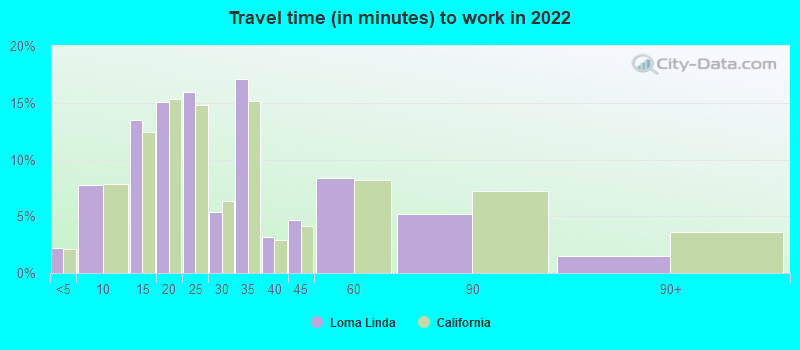
Travel time to work (commute)
Less than 5 minutes: 381
5 to 9 minutes: 1,338
10 to 14 minutes: 1,899
15 to 19 minutes: 1,838
20 to 24 minutes: 1,072
25 to 29 minutes: 722
30 to 34 minutes: 1,120
35 to 39 minutes: 215
40 to 44 minutes: 205
45 to 59 minutes: 510
60 to 89 minutes: 476
90 or more minutes: 110
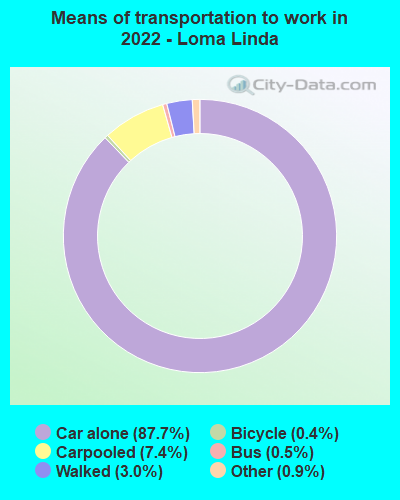
Means of transportation to work:
Drove a car alone: 17,637 (79.9%)
Carpooled: 1,606 (7.3%)
Bus: 111 (0.5%)
Taxi: 198 (0.9%)
Bicycle: 74 (0.3%)
Walked: 664 (3.0%)
Worked at home: 1,538 (7.0%)
Unemployment by race in 2022
Unemployment rate for White non-Hispanic residents
4.6%Males
11.6%Females
Unemployment rate for Black residents
9.0%Males
8.9%Females
Unemployment rate for American Indian and Alaska Native residents
10.8%Males
Unemployment rate for Asian residents
2.4%Males
7.1%Females
Unemployment rate for other race residents
3.3%Males
3.3%Females
Unemployment rate for two or more race residents
4.9%Females
Unemployment rate for Hispanic or Latino residents
3.0%Males
4.0%Females
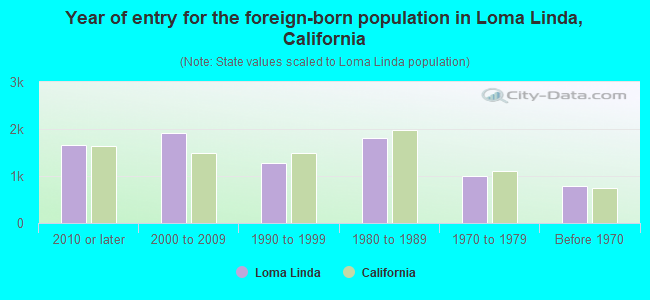
Year of entry for the foreign-born population in Loma Linda, California
1,6612010 or later
1,9172000 to 2009
1,2751990 to 1999
1,8011980 to 1989
9971970 to 1979
790Before 1970
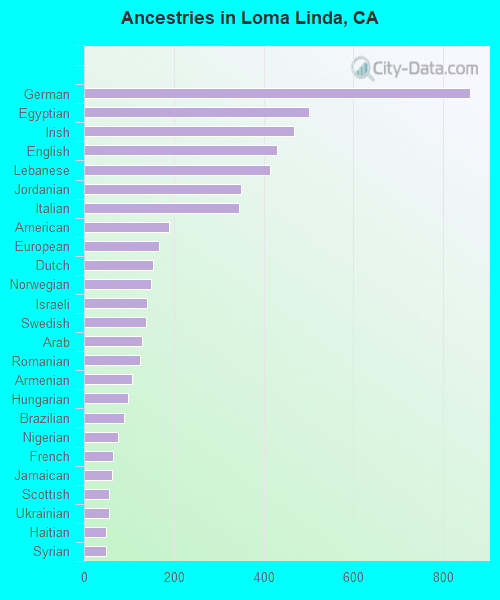
First ancestries reported:
German: 859 (5.2%)
Egyptian: 502 (3.0%)
Irish: 468 (2.8%)
English: 429 (2.6%)
Lebanese: 414 (2.5%)
Jordanian: 349 (2.1%)
Italian: 346 (2.1%)
American: 190 (1.1%)
European: 168 (1.0%)
Dutch: 153 (0.9%)
Norwegian: 150 (0.9%)
Israeli: 141 (0.8%)
Swedish: 139 (0.8%)
Arab: 130 (0.8%)
Romanian: 124 (0.7%)
Armenian: 107 (0.6%)
Hungarian: 99 (0.6%)
Brazilian: 90 (0.5%)
Nigerian: 75 (0.4%)
French: 64 (0.4%)
Jamaican: 62 (0.4%)
Scottish: 55 (0.3%)
Ukrainian: 55 (0.3%)
Haitian: 50 (0.3%)
Syrian: 48 (0.3%)
Trinidadian and Tobagonian: 46 (0.3%)
Russian: 46 (0.3%)
French Canadian: 38 (0.2%)
Zimbabwean: 35 (0.2%)
Danish: 28 (0.2%)
Ethiopian: 20 (0.1%)
Iranian: 17 (0.1%)
Bulgarian: 16 (0.10%)
Canadian: 15 (0.09%)
Australian: 12 (0.07%)
Northern European: 12 (0.07%)
British: 11 (0.07%)
Swiss: 11 (0.07%)
Finnish: 10 (0.06%)
Scandinavian: 8 (0.05%)
Barbadian: 8 (0.05%)
Polish: 5 (0.03%)
Most common places of birth for foreign-born residents (%):
Mexico
Loma Linda:
16.1% (1,210)
California:
37.2% (3,881,193)
Philippines
Loma Linda:
13.7% (1,033)
California:
7.8% (818,297)
Indonesia
Loma Linda:
6.6% (494)
California:
0.4% (39,097)
Lebanon
Loma Linda:
5.8% (438)
California:
0.3% (31,757)
India
Loma Linda:
5.6% (418)
California:
5.2% (539,184)
Korea
Loma Linda:
4.4% (329)
California:
3.0% (315,248)
Vietnam
Loma Linda:
4.1% (312)
California:
4.9% (512,335)
Peru
Loma Linda:
3.1% (230)
California:
0.7% (74,025)
Thailand
Loma Linda:
2.9% (222)
California:
0.6% (65,335)
Egypt
Loma Linda:
2.7% (205)
California:
0.4% (42,718)
El Salvador
Loma Linda:
2.6% (196)
California:
4.2% (440,287)
China, excluding Hong Kong and Taiwan
Loma Linda:
2.4% (178)
California:
6.6% (684,672)
Canada
Loma Linda:
2.3% (172)
California:
1.2% (127,477)
Romania
Loma Linda:
2.0% (149)
California:
0.2% (23,058)
Jordan
Loma Linda:
1.7% (130)
California:
0.2% (16,384)
Nigeria
Loma Linda:
1.6% (122)
California:
0.3% (35,557)
Place of birth for U.S.-born residents:
This state: 12,907
Other state: 3,898
Northeast: 883
Midwest: 1,083
South: 1,199
West: 747
91.0% of Loma Linda residents lived in the same house 1 years ago. Out of people who lived in different houses, 38.0% lived in this county. Out of people who lived in different counties, 74.3% lived in California.
Loma Linda:
91.0%
State average:
88.9%
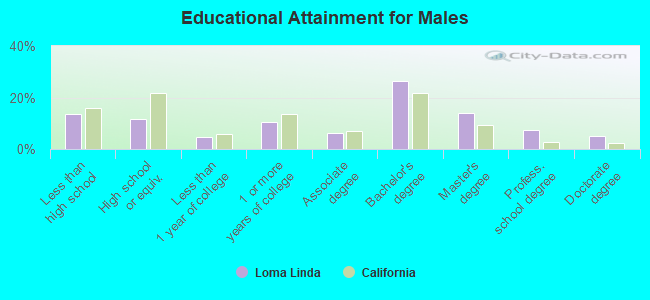
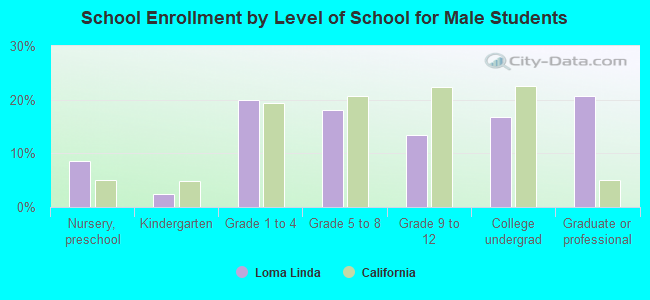
Education attainment for males 25 years and older:
No schooling: 340
Nursery to 4th grade: 54
5th and 6th grade: 174
7th and 8th grade: 7
9th grade: 160
10th grade: 86
11th grade: 213
12th grade, no diploma: 94
High school graduate (or equivalency): 978
Less than 1 year of college: 373
Some college more than 1 year, no degree: 876
Associate degree: 520
Bachelor's degree: 2,189
Master's degree: 1,154
Professional school degree: 613
Doctorate degree: 431
Education attainment for females 25 years and older:
No schooling: 165
Nursery to 4th grade: 89
5th and 6th grade: 67
7th and 8th grade: 48
9th grade: 144
10th grade: 96
11th grade: 71
12th grade, no diploma: 101
High school graduate (or equivalency): 1,872
Less than 1 year of college: 490
Some college more than 1 year, no degree: 1,159
Associate degree: 959
Bachelor's degree: 2,612
Master's degree: 1,382
Professional school degree: 683
Doctorate degree: 319
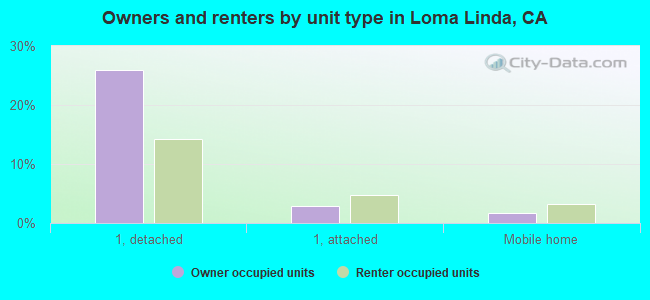
Housing units in structures:
One, detached: 4,719
One, attached: 504
Two: 113
3 or 4: 784
5 to 9: 934
10 to 19: 662
20 to 49: 749
50 or more: 1,375
Mobile homes: 466
Boats, RVs, vans, etc.: 7
Housing units lacking complete plumbing facilities in 2022: 0.2%
Housing units lacking complete kitchen facilities in 2022: 4.6%
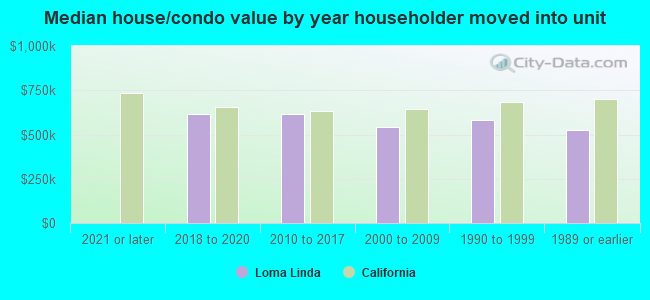
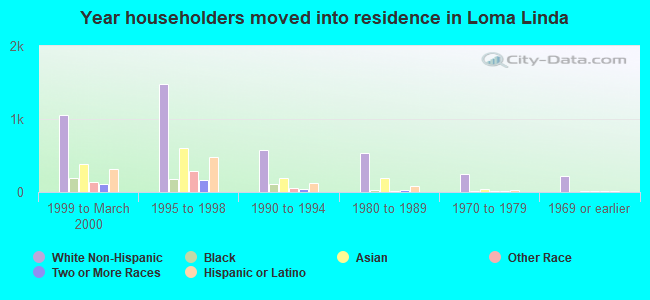
House/condo owner moved in on average 15 years ago