Little Rice, WI (Wisconsin) Houses and Residents
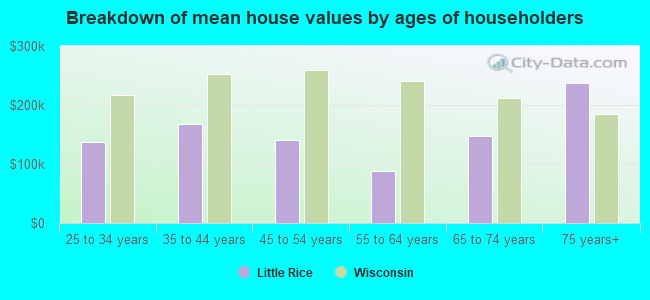
| Little Rice: | $189,187 |
| Wisconsin: | $252,800 |
Total population: 306 (Urban population: 0, Rural population: 332 (all nonfarm))
Houses: 426 (150 occupied: 145 owner occupied, 5 renter occupied)
| % of renters here: | 3% |
| State: | 32% |
Housing density: 6 houses/condos per square mile
Median price asked for vacant for-sale houses and condos in 2022 in this county: $191,214.
Median contract rent in 2022: $1,031 (lower quartile is $1,020, upper quartile is $1,064)
Median rent asked for vacant for-rent units in 2022: $538
Median gross rent in Little Rice, WI in 2022: $1,285
Housing units in Little Rice with a mortgage: 39 (0 second mortgage, 8 home equity loan, 0 both second mortgage and home equity loan)
Houses without a mortgage: 38
Compare current foreclosures near Little Rice, WI:
| Photo | Address | Area | Beds / Baths | Price | Details |
|---|---|---|---|---|---|

|
#1
Heafford Rd
Tomahawk, WI 54487
|
- sq. feet
|
- baths - beds |
show details | |

|
#2
County Road Cc
Tomahawk, WI 54487
|
- sq. feet
|
- baths - beds |
show details | |

|
#3
Musky Point Rd
Tomahawk, WI 54487
|
- sq. feet
|
- baths - beds |
show details | |

|
#4
E Birchwood Ave Apt 11
Tomahawk, WI 54487
|
- sq. feet
|
- baths - beds |
show details | |

|
#5
N Pine Square Rd
Tomahawk, WI 54487
|
- sq. feet
|
- baths - beds |
show details | |

|
#6
E Park Ave
Tomahawk, WI 54487
|
- sq. feet
|
- baths - beds |
show details | |

|
#7
Yukon Trl
Minocqua, WI 54548
|
- sq. feet
|
- baths - beds |
show details | |

|
#8
Fawn Lake Rd
Lake Tomahawk, WI 54539
|
- sq. feet
|
- baths - beds |
show details | |

|
#9
Star Dr
Minocqua, WI 54548
|
- sq. feet
|
- baths - beds |
show details | |

|
#10
Kilawee Rd
Minocqua, WI 54548
|
- sq. feet
|
- baths - beds |
show details |
| Photo | Address | Area | Beds / Baths | Price | Details |
|---|---|---|---|---|---|

|
#11
Doolittle Rd
Minocqua, WI 54548
|
- sq. feet
|
- baths - beds |
show details | |

|
Check over 1 million property listings on Foreclosure.com!
|
browse all offers | |||

Household type by relationship:
Households: 35,388- In family households: 28,613 (6,968 male householders, 3,428 female householders)
8,547 spouses, 7,935 children (7,373 natural, 189 adopted, 373 stepchildren), 321 grandchildren, 170 brothers or sisters, 260 parents, foster children, 178 other relatives, 705 non-relatives
- In nonfamily households: 6,775 (2,876 male householders (2,232 living alone)), 2,731 female householders (2,390 living alone)), 1,168 nonrelatives
- In group quarters: 610 (520 institutionalized population)
6,049 married couples with children.
1,603 single-parent households (480 men, 1,123 women).
96.4% of residents of Little Rice speak English at home.
0.6% of residents speak Spanish at home (100% speak English very well).
3.0% of residents speak other Indo-European language at home (80% speak English very well, 20% speak English well).
Foreign born population: 8 (2.1%)
(87.5% of them are naturalized citizens)
| Here: | 4.4 |
| State: | 6.5 |
| Here: | 4.7 |
| State: | 4.1 |
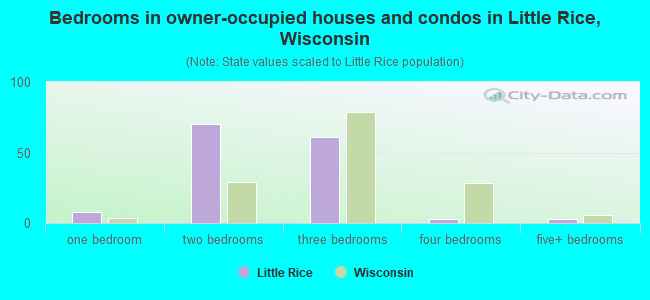
- Bedrooms in owner-occupied houses and condos in Little Rice, Wisconsin
- 0no bedroom
- 81 bedroom
- 702 bedrooms
- 613 bedrooms
- 34 bedrooms
- 35+ bedrooms
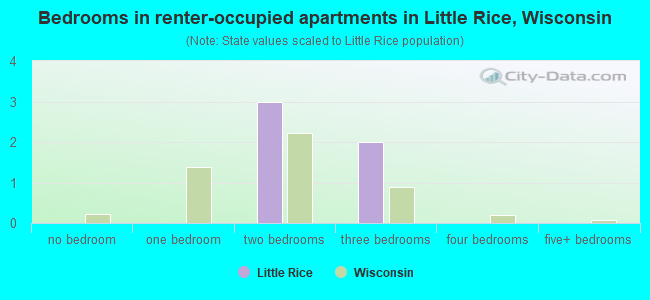
- Bedrooms in renter-occupied apartments in Little Rice, Wisconsin
- 0no bedroom
- 01 bedroom
- 32 bedrooms
- 23 bedrooms
- 04 bedrooms
- 05+ bedrooms
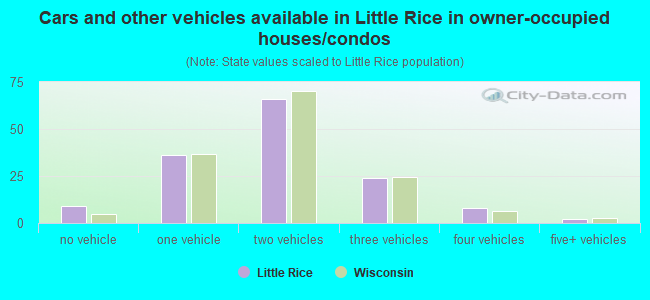
- Cars and other vehicles available in Little Rice in owner-occupied houses/condos
- 9no vehicle
- 361 vehicle
- 662 vehicles
- 243 vehicles
- 84 vehicles
- 25+ vehicles
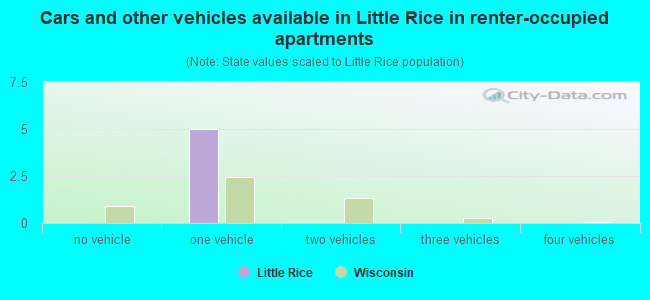
- Cars and other vehicles available in Little Rice in renter-occupied apartments
- 0no vehicle
- 51 vehicle
- 02 vehicles
- 03 vehicles
- 04 vehicles
- 05+ vehicles
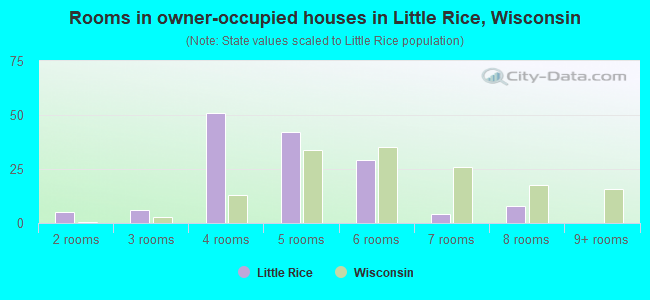
- Rooms in owner-occupied houses in Little Rice, Wisconsin
- 01 room
- 52 rooms
- 63 rooms
- 514 rooms
- 425 rooms
- 296 rooms
- 47 rooms
- 88 rooms
- 09+ rooms
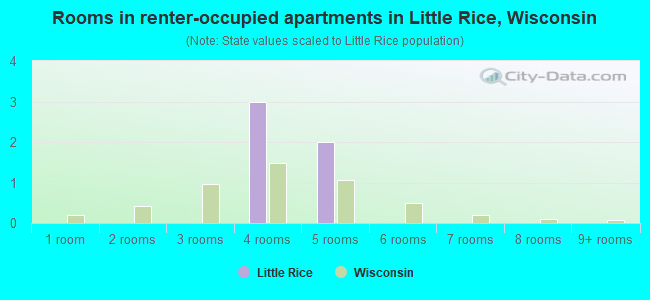
- Rooms in renter-occupied apartments in Little Rice, Wisconsin
- 01 room
- 02 rooms
- 03 rooms
- 34 rooms
- 25 rooms
- 06 rooms
- 07 rooms
- 08 rooms
- 09+ rooms

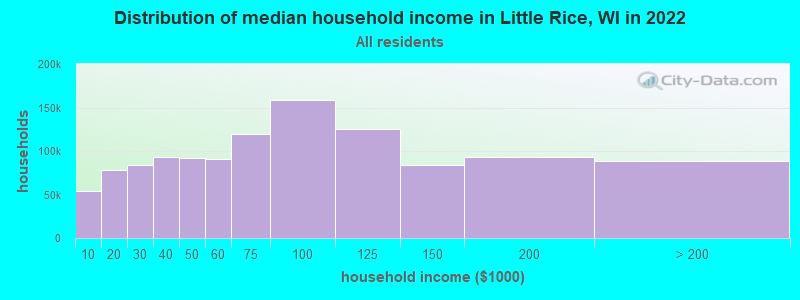
Little Rice, WI household income distribution

- 28,172Less than $10,000
- 40,849$10,000 to $19,999
- 47,175$20,000 to $29,999
- 50,820$30,000 to $39,999
- 54,906$40,000 to $49,999
- 55,783$50,000 to $59,999
- 73,561$60,000 to $74,999
- 104,362$75,000 to $99,999
- 89,402$100,000 to $124,999
- 59,327$125,000 to $149,999
- 64,137$150,000 to $199,999
- 56,097$200,000 or more
Percentage of workers working in this county: 43.8%
Number of people working at home: 20 (11.8% of all workers)
Travel time to work (commute)
- Less than 5 minutes: 0
- 5 to 9 minutes: 15
- 10 to 14 minutes: 14
- 15 to 19 minutes: 7
- 20 to 24 minutes: 27
- 25 to 29 minutes: 12
- 30 to 34 minutes: 36
- 35 to 39 minutes: 3
- 40 to 44 minutes: 6
- 45 to 59 minutes: 25
- 60 to 89 minutes: 0
- 90 or more minutes: 0
Means of transportation to work:
- Drove a car alone: 118 (78.7%)
- Carpooled: 18 (12.0%)
- Walked: 9 (6.0%)
- Worked at home: 5 (3.3%)
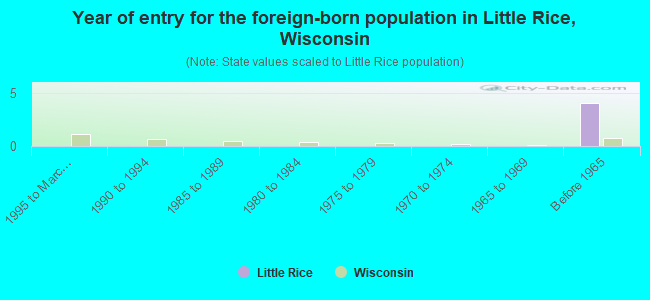
- Year of entry for the foreign-born population in Little Rice, Wisconsin
- 01995 to March 2000
- 01990 to 1994
- 01985 to 1989
- 01980 to 1984
- 01975 to 1979
- 01970 to 1974
- 01965 to 1969
- 4Before 1965
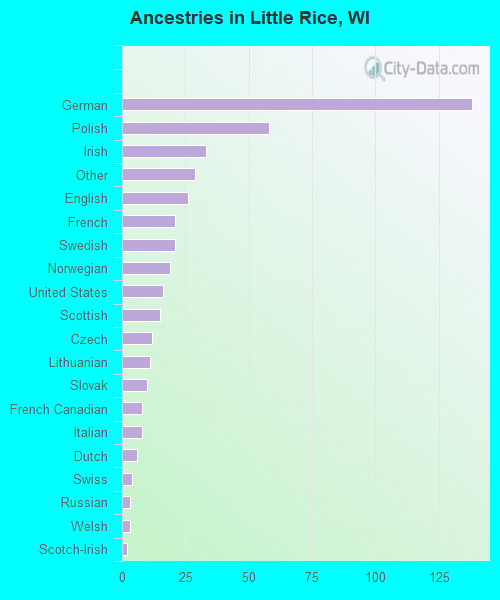
First ancestries reported:
- German: 138 (31.1%)
- Polish: 58 (13.1%)
- Irish: 33 (7.4%)
- Other: 29 (6.5%)
- English: 26 (5.9%)
- French: 21 (4.7%)
- Swedish: 21 (4.7%)
- Norwegian: 19 (4.3%)
- United States: 16 (3.6%)
- Scottish: 15 (3.4%)
- Czech: 12 (2.7%)
- Lithuanian: 11 (2.5%)
- Slovak: 10 (2.3%)
- French Canadian: 8 (1.8%)
- Italian: 8 (1.8%)
- Dutch: 6 (1.4%)
- Swiss: 4 (0.9%)
- Russian: 3 (0.7%)
- Welsh: 3 (0.7%)
- Scotch-Irish: 2 (0.5%)
- Danish: 1 (0.2%)
Most common places of birth for foreign-born residents (%):
| Little Rice: | 50.0% (2) |
| Wisconsin: | 0.5% (1,060) |
| Little Rice: | 50.0% (2) |
| Wisconsin: | 3.7% (7,189) |
Place of birth for U.S.-born residents:
- This state: 252
- Other state: 76
- Northeast: 12
- Midwest: 59
- South: 5
- West: 0
53% of Little Rice residents lived in the same house 5 years ago.
Out of people who lived in different houses, 7% lived in this county.
Out of people who lived in different counties, 90% lived in Wisconsin.
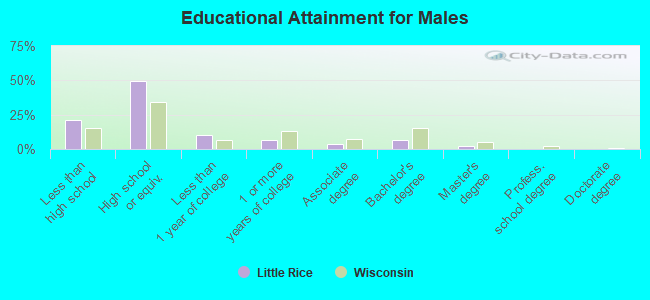
Education attainment for males 25 years and older:
- No schooling: 0
- Nursery to 4th grade: 0
- 5th and 6th grade: 0
- 7th and 8th grade: 10
- 9th grade: 0
- 10th grade: 5
- 11th grade: 9
- 12th grade, no diploma: 4
- High school graduate (or equivalency): 65
- Less than 1 year of college: 13
- Some college more than 1 year, no degree: 9
- Associate degree: 5
- Bachelor's degree: 9
- Master's degree: 3
- Professional school degree: 0
- Doctorate degree: 0
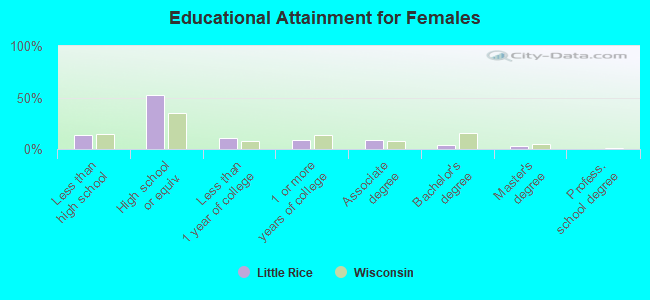
Education attainment for females 25 years and older:
- No schooling: 0
- Nursery to 4th grade: 0
- 5th and 6th grade: 0
- 7th and 8th grade: 2
- 9th grade: 0
- 10th grade: 7
- 11th grade: 7
- 12th grade, no diploma: 0
- High school graduate (or equivalency): 63
- Less than 1 year of college: 13
- Some college more than 1 year, no degree: 11
- Associate degree: 10
- Bachelor's degree: 5
- Master's degree: 3
- Professional school degree: 0
- Doctorate degree: 0
Housing units in structures:
- One, detached: 256
- One, attached: 3
- 3 or 4: 3
- Mobile homes: 164
Median worth of mobile homes: $108,150
Housing units lacking complete kitchen facilities: 11.3%
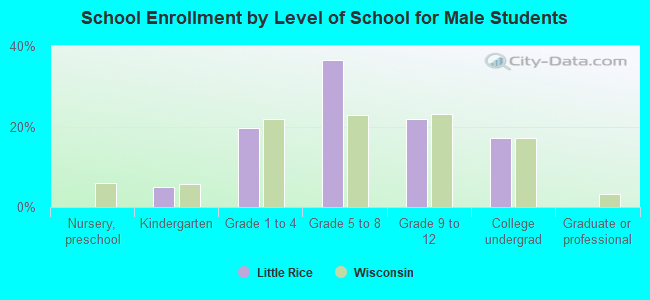
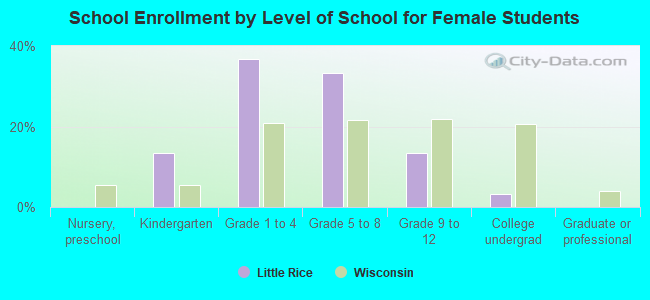
Private vs. public school enrollment:
| Here: | 11.4% |
| Wisconsin: | 16.4% |
| Here: | 0.0% |
| Wisconsin: | 9.1% |
| Here: | 0.0% |
| Wisconsin: | 18.1% |