Housing density: 1,742 houses/condos per square mile
Median price asked for vacant for-sale houses and condos in 2022 in this county: $113,595.
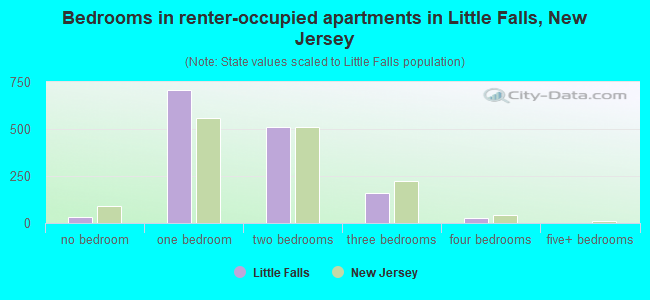
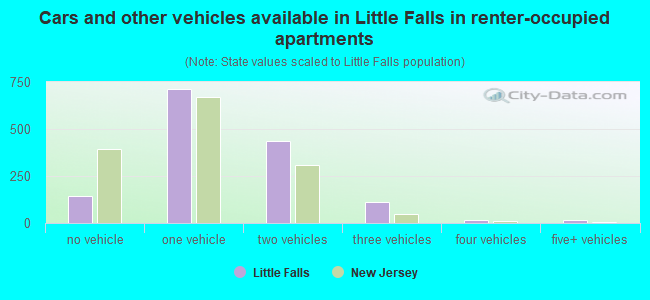
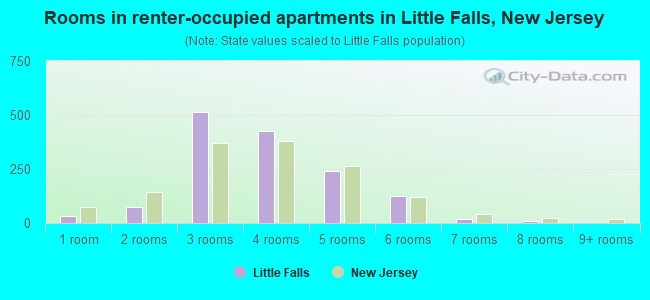
Median contract rent in 2022: $1,679 (lower quartile is $1,261, upper quartile is over $2,000)
Median rent asked for vacant for-rent units in 2022: $952
Median gross rent in Little Falls, NJ in 2022: $1,759
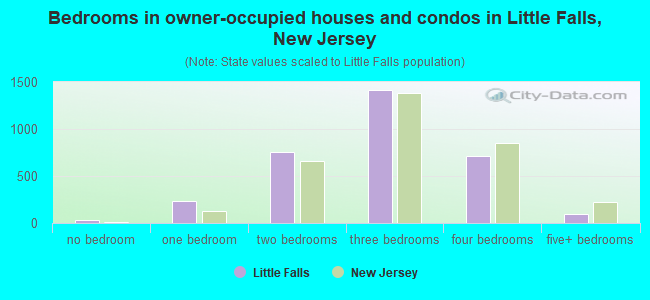
Housing units in Little Falls with a mortgage: 1,473 (119 second mortgage, 173 home equity loan, 0 both second mortgage and home equity loan) Houses without a mortgage: 1,028
In family households: 433,190 (75,969 male householders, 44,871 female householders)
81,287 spouses, 163,062 children (155,233 natural, 2,777 adopted, 5,052 stepchildren), 12,822 grandchildren, 9,893 brothers or sisters, 9,550 parents, foster children, 13,805 other relatives, 16,122 non-relatives
In nonfamily households: 57,017 (20,561 male householders (15,848 living alone)), 25,384 female householders (21,858 living alone)), 11,072 nonrelatives
In group quarters: 11,019 (3,291 institutionalized population)
79,516 married couples with children.
30,640 single-parent households (6,238 men, 24,402 women).
80.0% of residents of Little Falls speak English at home.
5.2% of residents speak Spanish at home (64% speak English very well, 17% speak English well, 10% speak English not well, 9% don't speak English at all).
10.4% of residents speak other Indo-European language at home (64% speak English very well, 24% speak English well, 9% speak English not well, 3% don't speak English at all).
2.4% of residents speak Asian or Pacific Island language at home (41% speak English very well, 59% speak English well).
2.0% of residents speak other language at home (75% speak English very well, 17% speak English well, 8% speak English not well).
Foreign born population: 1,857 (16.3%)
(71.8% of them are naturalized citizens)
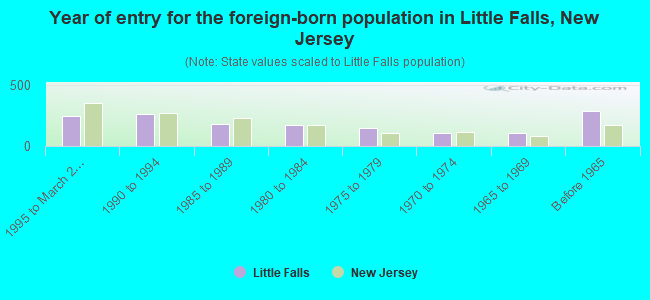
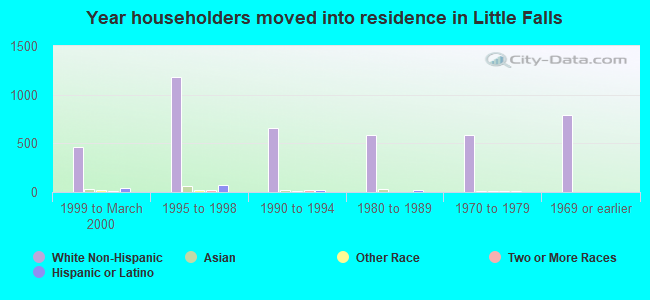
Year of entry for the foreign-born population in Little Falls, New Jersey
2441995 to March 2000
2581990 to 1994
1801985 to 1989
1681980 to 1984
1431975 to 1979
1071970 to 1974
1041965 to 1969
282Before 1965
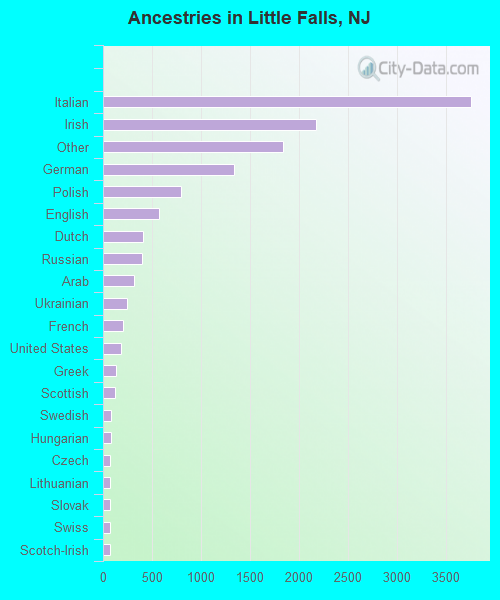
First ancestries reported:
Italian: 3,755 (28.6%)
Irish: 2,172 (16.5%)
Other: 1,834 (13.9%)
German: 1,337 (10.2%)
Polish: 792 (6.0%)
English: 567 (4.3%)
Dutch: 413 (3.1%)
Russian: 400 (3.0%)
Arab: 319 (2.4%)
Ukrainian: 242 (1.8%)
French: 203 (1.5%)
United States: 181 (1.4%)
Greek: 130 (1.0%)
Scottish: 123 (0.9%)
Swedish: 83 (0.6%)
Hungarian: 78 (0.6%)
Czech: 76 (0.6%)
Lithuanian: 72 (0.5%)
Slovak: 69 (0.5%)
Swiss: 68 (0.5%)
Scotch-Irish: 67 (0.5%)
Norwegian: 33 (0.3%)
Portuguese: 30 (0.2%)
West Indian: 30 (0.2%)
Danish: 27 (0.2%)
Welsh: 23 (0.2%)
Subsaharan African: 21 (0.2%)
French Canadian: 5 (0.04%)
Most common places of birth for foreign-born residents (%):
Italy
Little Falls:
16.6% (247)
New Jersey:
4.0% (58,395)
Colombia
Little Falls:
6.6% (98)
New Jersey:
4.7% (69,754)
Lebanon
Little Falls:
5.1% (76)
New Jersey:
0.3% (4,774)
Philippines
Little Falls:
5.1% (76)
New Jersey:
4.7% (69,773)
India
Little Falls:
5.0% (75)
New Jersey:
8.1% (119,497)
Poland
Little Falls:
4.8% (72)
New Jersey:
3.8% (55,466)
Syria
Little Falls:
3.5% (52)
New Jersey:
0.3% (4,530)
Cuba
Little Falls:
3.3% (49)
New Jersey:
3.7% (55,241)
Vietnam
Little Falls:
3.2% (48)
New Jersey:
0.9% (13,337)
Chile
Little Falls:
3.1% (46)
New Jersey:
0.4% (6,450)
Germany
Little Falls:
2.9% (43)
New Jersey:
2.3% (33,531)
Peru
Little Falls:
2.7% (40)
New Jersey:
3.1% (45,151)
Bangladesh
Little Falls:
2.3% (34)
New Jersey:
0.4% (5,929)
Greece
Little Falls:
2.2% (33)
New Jersey:
0.8% (12,403)
Costa Rica
Little Falls:
2.2% (32)
New Jersey:
0.8% (12,383)
Other Eastern Europe
Little Falls:
2.2% (32)
New Jersey:
1.2% (17,647)
Taiwan
Little Falls:
2.2% (32)
New Jersey:
1.2% (18,066)
Pakistan
Little Falls:
2.0% (29)
New Jersey:
1.1% (16,052)
Canada
Little Falls:
1.9% (28)
New Jersey:
1.1% (16,333)
Korea
Little Falls:
1.7% (26)
New Jersey:
3.5% (51,970)
Brazil
Little Falls:
1.5% (23)
New Jersey:
1.5% (22,097)
Place of birth for U.S.-born residents:
This state: 7,203
Other state: 2,036
Northeast: 1,614
Midwest: 122
South: 166
West: 134
65% of Little Falls residents lived in the same house 5 years ago. Out of people who lived in different houses, 55% lived in this county. Out of people who lived in different counties, 78% lived in New Jersey.
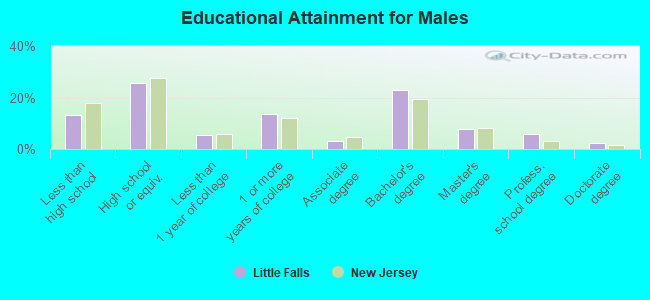
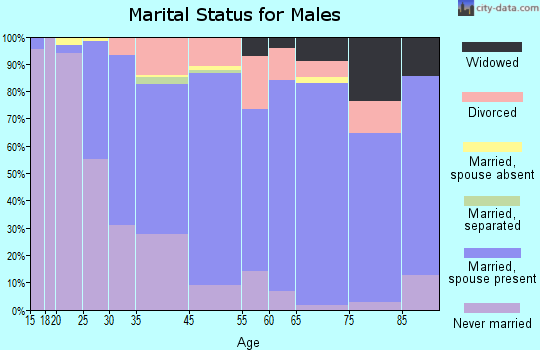
Education attainment for males 25 years and older:
No schooling: 38
Nursery to 4th grade: 8
5th and 6th grade: 29
7th and 8th grade: 103
9th grade: 31
10th grade: 109
11th grade: 68
12th grade, no diploma: 109
High school graduate (or equivalency): 965
Less than 1 year of college: 203
Some college more than 1 year, no degree: 509
Associate degree: 118
Bachelor's degree: 861
Master's degree: 291
Professional school degree: 221
Doctorate degree: 87
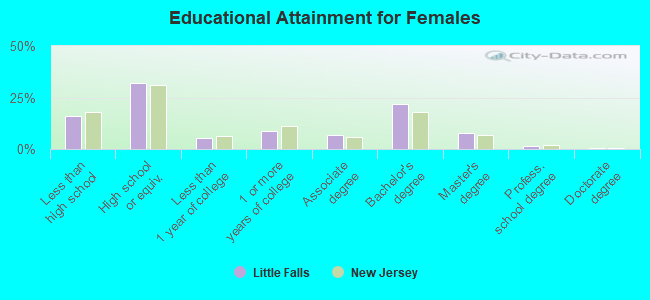
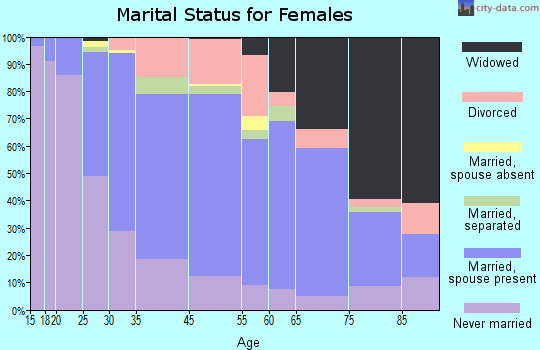
Education attainment for females 25 years and older:
No schooling: 25
Nursery to 4th grade: 43
5th and 6th grade: 70
7th and 8th grade: 177
9th grade: 52
10th grade: 96
11th grade: 95
12th grade, no diploma: 153
High school graduate (or equivalency): 1,418
Less than 1 year of college: 239
Some college more than 1 year, no degree: 382
Associate degree: 298
Bachelor's degree: 972
Master's degree: 335
Professional school degree: 55
Doctorate degree: 18
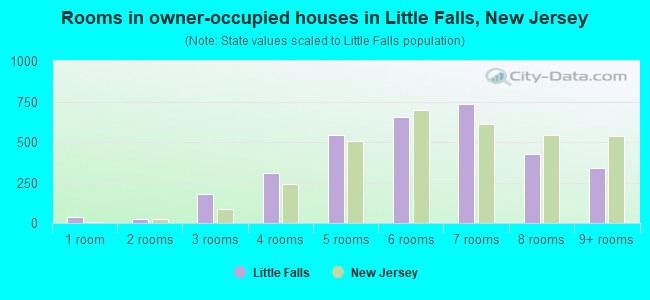
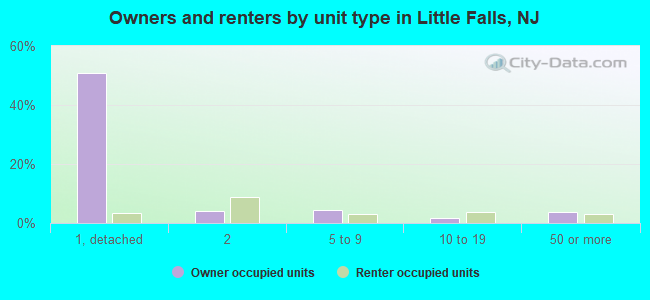
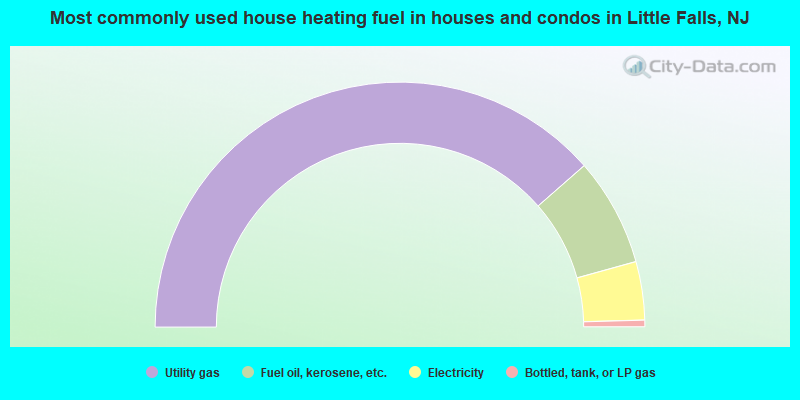
Housing units in structures:
One, detached: 2,599
One, attached: 256
Two: 612
3 or 4: 298
5 to 9: 349
10 to 19: 251
20 to 49: 105
50 or more: 327
Housing units lacking complete plumbing facilities: 0.2%
Housing units lacking complete kitchen facilities: 0.3%