Little Falls, MN (Minnesota) Houses and Residents
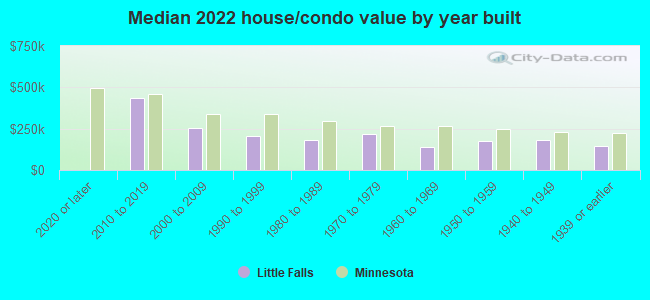
| Little Falls: | $187,246 |
| Minnesota: | $314,600 |
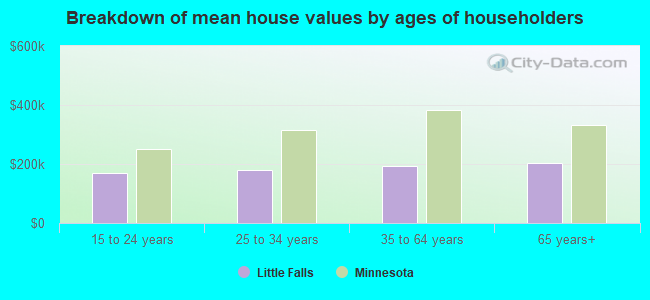
Mean price in 2022:
Detached houses: $204,749
Here: $204,749 State: $374,552 Townhouses or other attached units: $213,349
Here: $213,349 State: $312,049 Mobile homes: $38,489
Here: $38,489 State: $94,605
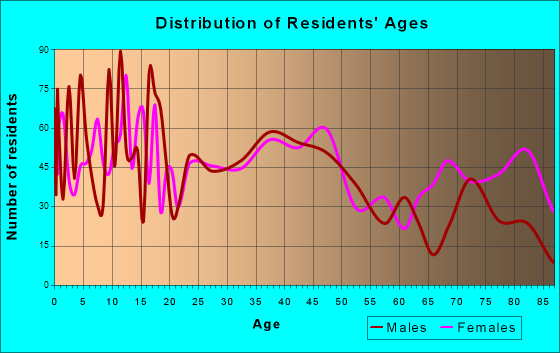
Total population: 8,201 (Urban population: 7,738 (all inside urban clusters), Rural population: 20 (all nonfarm))
Houses: 4,299 (4,039 occupied: 2,614 owner occupied, 1,455 renter occupied)
| % of renters here: | 36% |
| State: | 28% |
Housing density: 686 houses/condos per square mile
Median price asked for vacant for-sale houses and condos in 2022: $308,925.
Median contract rent in 2022: $637 (lower quartile is $462, upper quartile is $875)
Median rent asked for vacant for-rent units in 2022: $628
Median gross rent in Little Falls, MN in 2022: $789
Housing units in Little Falls with a mortgage: 1,594 (177 second mortgage, 0 home equity loan, 172 both second mortgage and home equity loan)
Houses without a mortgage: 51
Median household income for houses/condos with a mortgage: $67,329
Median household income for apartments without a mortgage: $35,026
Median monthly housing costs: $849
Compare current foreclosures in Little Falls, MN:
| Photo | Address | Area | Beds / Baths | Price | Details |
|---|---|---|---|---|---|

|
#1
3rd St SW
Little Falls, MN 56345
|
2,500 sq. feet
|
3 baths 3 beds |
show details | |

|
#2
3rd St NE
Little Falls, MN 56345
|
1,032 sq. feet
|
1 baths 4 beds |
show details | |

|
#3
5th St SE
Little Falls, MN 56345
|
2,732 sq. feet
|
2 baths 3 beds |
show details | |

|
#4
7th St NE
Little Falls, MN 56345
|
1,604 sq. feet
|
2 baths 3 beds |
show details | |

|
#5
3rd St SW
Little Falls, MN 56345
|
916 sq. feet
|
1 baths 3 beds |
show details | |

|
#6
4th St SW
Little Falls, MN 56345
|
1,960 sq. feet
|
1 baths 2 beds |
show details | |

|
#7
4th St SW
Little Falls, MN 56345
|
1,683 sq. feet
|
2 baths 3 beds |
show details | |

|
#8
140th Ave
Little Falls, MN 56345
|
2,284 sq. feet
|
2 baths 4 beds |
show details | |

|
#9
6th St NW
Little Falls, MN 56345
|
741 sq. feet
|
1 baths 3 beds |
show details | |

|
#10
2nd St NE
Little Falls, MN 56345
|
1,038 sq. feet
|
1 baths 4 beds |
show details |
| Photo | Address | Area | Beds / Baths | Price | Details |
|---|---|---|---|---|---|

|
#11
6th Ave SW
Little Falls, MN 56345
|
4,340 sq. feet
|
3 baths 5 beds |
show details | |

|
#12
8th St SW
Little Falls, MN 56345
|
1,248 sq. feet
|
2 baths 2 beds |
show details | |

|
#13
Ginger Rd
Little Falls, MN 56345
|
1,656 sq. feet
|
3 baths 4 beds |
show details | |

|
#14
4th St SE
Little Falls, MN 56345
|
2,088 sq. feet
|
1 baths 3 beds |
show details | |

|
#15
233rd St
Little Falls, MN 56345
|
1,752 sq. feet
|
2 baths 3 beds |
show details | |

|
#16
N Highway 238
Little Falls, MN 56345
|
1,094 sq. feet
|
1 baths 3 beds |
show details | |

|
#17
10th Ave SW
Little Falls, MN 56345
|
3,036 sq. feet
|
2 baths 4 beds |
show details | |

|
#18
4th St NW
Little Falls, MN 56345
|
2,572 sq. feet
|
1 baths 3 beds |
show details | |

|
#19
165th St
Little Falls, MN 56345
|
3,518 sq. feet
|
3 baths 3 beds |
show details | |

|
#20
11th St SW
Little Falls, MN 56345
|
4,081 sq. feet
|
2 baths 5 beds |
show details |
| Photo | Address | Area | Beds / Baths | Price | Details |
|---|---|---|---|---|---|

|
#21
90th St
Little Falls, MN 56345
|
4,864 sq. feet
|
3 baths 3 beds |
show details | |

|
#22
Edgewood Rd
Little Falls, MN 56345
|
2,356 sq. feet
|
2 baths 3 beds |
show details | |

|
#23
7th St SW
Little Falls, MN 56345
|
1,174 sq. feet
|
2 baths 4 beds |
show details | |

|
#24
Karen Ln
Little Falls, MN 56345
|
- sq. feet
|
- baths - beds |
show details | |

|
#25
4th St SW
Little Falls, MN 56345
|
- sq. feet
|
- baths - beds |
show details | |

|
#26
5th Ave Se, Apt 4
Little Falls, MN 56345
|
- sq. feet
|
- baths - beds |
show details | |

|
#27
Lindbergh Dr S
Little Falls, MN 56345
|
- sq. feet
|
- baths - beds |
show details | |

|
#28
Lindbergh Dr NW Trlr C4
Little Falls, MN 56345
|
- sq. feet
|
- baths - beds |
show details | |

|
#29
Anne Marie Cir Apt 203
Little Falls, MN 56345
|
- sq. feet
|
- baths - beds |
show details | |

|
#30
8th St NW
Little Falls, MN 56345
|
- sq. feet
|
- baths - beds |
show details |
| Photo | Address | Area | Beds / Baths | Price | Details |
|---|---|---|---|---|---|

|
#31
9th St NE
Little Falls, MN 56345
|
- sq. feet
|
- baths - beds |
show details | |

|
Check over 1 million property listings on Foreclosure.com!
|
browse all offers | |||


 | Why did you move away from the Twin Cities? (82 replies) |
| Crime in Mn (117 replies) |
| St. Cloud area, looking to rent, maybe rent-to-buy (10 replies) |
| Little Falls / St Cloud info (9 replies) |
| Twin Cities place 5 suburbs in top 22 of 2012 Best Cities List (76 replies) |
| Outstate? (122 replies) |
Median year apartment built: 1973
Household type by relationship:
Households: 9,118- Male householders: 1,863 (505 living alone), Female householders: 2,106 (988 living alone)
1,495 spouses (1,476 opposite-sex spouses), 430 unmarried partners, (430 opposite-sex unmarried partners), 2,208 children (2,038 natural, 22 adopted, 147 stepchildren), 245 grandchildren, 35 brothers or sisters, 6 parents, 14 foster children, 43 other relatives, 234 non-relatives
- In group quarters: 435
Size of family households: 1,264 2-persons, 439 3-persons, 315 4-persons, 190 5-persons, 35 6-persons, 35 7-or-more-persons.
Size of nonfamily households: 1,555 1-person, 220 2-persons, 28 3-persons.
794 married couples with children.
814 single-parent households (336 men, 478 women).
97.4% of residents of Little Falls speak English at home.
1.6% of residents speak Spanish at home (66% speak English very well, 34% speak English well).
0.8% of residents speak other Indo-European language at home (100% speak English very well).
0.5% of residents speak Asian or Pacific Island language at home (100% speak English very well).
Foreign born population: 81 (0.9%)
(27.2% of them are naturalized citizens)
| Here: | 7.0 |
| State: | 7.1 |
| Here: | 4.1 |
| State: | 3.8 |
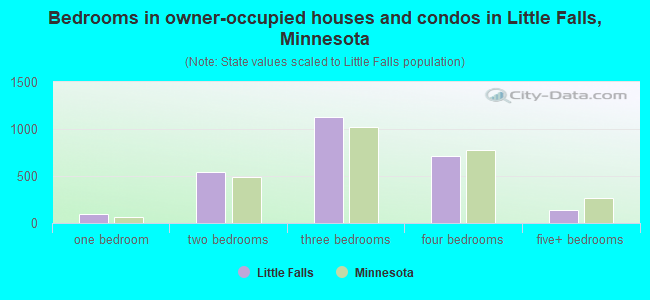
- Bedrooms in owner-occupied houses and condos in Little Falls, Minnesota
- 0no bedroom
- 981 bedroom
- 5392 bedrooms
- 1,1273 bedrooms
- 7144 bedrooms
- 1365+ bedrooms
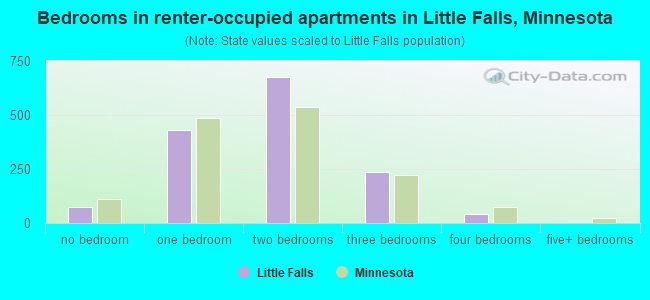
- Bedrooms in renter-occupied apartments in Little Falls, Minnesota
- 72no bedroom
- 4321 bedroom
- 6772 bedrooms
- 2343 bedrooms
- 404 bedrooms
- 05+ bedrooms
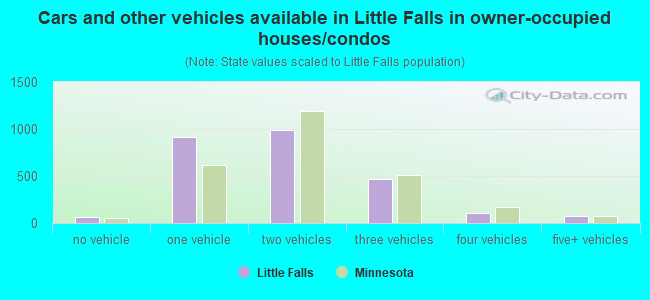
- Cars and other vehicles available in Little Falls in owner-occupied houses/condos
- 66no vehicle
- 9131 vehicle
- 9872 vehicles
- 4703 vehicles
- 1024 vehicles
- 765+ vehicles
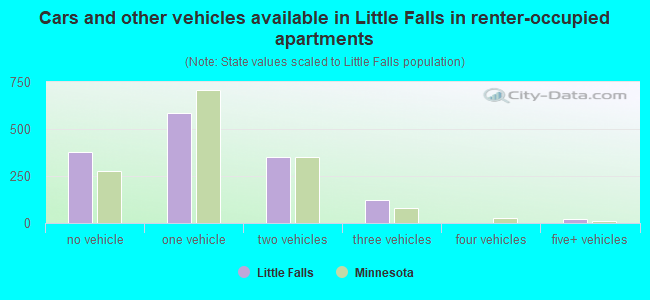
- Cars and other vehicles available in Little Falls in renter-occupied apartments
- 376no vehicle
- 5861 vehicle
- 3522 vehicles
- 1223 vehicles
- 04 vehicles
- 205+ vehicles
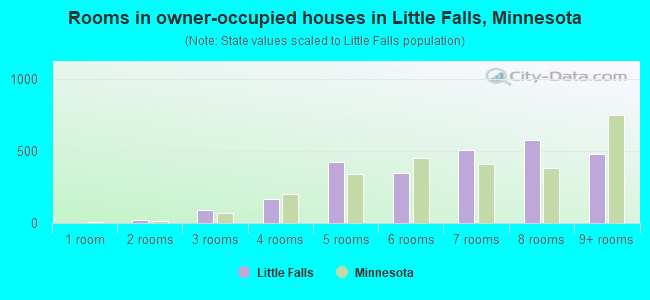
- Rooms in owner-occupied houses in Little Falls, Minnesota
- 01 room
- 212 rooms
- 923 rooms
- 1674 rooms
- 4255 rooms
- 3486 rooms
- 5047 rooms
- 5788 rooms
- 4809+ rooms
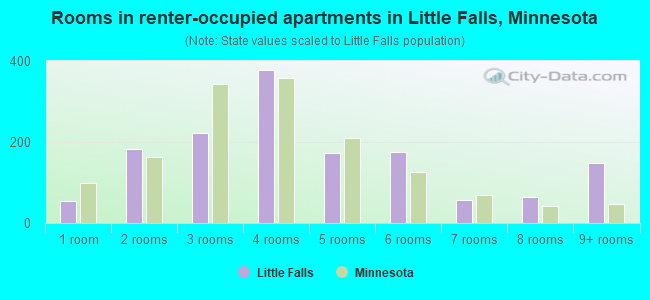
- Rooms in renter-occupied apartments in Little Falls, Minnesota
- 551 room
- 1832 rooms
- 2233 rooms
- 3774 rooms
- 1735 rooms
- 1756 rooms
- 577 rooms
- 658 rooms
- 1489+ rooms
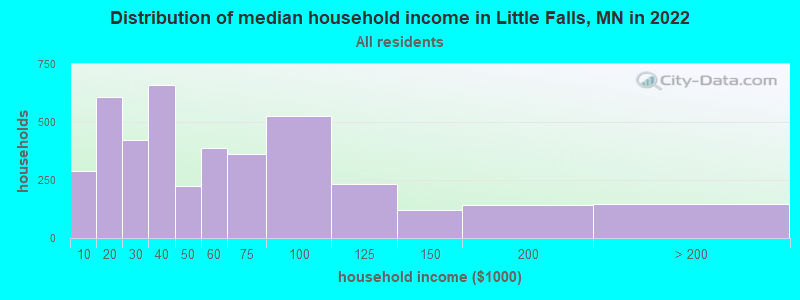
Little Falls, MN household income distribution

- 290Less than $10,000
- 608$10,000 to $19,999
- 422$20,000 to $29,999
- 661$30,000 to $39,999
- 223$40,000 to $49,999
- 386$50,000 to $59,999
- 360$60,000 to $74,999
- 525$75,000 to $99,999
- 233$100,000 to $124,999
- 122$125,000 to $149,999
- 144$150,000 to $199,999
- 147$200,000 or more
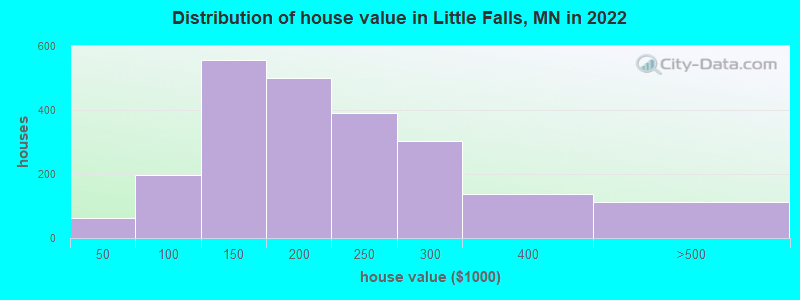
Home value of owner - occupied houses in 2022 in Little Falls, MN
-
- 30Less than $10,000
- 13$10,000 to $14,999
- 18$20,000 to $24,999
- 10$60,000 to $69,999
- 103$80,000 to $89,999
- 81$90,000 to $99,999
- 302$100,000 to $124,999
- 254$125,000 to $149,999
- 328$150,000 to $174,999
- 172$175,000 to $199,999
- 389$200,000 to $249,999
- 304$250,000 to $299,999
- 138$300,000 to $399,999
- 104$400,000 to $499,999
- 6$500,000 to $749,999
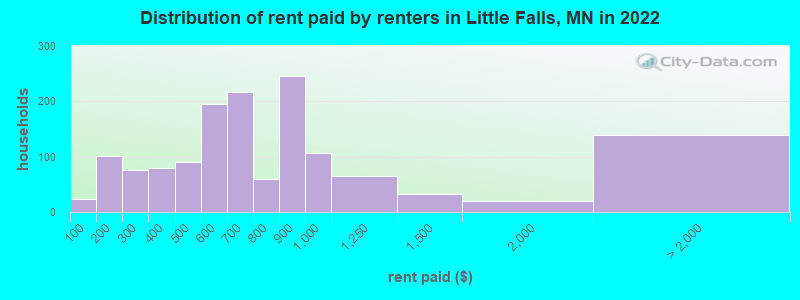
Rent paid by renters in 2022 in Little Falls, MN
-
- 23Less than $100
- 12$100 to $149
- 88$150 to $199
- 8$200 to $249
- 68$250 to $299
- 9$300 to $349
- 70$350 to $399
- 23$400 to $449
- 67$450 to $499
- 71$500 to $549
- 123$550 to $599
- 140$600 to $649
- 76$650 to $699
- 59$700 to $749
- 245$800 to $899
- 107$900 to $999
- 64$1,000 to $1,249
- 32$1,250 to $1,499
- 20$1,500 to $1,999
- 38$3,500 or more
- 101No cash rent
Percentage of workers working in this county: 75.5%
Number of people working at home: 199 (5.3% of all workers)
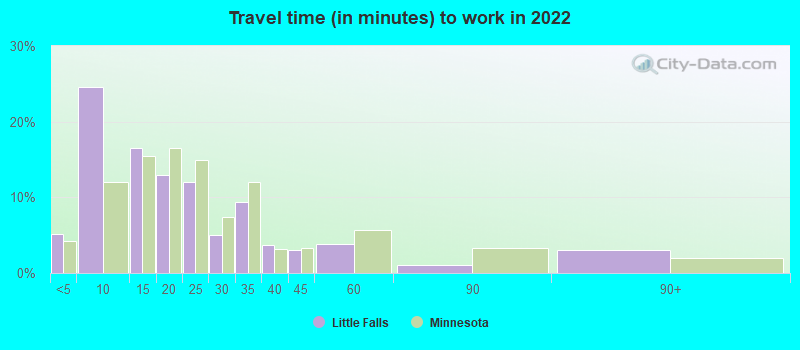
Travel time to work (commute)
- Less than 5 minutes: 305
- 5 to 9 minutes: 1,157
- 10 to 14 minutes: 392
- 15 to 19 minutes: 188
- 20 to 24 minutes: 275
- 25 to 29 minutes: 66
- 30 to 34 minutes: 310
- 35 to 39 minutes: 125
- 40 to 44 minutes: 214
- 45 to 59 minutes: 172
- 60 to 89 minutes: 131
- 90 or more minutes: 68

Means of transportation to work:
- Drove a car alone: 4,630 (77.2%)
- Carpooled: 691 (11.5%)
- Bus: 42 (0.7%)
- Taxi: 43 (0.7%)
- Bicycle: 46 (0.8%)
- Walked: 166 (2.8%)
- Worked at home: 199 (3.3%)
- Unemployment by race in 2022
- Unemployment rate for White non-Hispanic residents
- 7.2%Males
- 3.0%Females
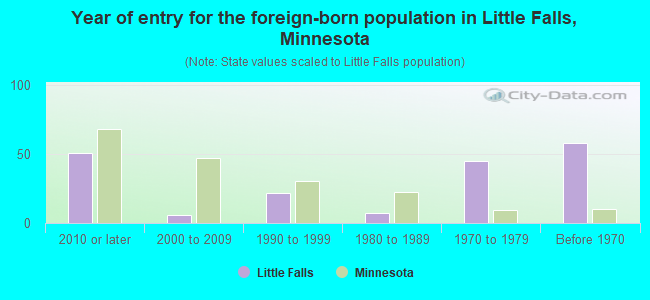
- Year of entry for the foreign-born population in Little Falls, Minnesota
- 512010 or later
- 62000 to 2009
- 211990 to 1999
- 71980 to 1989
- 451970 to 1979
- 58Before 1970
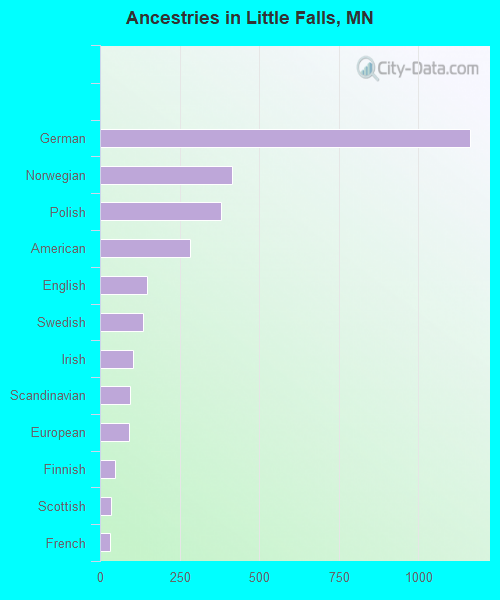
First ancestries reported:
- German: 1,165 (35.8%)
- Norwegian: 416 (12.8%)
- Polish: 379 (11.6%)
- American: 284 (8.7%)
- English: 149 (4.6%)
- Swedish: 135 (4.1%)
- Irish: 105 (3.2%)
- Scandinavian: 93 (2.9%)
- European: 92 (2.8%)
- Finnish: 46 (1.4%)
- Scottish: 36 (1.1%)
- French: 30 (0.9%)
- African: 7 (0.2%)
- Swiss: 4 (0.1%)
- Yugoslavian: 3 (0.09%)
- Icelander: 2 (0.06%)
Most common places of birth for foreign-born residents (%):
| Little Falls: | 53.1% (43) |
| Minnesota: | 2.0% (9,850) |
| Little Falls: | 19.8% (16) |
| Minnesota: | 12.1% (58,312) |
| Little Falls: | 17.3% (14) |
| Minnesota: | 1.4% (6,670) |
| Little Falls: | 7.4% (6) |
| Minnesota: | 5.1% (24,591) |
| Little Falls: | 3.7% (3) |
| Minnesota: | 0.1% (397) |
Place of birth for U.S.-born residents:
- This state: 7,668
- Other state: 1,226
- Northeast: 91
- Midwest: 584
- South: 267
- West: 288
88.4% of Little Falls residents lived in the same house 1 years ago.
Out of people who lived in different houses, 26.0% lived in this county.
Out of people who lived in different counties, 91.1% lived in Minnesota.
| Little Falls: | 88.4% |
| State average: | 87.4% |
Education attainment for males 25 years and older:
- No schooling: 54
- Nursery to 4th grade: 0
- 5th and 6th grade: 0
- 7th and 8th grade: 23
- 9th grade: 10
- 10th grade: 32
- 11th grade: 0
- 12th grade, no diploma: 44
- High school graduate (or equivalency): 1,227
- Less than 1 year of college: 281
- Some college more than 1 year, no degree: 426
- Associate degree: 277
- Bachelor's degree: 312
- Master's degree: 70
- Professional school degree: 128
- Doctorate degree: 0

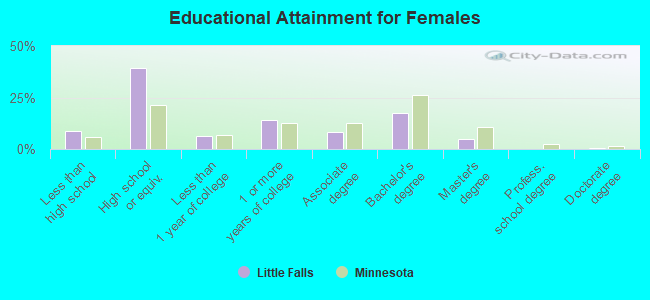
Education attainment for females 25 years and older:
- No schooling: 20
- Nursery to 4th grade: 0
- 5th and 6th grade: 0
- 7th and 8th grade: 94
- 9th grade: 5
- 10th grade: 92
- 11th grade: 77
- 12th grade, no diploma: 31
- High school graduate (or equivalency): 1,395
- Less than 1 year of college: 230
- Some college more than 1 year, no degree: 507
- Associate degree: 289
- Bachelor's degree: 630
- Master's degree: 175
- Professional school degree: 5
- Doctorate degree: 16
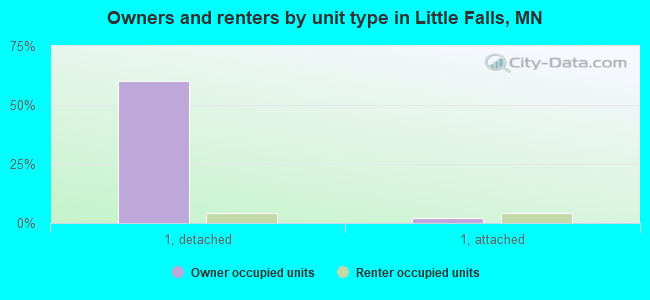
Housing units in structures:
- One, detached: 3,094
- One, attached: 265
- Two: 171
- 3 or 4: 81
- 5 to 9: 124
- 10 to 19: 43
- 20 to 49: 387
- 50 or more: 76
- Mobile homes: 54
Median worth of mobile homes: $12,995
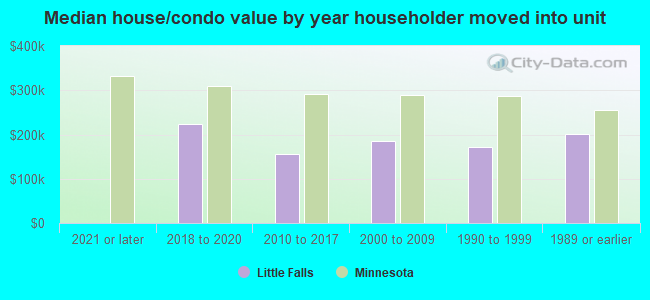
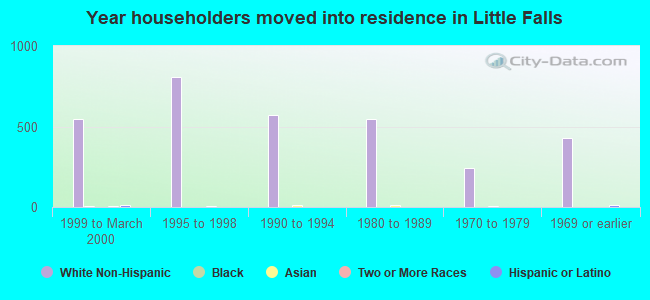
House/condo owner moved in on average 11 years ago
Renter moved in on average 5 years ago
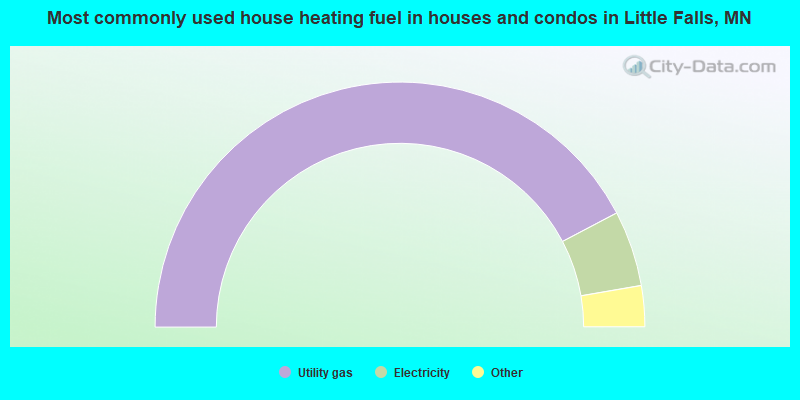
- 84.6%Utility gas
- 10.0%Electricity
- 1.9%Bottled, tank, or LP gas
- 1.3%Other fuel
- 0.9%Wood
- 0.7%Fuel oil, kerosene, etc.
- 0.6%No fuel used
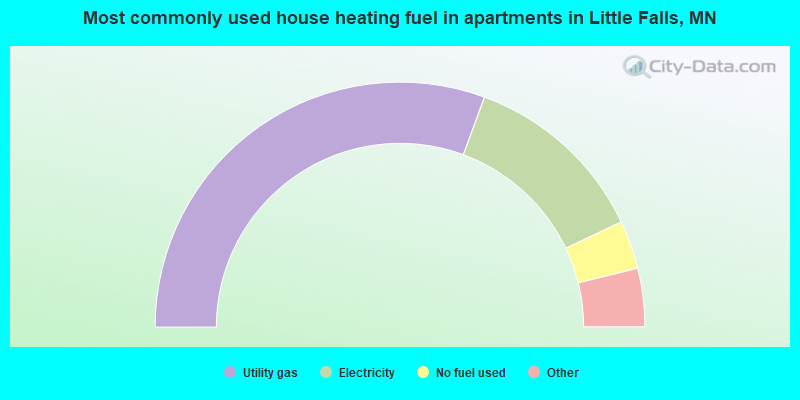
- 61.3%Utility gas
- 24.7%Electricity
- 6.4%No fuel used
- 3.0%Bottled, tank, or LP gas
- 2.5%Wood
- 1.1%Fuel oil, kerosene, etc.
- 1.1%Other fuel
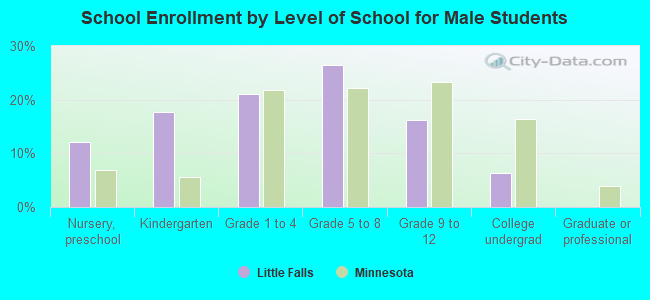
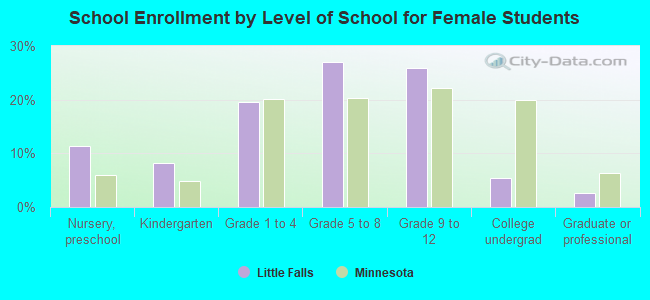
Private vs. public school enrollment:
| Here: | 13.8% |
| Minnesota: | 12.9% |
| Here: | 4.1% |
| Minnesota: | 8.6% |
| Here: | 48.5% |
| Minnesota: | 26.2% |