Little Elm, TX (Texas) Houses and Residents
| Little Elm: | $409,764 |
| Texas: | $275,400 |
Mean price in 2022:
Detached houses: $416,522
Here: $416,522 State: $369,058 Townhouses or other attached units: $477,224
Here: $477,224 State: $327,631 Mobile homes: $60,800
Here: $60,800 State: $124,413
Total population: 35,414 (Urban population: 3,350 (all inside urban clusters), Rural population: 335 (all nonfarm))
Houses: 18,773 (17,954 occupied: 12,281 owner occupied, 5,835 renter occupied)
| % of renters here: | 32% |
| State: | 38% |
Housing density: 3,869 houses/condos per square mile
Median price asked for vacant for-sale houses and condos in 2022: $106,825.
Median contract rent in 2022: $1,748 (lower quartile is $1,377, upper quartile is over $2,000)
Median rent asked for vacant for-rent units in 2022: $2,050
Median gross rent in Little Elm, TX in 2022: over $2,000
Housing units in Little Elm with a mortgage: 9,729 (262 second mortgage, 19 home equity loan, 210 both second mortgage and home equity loan)
Houses without a mortgage: 0
Median household income for houses/condos with a mortgage: $129,118
Median household income for apartments without a mortgage: $103,327
Median monthly housing costs: $2,157
Compare current foreclosures in Little Elm, TX:
| Photo | Address | Area | Beds / Baths | Price | Details |
|---|---|---|---|---|---|

|
#1
Ringtail Dr
Little Elm, TX 75068
|
2,841 sq. feet
|
3 baths 4 beds |
show details | |

|
#2
Sueca Dr
Little Elm, TX 75068
|
2,035 sq. feet
|
2 baths 4 beds |
show details | |

|
#3
Lamp Post Dr
Little Elm, TX 75068
|
1,480 sq. feet
|
2 baths 3 beds |
show details | |

|
#4
Zebra Finch Dr
Little Elm, TX 75068
|
- sq. feet
|
3 baths 5 beds |
show details | |

|
#5
Waterfall Ln
Little Elm, TX 75068
|
- sq. feet
|
2 baths 4 beds |
show details | |

|
#6
Salt Maker Way
Little Elm, TX 75068
|
1,647 sq. feet
|
2 baths 3 beds |
show details | |

|
#7
Jasmine Valley Dr
Little Elm, TX 75068
|
2,170 sq. feet
|
2 baths 4 beds |
show details | |

|
#8
Replay Ln
Little Elm, TX 75068
|
2,000 sq. feet
|
2 baths 4 beds |
show details | |

|
#9
Sumac Dr
Little Elm, TX 75068
|
2,292 sq. feet
|
2 baths 4 beds |
show details | |

|
#10
Willowlake Dr
Little Elm, TX 75068
|
2,339 sq. feet
|
2 baths 4 beds |
show details |
| Photo | Address | Area | Beds / Baths | Price | Details |
|---|---|---|---|---|---|

|
#11
Eagle Mountain Dr
Little Elm, TX 75068
|
1,761 sq. feet
|
3 baths 4 beds |
show details | |

|
#12
Deerwood Dr
Little Elm, TX 75068
|
2,204 sq. feet
|
2 baths 4 beds |
show details | |

|
#13
Apple Dr
Little Elm, TX 75068
|
3,063 sq. feet
|
2 baths 5 beds |
show details | |

|
#14
Sunbeam Dr
Little Elm, TX 75068
|
2,930 sq. feet
|
2 baths 3 beds |
show details | |

|
#15
Spillway Dr
Little Elm, TX 75068
|
1,880 sq. feet
|
2 baths 4 beds |
show details | |

|
#16
Wheatear Dr
Little Elm, TX 75068
|
2,980 sq. feet
|
2 baths 4 beds |
show details | |

|
#17
Preston On The Lake Blvd
Little Elm, TX 75068
|
1,840 sq. feet
|
2 baths 3 beds |
show details | |

|
#18
Quail Creek Dr
Little Elm, TX 75068
|
2,654 sq. feet
|
2 baths 4 beds |
show details | |

|
#19
Bigleaf Dr
Little Elm, TX 75068
|
2,033 sq. feet
|
2 baths 3 beds |
show details | |

|
#20
Yuma Dr
Little Elm, TX 75068
|
2,523 sq. feet
|
2 baths 4 beds |
show details |
| Photo | Address | Area | Beds / Baths | Price | Details |
|---|---|---|---|---|---|

|
#21
Morning Star Dr
Little Elm, TX 75068
|
2,846 sq. feet
|
2 baths 4 beds |
show details | |

|
#22
Kittyhawk Dr
Little Elm, TX 75068
|
1,988 sq. feet
|
2 baths 3 beds |
show details | |

|
#23
Rockport Ln
Little Elm, TX 75068
|
1,868 sq. feet
|
2 baths 3 beds |
show details | |

|
#24
Morning Song Dr
Little Elm, TX 75068
|
1,615 sq. feet
|
2 baths 3 beds |
show details | |

|
#25
Hillside Dr
Little Elm, TX 75068
|
1,700 sq. feet
|
2 baths 3 beds |
show details | |

|
#26
Parakeet Dr
Little Elm, TX 75068
|
1,840 sq. feet
|
2 baths 3 beds |
show details | |

|
#27
Whispering Trl
Little Elm, TX 75068
|
3,508 sq. feet
|
3 baths 5 beds |
show details | |

|
#28
Sage Meadow Trl
Little Elm, TX 75068
|
3,368 sq. feet
|
3 baths 4 beds |
show details | |

|
#29
Basswood Dr
Little Elm, TX 75068
|
1,563 sq. feet
|
2 baths 3 beds |
show details | |

|
#30
Eaglemont Dr
Little Elm, TX 75068
|
1,818 sq. feet
|
2 baths 3 beds |
show details |
| Photo | Address | Area | Beds / Baths | Price | Details |
|---|---|---|---|---|---|

|
#31
Sunlight Dr
Little Elm, TX 75068
|
1,824 sq. feet
|
2 baths 3 beds |
show details | |

|
#32
Thornhill Ln
Little Elm, TX 75068
|
2,359 sq. feet
|
2 baths 4 beds |
show details | |

|
#33
Tisbury Way
Little Elm, TX 75068
|
2,698 sq. feet
|
3 baths 4 beds |
show details | |

|
#34
Scott Creek Dr
Little Elm, TX 75068
|
3,184 sq. feet
|
2 baths 5 beds |
show details | |

|
#35
Cherry Dr
Little Elm, TX 75068
|
1,647 sq. feet
|
2 baths 3 beds |
show details | |

|
#36
Replay Ln
Little Elm, TX 75068
|
1,704 sq. feet
|
2 baths 3 beds |
show details | |

|
#37
Woodlake Pkwy
Little Elm, TX 75068
|
1,507 sq. feet
|
2 baths 3 beds |
show details | |

|
#38
Plum Ct
Little Elm, TX 75068
|
2,609 sq. feet
|
2 baths 4 beds |
show details | |

|
#39
Lakeshore Dr
Little Elm, TX 75068
|
1,641 sq. feet
|
2 baths 3 beds |
show details | |

|
#40
Elm Valley Dr
Little Elm, TX 75068
|
2,493 sq. feet
|
2 baths 3 beds |
show details |
| Photo | Address | Area | Beds / Baths | Price | Details |
|---|---|---|---|---|---|

|
#41
Grand Fir Dr
Little Elm, TX 75068
|
2,048 sq. feet
|
2 baths 4 beds |
show details | |

|
#42
Marble Canyon Dr
Little Elm, TX 75068
|
2,010 sq. feet
|
2 baths 3 beds |
show details | |

|
#43
Kittyhawk Dr
Little Elm, TX 75068
|
2,992 sq. feet
|
2 baths 4 beds |
show details | |

|
#44
Silverwood Ln
Little Elm, TX 75068
|
3,440 sq. feet
|
3 baths 4 beds |
show details | |

|
#45
Timberhollow Dr
Little Elm, TX 75068
|
2,464 sq. feet
|
2 baths 4 beds |
show details | |

|
#46
Highland Cir
Little Elm, TX 75068
|
2,996 sq. feet
|
2 baths 4 beds |
show details | |

|
#47
Lake Grove Dr
Little Elm, TX 75068
|
3,281 sq. feet
|
2 baths 3 beds |
show details | |

|
#48
Spinnaker Run Pt
Little Elm, TX 75068
|
3,600 sq. feet
|
3 baths 4 beds |
show details | |

|
#49
Crystal Lake Dr
Little Elm, TX 75068
|
1,879 sq. feet
|
2 baths 3 beds |
show details | |

|
Check over 1 million property listings on Foreclosure.com!
|
browse all offers | |||


 | Is high housing price and inflation a big deterrent for relocation now? (153 replies) |
| Help with Info on Frisco Hills, Little Elm & Grand Homes (35 replies) |
| Report: DFW homes now less affordable than Chicago (11 replies) |
| Little Elm Vs Melissa - Real Estate Query (2 replies) |
| Inflated home prices (280 replies) |
| House Prices Are Going Up Because Everyone Is Moving Here (149 replies) |
Median year apartment built: 2017
Household type by relationship:
Households: 51,531- Male householders: 8,594 (1,681 living alone), Female householders: 9,299 (1,947 living alone)
10,214 spouses (10,107 opposite-sex spouses), 912 unmarried partners, (880 opposite-sex unmarried partners), 17,388 children (16,627 natural, 520 adopted, 240 stepchildren), 956 grandchildren, 611 brothers or sisters, 1,078 parents, 0 foster children, 1,169 other relatives, 1,306 non-relatives
Size of family households: 4,618 2-persons, 3,816 3-persons, 2,931 4-persons, 1,361 5-persons, 679 6-persons, 271 7-or-more-persons.
Size of nonfamily households: 3,693 1-person, 654 2-persons, 37 3-persons, 49 7-or-more-persons.
9,298 married couples with children.
3,684 single-parent households (1,333 men, 2,351 women).
70.4% of residents of Little Elm speak English at home.
15.1% of residents speak Spanish at home (68% speak English very well, 18% speak English well, 10% speak English not well, 4% don't speak English at all).
3.3% of residents speak other Indo-European language at home (77% speak English very well, 13% speak English well, 7% speak English not well, 3% don't speak English at all).
7.0% of residents speak Asian or Pacific Island language at home (59% speak English very well, 33% speak English well, 9% speak English not well).
3.8% of residents speak other language at home (85% speak English very well, 12% speak English well, 3% speak English not well).
Foreign born population: 9,931 (19.3%)
(58.1% of them are naturalized citizens)
| Here: | 7.2 |
| State: | 6.3 |
| Here: | 4.1 |
| State: | 4.0 |
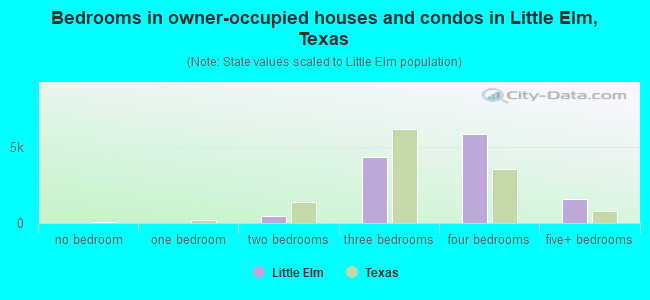
- Bedrooms in owner-occupied houses and condos in Little Elm, Texas
- 0no bedroom
- 01 bedroom
- 4672 bedrooms
- 4,3403 bedrooms
- 5,8854 bedrooms
- 1,5905+ bedrooms
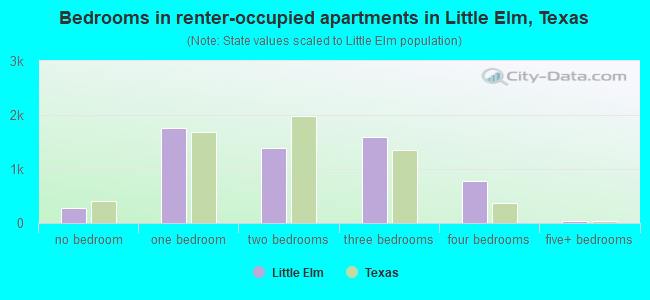
- Bedrooms in renter-occupied apartments in Little Elm, Texas
- 275no bedroom
- 1,7601 bedroom
- 1,3852 bedrooms
- 1,5973 bedrooms
- 7784 bedrooms
- 415+ bedrooms
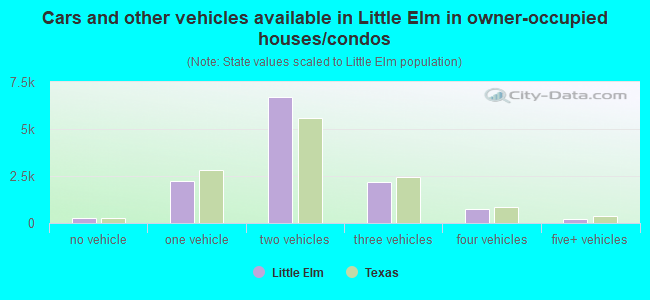
- Cars and other vehicles available in Little Elm in owner-occupied houses/condos
- 243no vehicle
- 2,2191 vehicle
- 6,6802 vehicles
- 2,1653 vehicles
- 7514 vehicles
- 2235+ vehicles
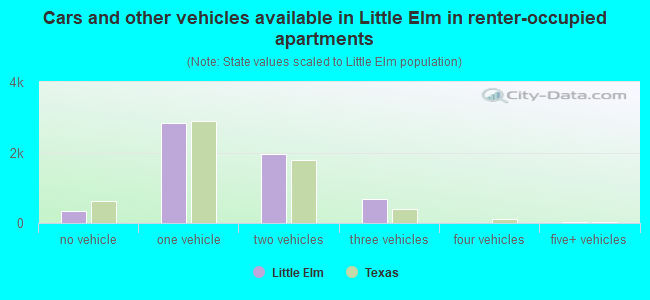
- Cars and other vehicles available in Little Elm in renter-occupied apartments
- 330no vehicle
- 2,8381 vehicle
- 1,9712 vehicles
- 6723 vehicles
- 04 vehicles
- 265+ vehicles
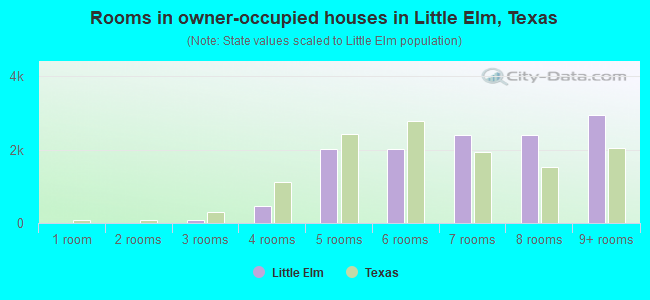
- Rooms in owner-occupied houses in Little Elm, Texas
- 01 room
- 02 rooms
- 793 rooms
- 4604 rooms
- 2,0165 rooms
- 2,0026 rooms
- 2,3977 rooms
- 2,3888 rooms
- 2,9419+ rooms
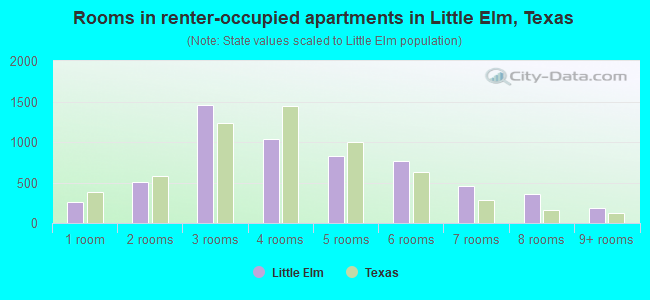
- Rooms in renter-occupied apartments in Little Elm, Texas
- 2621 room
- 5052 rooms
- 1,4583 rooms
- 1,0344 rooms
- 8215 rooms
- 7616 rooms
- 4607 rooms
- 3558 rooms
- 1819+ rooms
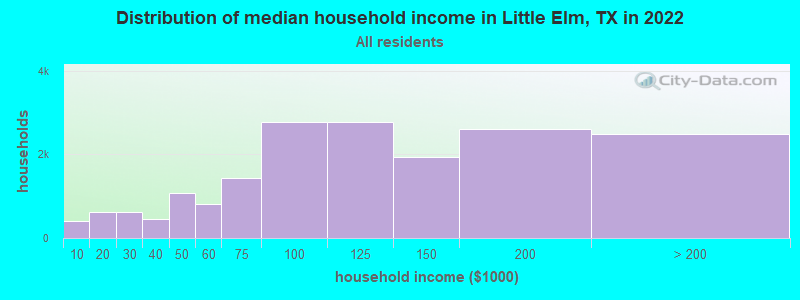
Little Elm, TX household income distribution

- 409Less than $10,000
- 613$10,000 to $19,999
- 621$20,000 to $29,999
- 452$30,000 to $39,999
- 1,082$40,000 to $49,999
- 824$50,000 to $59,999
- 1,441$60,000 to $74,999
- 2,777$75,000 to $99,999
- 2,766$100,000 to $124,999
- 1,932$125,000 to $149,999
- 2,603$150,000 to $199,999
- 2,501$200,000 or more
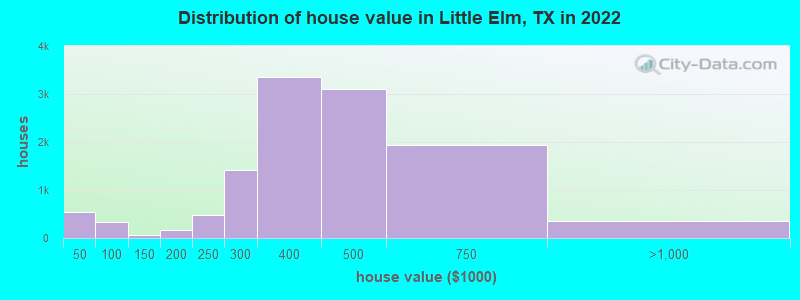
Home value of owner - occupied houses in 2022 in Little Elm, TX
-
- 156Less than $10,000
- 21$10,000 to $14,999
- 39$20,000 to $24,999
- 72$25,000 to $29,999
- 64$30,000 to $34,999
- 166$35,000 to $39,999
- 20$40,000 to $49,999
- 10$50,000 to $59,999
- 162$60,000 to $69,999
- 145$70,000 to $79,999
- 14$100,000 to $124,999
- 40$125,000 to $149,999
- 30$150,000 to $174,999
- 126$175,000 to $199,999
- 488$200,000 to $249,999
- 1,408$250,000 to $299,999
- 3,360$300,000 to $399,999
- 3,102$400,000 to $499,999
- 1,928$500,000 to $749,999
- 296$750,000 to $999,999
- 57$1,000,000 to $1,499,999
Rent paid by renters in 2022 in Little Elm, TX
-
- 15$150 to $199
- 16$200 to $249
- 51$350 to $399
- 22$450 to $499
- 15$750 to $799
- 38$800 to $899
- 40$900 to $999
- 853$1,000 to $1,249
- 1,017$1,250 to $1,499
- 2,610$1,500 to $1,999
- 1,371$2,000 to $2,499
- 230$2,500 to $2,999
- 146No cash rent
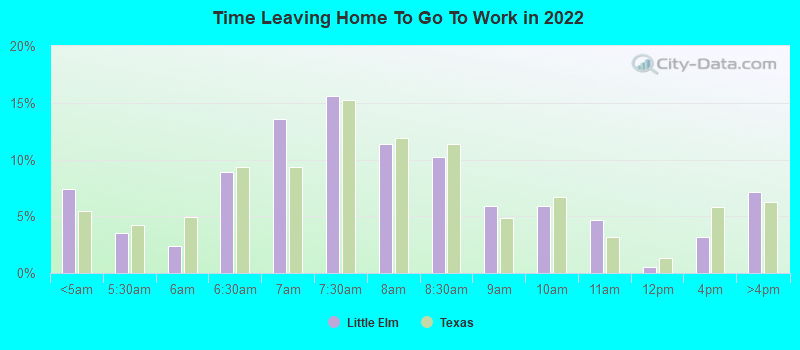
Percentage of workers working in this county: 57.4%
Number of people working at home: 7,246 (26.7% of all workers)
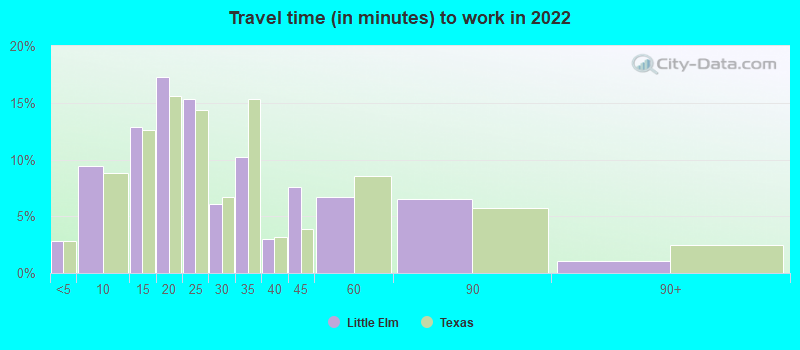
Travel time to work (commute)
- Less than 5 minutes: 239
- 5 to 9 minutes: 1,198
- 10 to 14 minutes: 794
- 15 to 19 minutes: 2,315
- 20 to 24 minutes: 2,593
- 25 to 29 minutes: 1,212
- 30 to 34 minutes: 3,229
- 35 to 39 minutes: 608
- 40 to 44 minutes: 809
- 45 to 59 minutes: 2,920
- 60 to 89 minutes: 2,729
- 90 or more minutes: 1,383
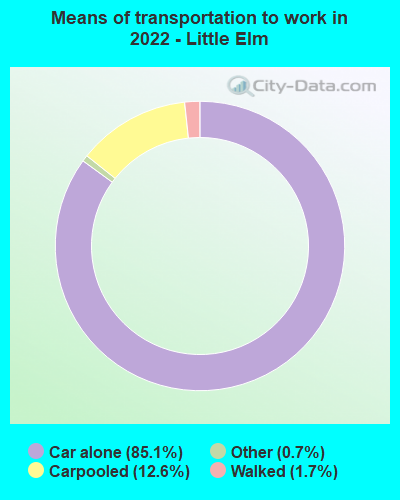
Means of transportation to work:
- Drove a car alone: 5,332 (42.1%)
- Carpooled: 671 (5.3%)
- Taxi: 45 (0.4%)
- Walked: 92 (0.7%)
- Worked at home: 7,246 (57.2%)
- Unemployment by race in 2022
- Unemployment rate for White non-Hispanic residents
- 7.2%Males
- 2.2%Females
- Unemployment rate for Black residents
- 5.5%Males
- 7.3%Females
- Unemployment rate for Asian residents
- 4.6%Males
- 23.4%Females
- Unemployment rate for other race residents
- 1.3%Females
- Unemployment rate for two or more race residents
- 2.6%Males
- 18.5%Females
- Unemployment rate for Hispanic or Latino residents
- 0.9%Males
- 5.4%Females
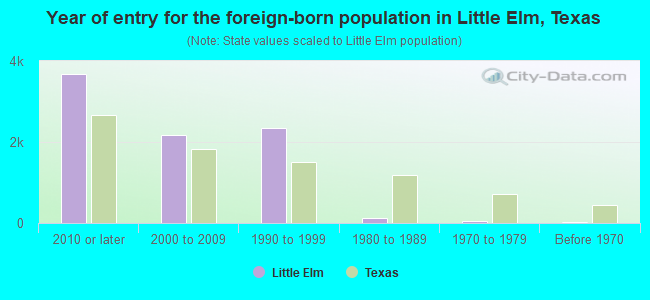
- Year of entry for the foreign-born population in Little Elm, Texas
- 3,6842010 or later
- 2,1712000 to 2009
- 2,3341990 to 1999
- 1131980 to 1989
- 431970 to 1979
- 26Before 1970
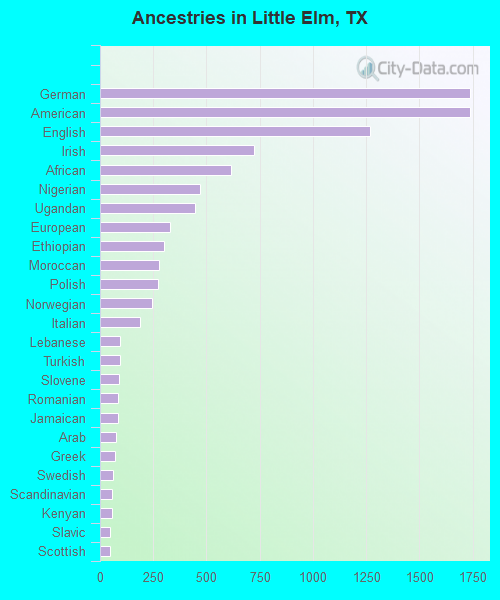
First ancestries reported:
- German: 1,740 (7.4%)
- American: 1,737 (7.4%)
- English: 1,268 (5.4%)
- Irish: 721 (3.1%)
- African: 614 (2.6%)
- Nigerian: 468 (2.0%)
- Ugandan: 444 (1.9%)
- European: 331 (1.4%)
- Ethiopian: 301 (1.3%)
- Moroccan: 276 (1.2%)
- Polish: 272 (1.2%)
- Norwegian: 244 (1.0%)
- Italian: 188 (0.8%)
- Lebanese: 96 (0.4%)
- Turkish: 93 (0.4%)
- Slovene: 88 (0.4%)
- Romanian: 83 (0.4%)
- Jamaican: 83 (0.4%)
- Arab: 77 (0.3%)
- Greek: 70 (0.3%)
- Swedish: 61 (0.3%)
- Scandinavian: 58 (0.2%)
- Kenyan: 58 (0.2%)
- Slavic: 47 (0.2%)
- Scottish: 46 (0.2%)
- Portuguese: 41 (0.2%)
- Russian: 32 (0.1%)
- British: 31 (0.1%)
- Iranian: 29 (0.1%)
- French: 18 (0.08%)
- Bulgarian: 16 (0.07%)
- Brazilian: 15 (0.06%)
- Northern European: 14 (0.06%)
- Hungarian: 12 (0.05%)
- Scotch-Irish: 12 (0.05%)
- Swiss: 11 (0.05%)
- Yugoslavian: 10 (0.04%)
- Dutch: 9 (0.04%)
Most common places of birth for foreign-born residents (%):
| Little Elm: | 21.0% (1,950) |
| Texas: | 48.4% (2,411,723) |
| Little Elm: | 20.0% (1,863) |
| Texas: | 6.1% (306,347) |
| Little Elm: | 5.9% (550) |
| Texas: | 0.1% (3,573) |
| Little Elm: | 3.9% (366) |
| Texas: | 0.4% (18,642) |
| Little Elm: | 3.9% (366) |
| Texas: | 0.4% (17,796) |
| Little Elm: | 3.6% (339) |
| Texas: | 0.2% (9,236) |
| Little Elm: | 3.6% (335) |
| Texas: | 1.2% (60,172) |
| Little Elm: | 3.0% (283) |
| Texas: | 4.5% (224,455) |
| Little Elm: | 2.8% (257) |
| Texas: | 0.3% (15,833) |
| Little Elm: | 2.7% (254) |
| Texas: | 1.2% (62,159) |
| Little Elm: | 2.7% (254) |
| Texas: | 2.1% (103,148) |
| Little Elm: | 2.3% (217) |
| Texas: | 1.9% (96,110) |
| Little Elm: | 2.1% (197) |
| Texas: | 2.3% (115,558) |
| Little Elm: | 1.8% (172) |
| Texas: | 1.3% (62,978) |
| Little Elm: | 1.7% (156) |
| Texas: | 0.1% (4,509) |
| Little Elm: | 1.6% (151) |
| Texas: | 3.7% (184,770) |
| Little Elm: | 1.6% (146) |
| Texas: | 1.2% (61,555) |
| Little Elm: | 1.5% (141) |
| Texas: | 0.5% (24,705) |
| Little Elm: | 1.5% (140) |
| Texas: | 0.0% (996) |
Place of birth for U.S.-born residents:
- This state: 20,605
- Other state: 19,911
- Northeast: 2,371
- Midwest: 6,229
- South: 5,208
- West: 6,165
86.4% of Little Elm residents lived in the same house 1 years ago.
Out of people who lived in different houses, 23.5% lived in this county.
Out of people who lived in different counties, 71.8% lived in Texas.
| Little Elm: | 86.4% |
| State average: | 85.7% |
Education attainment for males 25 years and older:
- No schooling: 98
- Nursery to 4th grade: 42
- 5th and 6th grade: 53
- 7th and 8th grade: 21
- 9th grade: 97
- 10th grade: 38
- 11th grade: 371
- 12th grade, no diploma: 347
- High school graduate (or equivalency): 3,434
- Less than 1 year of college: 1,093
- Some college more than 1 year, no degree: 2,128
- Associate degree: 1,787
- Bachelor's degree: 4,443
- Master's degree: 2,025
- Professional school degree: 176
- Doctorate degree: 14

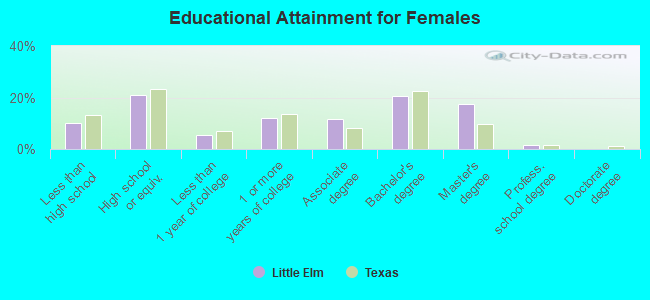
Education attainment for females 25 years and older:
- No schooling: 350
- Nursery to 4th grade: 41
- 5th and 6th grade: 217
- 7th and 8th grade: 151
- 9th grade: 69
- 10th grade: 26
- 11th grade: 201
- 12th grade, no diploma: 638
- High school graduate (or equivalency): 3,519
- Less than 1 year of college: 921
- Some college more than 1 year, no degree: 2,052
- Associate degree: 1,935
- Bachelor's degree: 3,480
- Master's degree: 2,953
- Professional school degree: 253
- Doctorate degree: 22
Housing units in structures:
- One, detached: 13,616
- One, attached: 300
- Two: 94
- 3 or 4: 435
- 5 to 9: 435
- 10 to 19: 1,049
- 20 to 49: 585
- 50 or more: 1,486
- Mobile homes: 770
Median worth of mobile homes: $53,440
Housing units lacking complete kitchen facilities in 2022: 1.3%
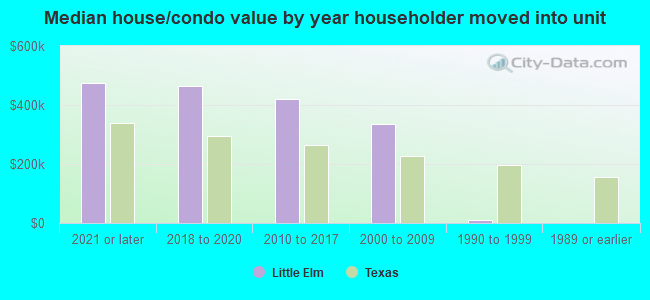
House/condo owner moved in on average 5 years ago
Renter moved in on average 0 years ago
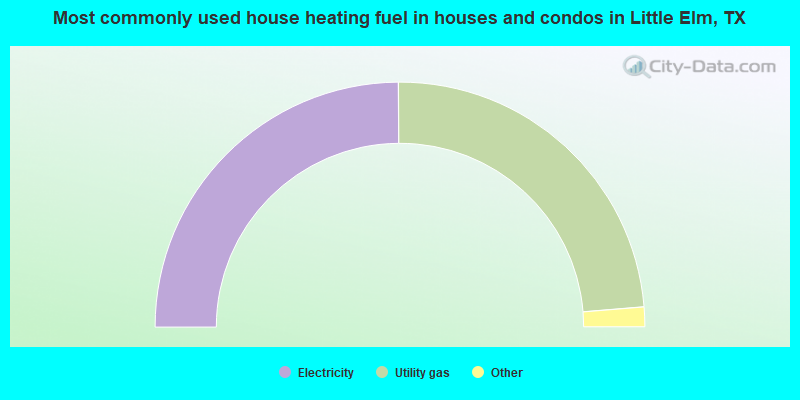
- 49.8%Electricity
- 47.6%Utility gas
- 1.6%Bottled, tank, or LP gas
- 0.5%Solar energy
- 0.3%Fuel oil, kerosene, etc.
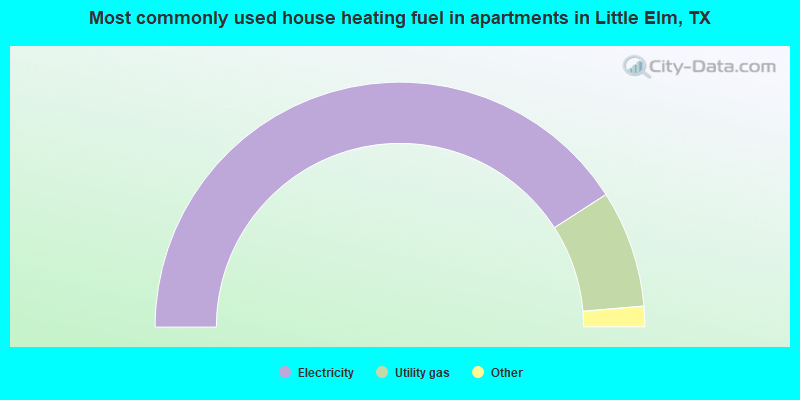
- 81.9%Electricity
- 15.5%Utility gas
- 1.2%Bottled, tank, or LP gas
- 1.2%No fuel used
- 0.3%Fuel oil, kerosene, etc.
Private vs. public school enrollment:
| Here: | 4.0% |
| Texas: | 8.8% |
| Here: | 6.2% |
| Texas: | 8.0% |
| Here: | 7.3% |
| Texas: | 16.2% |