Little Chute, WI (Wisconsin) Houses and Residents
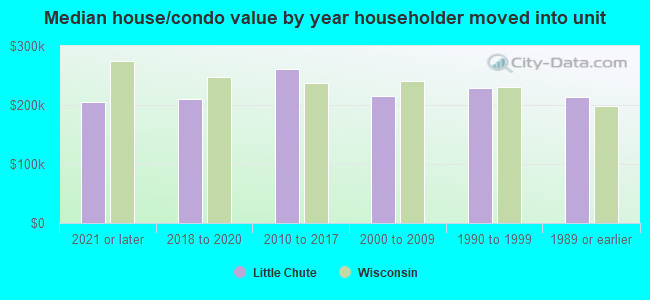
| Little Chute: | $220,902 |
| Wisconsin: | $252,800 |
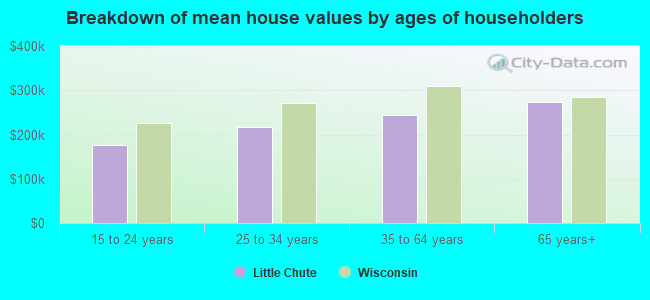
Mean price in 2022:
Detached houses: $235,265
Here: $235,265 State: $308,468 Townhouses or other attached units: $212,960
Here: $212,960 State: $265,873 In 2-unit structures: $197,961
Here: $197,961 State: $203,667 In 5-or-more-unit structures: $152,034
Here: $152,034 State: $280,537 Mobile homes: $24,151
Here: $24,151 State: $79,042
Total population: 10,813 (Urban population: 10,394, Rural population: 54 (all nonfarm))
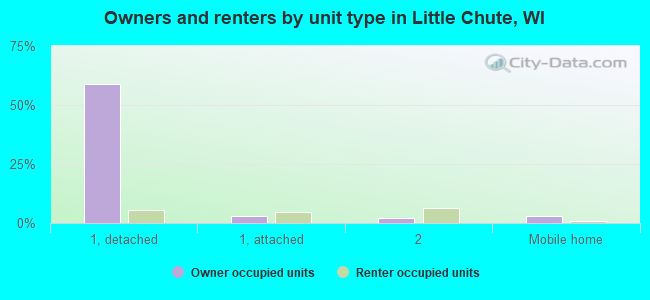
Houses: 5,449 (5,217 occupied: 3,336 owner occupied, 1,943 renter occupied)
| % of renters here: | 37% |
| State: | 32% |
Housing density: 1,320 houses/condos per square mile
Median price asked for vacant for-sale houses and condos in 2022: $1,252,378.
Median contract rent in 2022: $897 (lower quartile is $720, upper quartile is $1,207)
Median rent asked for vacant for-rent units in 2022: $790
Median gross rent in Little Chute, WI in 2022: $1,073
Housing units in Little Chute with a mortgage: 1,926 (218 second mortgage, 0 home equity loan, 133 both second mortgage and home equity loan)
Houses without a mortgage: 26
Median household income for houses/condos with a mortgage: $91,186
Median household income for apartments without a mortgage: $72,159
Median monthly housing costs: $1,048
Compare current foreclosures near Little Chute, WI:
| Photo | Address | Area | Beds / Baths | Price | Details |
|---|---|---|---|---|---|

|
#1
Northview Ln
Little Chute, WI 54140
|
- sq. feet
|
- baths - beds |
show details | |

|
#2
Taylor St
Little Chute, WI 54140
|
- sq. feet
|
- baths - beds |
show details | |

|
#3
Kelly Rd
Little Chute, WI 54140
|
- sq. feet
|
- baths - beds |
show details | |

|
#4
Vandenbroek Rd Lot 54
Little Chute, WI 54140
|
- sq. feet
|
- baths - beds |
show details | |

|
#5
Meadowview Ln
Little Chute, WI 54140
|
- sq. feet
|
- baths - beds |
show details | |

|
#6
E Peter Ln
Little Chute, WI 54140
|
- sq. feet
|
- baths - beds |
show details | |

|
#7
Vandenbroek Rd Lot 84
Little Chute, WI 54140
|
- sq. feet
|
- baths - beds |
show details | |

|
#8
E Mckinley Ave
Little Chute, WI 54140
|
- sq. feet
|
- baths - beds |
show details | |

|
#9
N Oneida St
Appleton, WI 54911
|
2,163 sq. feet
|
2 baths 5 beds |
show details | |

|
#10
E Hancock St
Appleton, WI 54911
|
952 sq. feet
|
1 baths 3 beds |
show details |
| Photo | Address | Area | Beds / Baths | Price | Details |
|---|---|---|---|---|---|

|
#11
E Cranberry Dr
Appleton, WI 54915
|
1,922 sq. feet
|
2 baths 3 beds |
show details | |

|
#12
E Benton Dr
Appleton, WI 54913
|
3,071 sq. feet
|
5 baths 5 beds |
show details | |

|
#13
N Superior St
Appleton, WI 54911
|
1,512 sq. feet
|
1 baths 3 beds |
show details | |

|
#14
S Berry Dr
Appleton, WI 54915
|
1,600 sq. feet
|
1 baths 3 beds |
show details | |

|
#15
W Glendale Ave
Appleton, WI 54911
|
792 sq. feet
|
1 baths 2 beds |
show details | |

|
#16
N Superior St
Appleton, WI 54911
|
1,176 sq. feet
|
1 baths 3 beds |
show details | |

|
#17
N Oneida St
Appleton, WI 54911
|
1,937 sq. feet
|
2 baths 6 beds |
show details | |

|
#18
Lock St
Menasha, WI 54952
|
1,392 sq. feet
|
2 baths 3 beds |
show details | |

|
#19
E Lindbergh St
Appleton, WI 54911
|
1,768 sq. feet
|
2 baths 3 beds |
show details | |

|
#20
S Telulah Ave
Appleton, WI 54915
|
891 sq. feet
|
1 baths 3 beds |
show details |
| Photo | Address | Area | Beds / Baths | Price | Details |
|---|---|---|---|---|---|

|
#21
E Grant St
Appleton, WI 54911
|
1,567 sq. feet
|
2 baths 3 beds |
show details | |

|
#22
E Frances St
Appleton, WI 54911
|
1,352 sq. feet
|
2 baths 2 beds |
show details | |

|
#23
W Oklahoma St
Appleton, WI 54914
|
1,296 sq. feet
|
1 baths 5 beds |
show details | |

|
#24
E Vine St
Appleton, WI 54911
|
1,282 sq. feet
|
1 baths 3 beds |
show details | |

|
#25
E Windfield Pl
Appleton, WI 54911
|
1,228 sq. feet
|
1 baths 2 beds |
show details | |

|
#26
E Northwood Dr
Appleton, WI 54911
|
2,368 sq. feet
|
3 baths 4 beds |
show details | |

|
#27
S Telulah Ave
Appleton, WI 54915
|
560 sq. feet
|
1 baths 1 beds |
show details | |

|
#28
S Irma St
Appleton, WI 54915
|
1,398 sq. feet
|
2 baths 3 beds |
show details | |

|
#29
S Buchanan St
Appleton, WI 54915
|
1,986 sq. feet
|
1 baths 4 beds |
show details | |

|
#30
W Franklin St
Appleton, WI 54914
|
1,462 sq. feet
|
2 baths 2 beds |
show details |
| Photo | Address | Area | Beds / Baths | Price | Details |
|---|---|---|---|---|---|

|
#31
W Lorain St
Appleton, WI 54914
|
1,820 sq. feet
|
2 baths 4 beds |
show details | |

|
#32
Manitoba St
Menasha, WI 54952
|
1,692 sq. feet
|
2 baths 3 beds |
show details | |

|
#33
W Cloverdale Dr
Appleton, WI 54914
|
1,744 sq. feet
|
2 baths 3 beds |
show details | |

|
#34
Geneva Rd
Menasha, WI 54952
|
1,444 sq. feet
|
2 baths 3 beds |
show details | |

|
#35
Deerfield Ave
Menasha, WI 54952
|
1,856 sq. feet
|
3 baths 4 beds |
show details | |

|
#36
Harold Dr
Menasha, WI 54952
|
1,548 sq. feet
|
2 baths 3 beds |
show details | |

|
#37
Northridge Ct
Menasha, WI 54952
|
4,238 sq. feet
|
3 baths 4 beds |
show details | |

|
#38
London St
Menasha, WI 54952
|
1,010 sq. feet
|
1 baths 2 beds |
show details | |

|
#39
7th St
Menasha, WI 54952
|
1,256 sq. feet
|
1 baths 3 beds |
show details | |

|
#40
4th St
Menasha, WI 54952
|
720 sq. feet
|
1 baths 2 beds |
show details |
| Photo | Address | Area | Beds / Baths | Price | Details |
|---|---|---|---|---|---|

|
#41
N Birchwood Ave
Appleton, WI 54914
|
3,168 sq. feet
|
3 baths 6 beds |
show details | |

|
#42
N Edgewood Ave
Appleton, WI 54914
|
1,819 sq. feet
|
2 baths 4 beds |
show details | |

|
#43
Grassymeadow Ln
Menasha, WI 54952
|
1,370 sq. feet
|
2 baths 3 beds |
show details | |

|
#44
S Locust St
Appleton, WI 54914
|
1,520 sq. feet
|
1 baths 3 beds |
show details | |

|
#45
S Outagamie St
Appleton, WI 54914
|
744 sq. feet
|
1 baths 2 beds |
show details | |

|
#46
N Eugene St
Appleton, WI 54914
|
2,301 sq. feet
|
2 baths 4 beds |
show details | |

|
#47
N Douglas St
Appleton, WI 54914
|
1,842 sq. feet
|
2 baths 4 beds |
show details | |

|
#48
Bittersweet Ct
Menasha, WI 54952
|
2,594 sq. feet
|
4 baths 4 beds |
show details | |

|
#49
4th St
Menasha, WI 54952
|
1,248 sq. feet
|
1 baths 2 beds |
show details | |

|
Check over 1 million property listings on Foreclosure.com!
|
browse all offers | |||


 | possible relocation - job New Holstein (2 replies) |
| Train frequency in Little Chute (6 replies) |
| Appleton and the surrounding area Vs Green Bay and it's surrounding areas (21 replies) |
| Appleton People - I need some advice! (11 replies) |
| Family possibly relocating to Appleton area (5 replies) |
| De Pere or Appleton? (9 replies) |

Median year apartment built: 1991
Household type by relationship:
Households: 11,891- Male householders: 2,541 (872 living alone), Female householders: 2,641 (773 living alone)
2,427 spouses (2,417 opposite-sex spouses), 438 unmarried partners, (438 opposite-sex unmarried partners), 3,084 children (2,862 natural, 65 adopted, 156 stepchildren), 70 grandchildren, 36 brothers or sisters, 79 parents, 0 foster children, 123 other relatives, 388 non-relatives
- In group quarters: 60
Size of family households: 1,805 2-persons, 363 3-persons, 415 4-persons, 271 5-persons, 111 6-persons, 56 7-or-more-persons.
Size of nonfamily households: 1,667 1-person, 624 2-persons, 15 3-persons, 15 4-persons.
1,810 married couples with children.
417 single-parent households (85 men, 332 women).
96.0% of residents of Little Chute speak English at home.
3.1% of residents speak Spanish at home (37% speak English very well, 31% speak English well, 22% speak English not well, 10% don't speak English at all).
0.4% of residents speak other Indo-European language at home (100% speak English very well).
0.3% of residents speak Asian or Pacific Island language at home (97% speak English very well, 3% don't speak English at all).
Foreign born population: 325 (2.7%)
(36.3% of them are naturalized citizens)
| Here: | 6.5 |
| State: | 6.5 |
| Here: | 4.3 |
| State: | 4.1 |
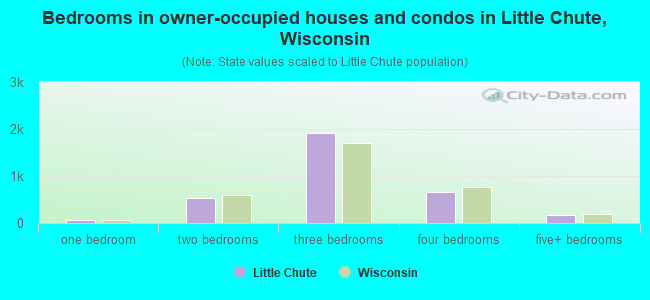
- Bedrooms in owner-occupied houses and condos in Little Chute, Wisconsin
- 0no bedroom
- 641 bedroom
- 5382 bedrooms
- 1,9153 bedrooms
- 6584 bedrooms
- 1615+ bedrooms
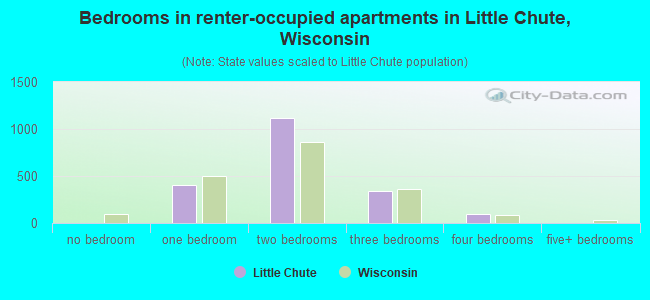
- Bedrooms in renter-occupied apartments in Little Chute, Wisconsin
- 1no bedroom
- 3991 bedroom
- 1,1122 bedrooms
- 3393 bedrooms
- 924 bedrooms
- 05+ bedrooms
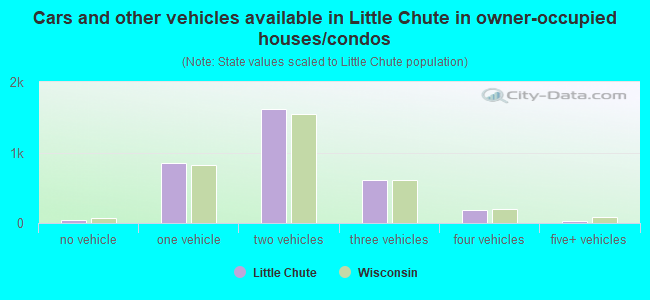
- Cars and other vehicles available in Little Chute in owner-occupied houses/condos
- 36no vehicle
- 8551 vehicle
- 1,6142 vehicles
- 6153 vehicles
- 1824 vehicles
- 345+ vehicles
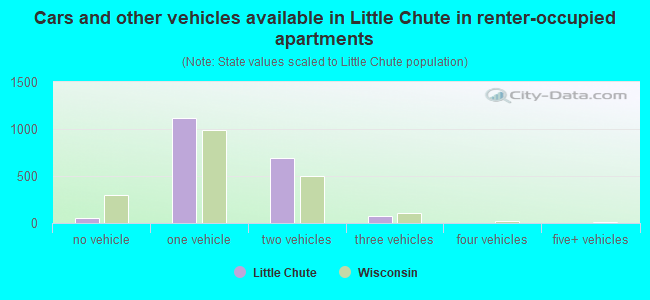
- Cars and other vehicles available in Little Chute in renter-occupied apartments
- 54no vehicle
- 1,1181 vehicle
- 6952 vehicles
- 763 vehicles
- 04 vehicles
- 05+ vehicles
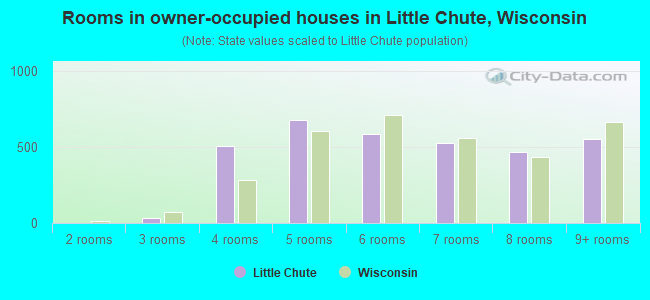
- Rooms in owner-occupied houses in Little Chute, Wisconsin
- 01 room
- 02 rooms
- 353 rooms
- 5084 rooms
- 6735 rooms
- 5836 rooms
- 5257 rooms
- 4638 rooms
- 5499+ rooms
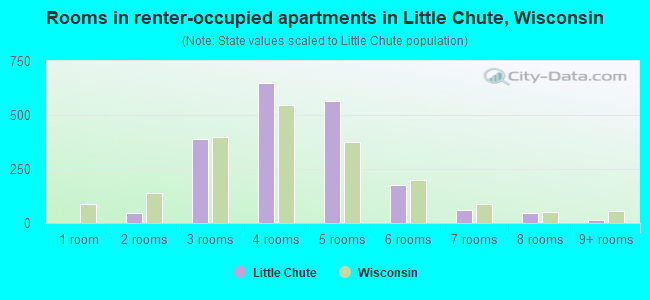
- Rooms in renter-occupied apartments in Little Chute, Wisconsin
- 11 room
- 462 rooms
- 3873 rooms
- 6504 rooms
- 5675 rooms
- 1746 rooms
- 597 rooms
- 448 rooms
- 169+ rooms
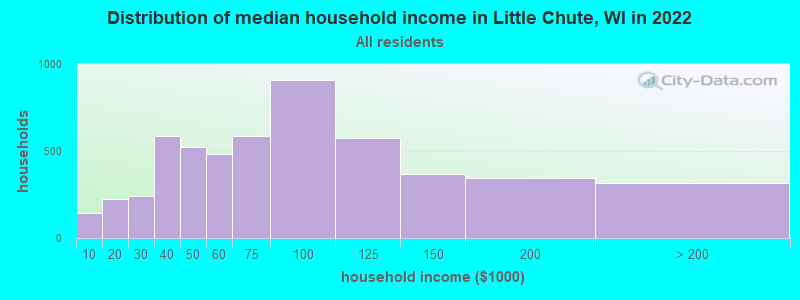
Little Chute, WI household income distribution

- 144Less than $10,000
- 222$10,000 to $19,999
- 242$20,000 to $29,999
- 588$30,000 to $39,999
- 525$40,000 to $49,999
- 483$50,000 to $59,999
- 584$60,000 to $74,999
- 908$75,000 to $99,999
- 575$100,000 to $124,999
- 367$125,000 to $149,999
- 347$150,000 to $199,999
- 318$200,000 or more
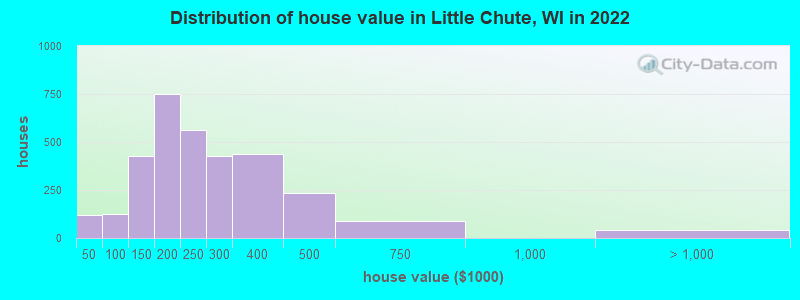
Home value of owner - occupied houses in 2022 in Little Chute, WI
-
- 28Less than $10,000
- 62$10,000 to $14,999
- 13$20,000 to $24,999
- 15$40,000 to $49,999
- 11$50,000 to $59,999
- 66$70,000 to $79,999
- 13$80,000 to $89,999
- 17$90,000 to $99,999
- 207$100,000 to $124,999
- 221$125,000 to $149,999
- 323$150,000 to $174,999
- 428$175,000 to $199,999
- 561$200,000 to $249,999
- 427$250,000 to $299,999
- 439$300,000 to $399,999
- 234$400,000 to $499,999
- 87$500,000 to $749,999
- 44$1,000,000 to $1,499,999
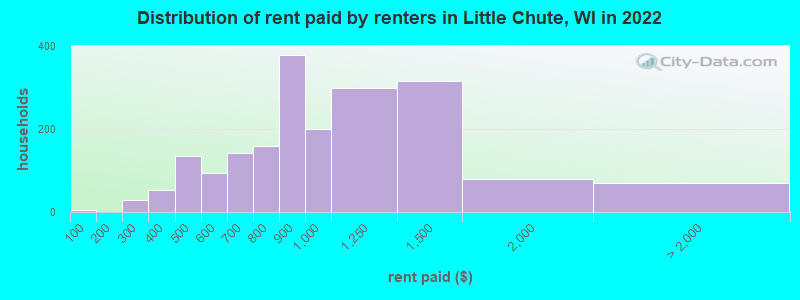
Rent paid by renters in 2022 in Little Chute, WI
-
- 5Less than $100
- 28$250 to $299
- 21$300 to $349
- 30$350 to $399
- 85$400 to $449
- 50$450 to $499
- 38$500 to $549
- 54$550 to $599
- 120$600 to $649
- 21$650 to $699
- 90$700 to $749
- 67$750 to $799
- 379$800 to $899
- 201$900 to $999
- 299$1,000 to $1,249
- 316$1,250 to $1,499
- 78$1,500 to $1,999
- 37$2,000 to $2,499
- 32No cash rent
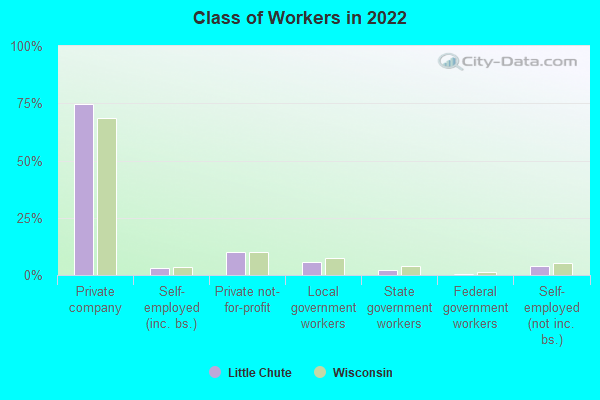
Percentage of workers working in this county: 65.9%
Number of people working at home: 697 (10.9% of all workers)
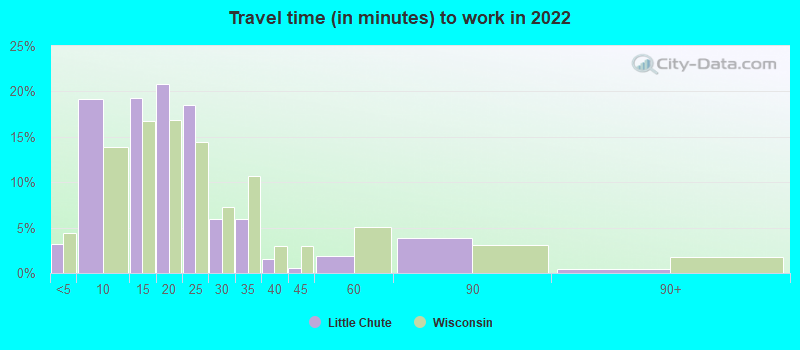
Travel time to work (commute)
- Less than 5 minutes: 151
- 5 to 9 minutes: 977
- 10 to 14 minutes: 1,164
- 15 to 19 minutes: 1,222
- 20 to 24 minutes: 951
- 25 to 29 minutes: 222
- 30 to 34 minutes: 564
- 35 to 39 minutes: 107
- 40 to 44 minutes: 83
- 45 to 59 minutes: 25
- 60 to 89 minutes: 171
- 90 or more minutes: 68
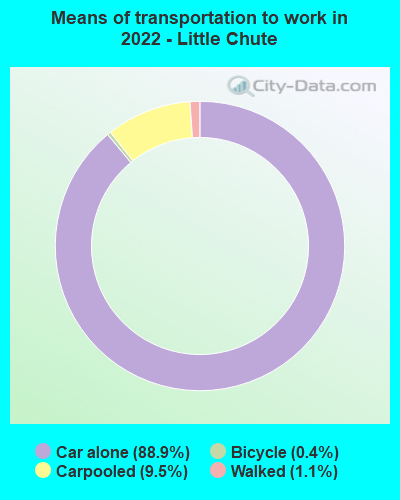
Means of transportation to work:
- Drove a car alone: 4,366 (77.1%)
- Carpooled: 578 (10.2%)
- Taxi: 4 (0.1%)
- Bicycle: 15 (0.3%)
- Walked: 34 (0.6%)
- Worked at home: 697 (12.3%)
- Unemployment by race in 2022
- Unemployment rate for White non-Hispanic residents
- 2.2%Males
- 1.9%Females
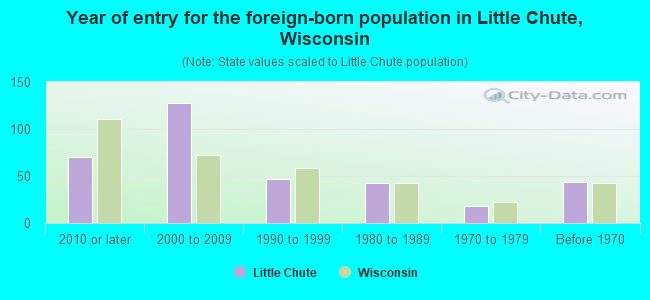
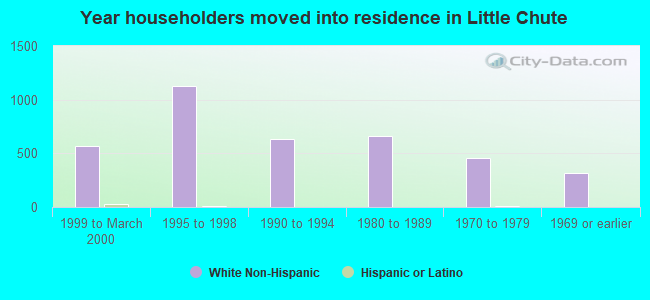
- Year of entry for the foreign-born population in Little Chute, Wisconsin
- 702010 or later
- 1282000 to 2009
- 471990 to 1999
- 431980 to 1989
- 181970 to 1979
- 44Before 1970
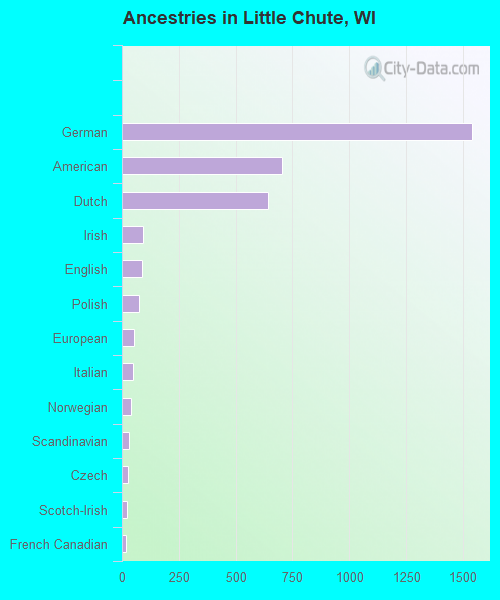
First ancestries reported:
- German: 1,538 (33.6%)
- American: 706 (15.4%)
- Dutch: 642 (14.0%)
- Irish: 94 (2.1%)
- English: 87 (1.9%)
- Polish: 75 (1.6%)
- European: 54 (1.2%)
- Italian: 49 (1.1%)
- Norwegian: 41 (0.9%)
- Scandinavian: 33 (0.7%)
- Czech: 28 (0.6%)
- Scotch-Irish: 23 (0.5%)
- French Canadian: 17 (0.4%)
- Scottish: 13 (0.3%)
- Lebanese: 10 (0.2%)
- Belgian: 6 (0.1%)
- Danish: 5 (0.1%)
- Welsh: 5 (0.1%)
- Austrian: 4 (0.09%)
- Northern European: 2 (0.04%)
- Swedish: 2 (0.04%)
Most common places of birth for foreign-born residents (%):
| Little Chute: | 57.1% (168) |
| Wisconsin: | 29.5% (87,182) |
| Little Chute: | 8.5% (25) |
| Wisconsin: | 0.8% (2,302) |
| Little Chute: | 7.5% (22) |
| Wisconsin: | 2.3% (6,747) |
| Little Chute: | 5.8% (17) |
| Wisconsin: | 3.3% (9,655) |
| Little Chute: | 5.8% (17) |
| Wisconsin: | 8.0% (23,594) |
| Little Chute: | 4.8% (14) |
| Wisconsin: | 0.3% (962) |
| Little Chute: | 3.7% (11) |
| Wisconsin: | 3.1% (9,280) |
| Little Chute: | 3.4% (10) |
| Wisconsin: | 0.7% (1,960) |
Place of birth for U.S.-born residents:
- This state: 9,840
- Other state: 1,675
- Northeast: 182
- Midwest: 955
- South: 233
- West: 299
81.2% of Little Chute residents lived in the same house 1 years ago.
Out of people who lived in different houses, 37.1% lived in this county.
Out of people who lived in different counties, 84.3% lived in Wisconsin.
| Little Chute: | 81.2% |
| State average: | 87.7% |
Education attainment for males 25 years and older:
- No schooling: 26
- Nursery to 4th grade: 0
- 5th and 6th grade: 3
- 7th and 8th grade: 4
- 9th grade: 9
- 10th grade: 43
- 11th grade: 68
- 12th grade, no diploma: 132
- High school graduate (or equivalency): 1,466
- Less than 1 year of college: 195
- Some college more than 1 year, no degree: 689
- Associate degree: 359
- Bachelor's degree: 924
- Master's degree: 257
- Professional school degree: 28
- Doctorate degree: 21

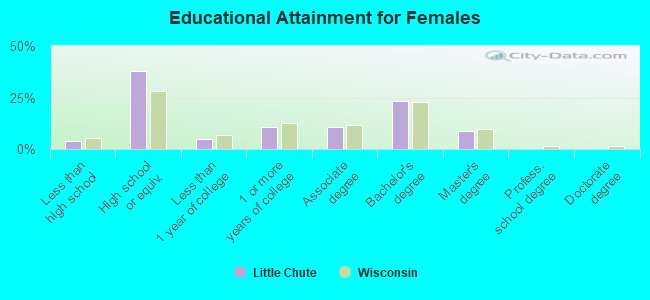
Education attainment for females 25 years and older:
- No schooling: 7
- Nursery to 4th grade: 0
- 5th and 6th grade: 17
- 7th and 8th grade: 46
- 9th grade: 9
- 10th grade: 17
- 11th grade: 21
- 12th grade, no diploma: 40
- High school graduate (or equivalency): 1,495
- Less than 1 year of college: 201
- Some college more than 1 year, no degree: 422
- Associate degree: 419
- Bachelor's degree: 924
- Master's degree: 346
- Professional school degree: 0
- Doctorate degree: 0


Housing units in structures:
- One, detached: 3,288
- One, attached: 562
- Two: 286
- 3 or 4: 55
- 5 to 9: 147
- 10 to 19: 562
- 20 to 49: 173
- 50 or more: 126
- Mobile homes: 245
- Boats, RVs, vans, etc.: 1
Median worth of mobile homes: $16,486
House/condo owner moved in on average 9 years ago
Renter moved in on average 2 years ago
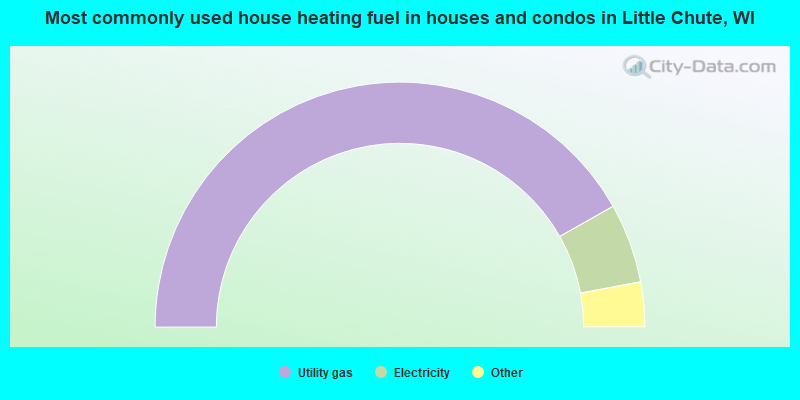
- 83.7%Utility gas
- 10.5%Electricity
- 3.5%Bottled, tank, or LP gas
- 1.6%Wood
- 0.5%Fuel oil, kerosene, etc.
- 0.2%No fuel used
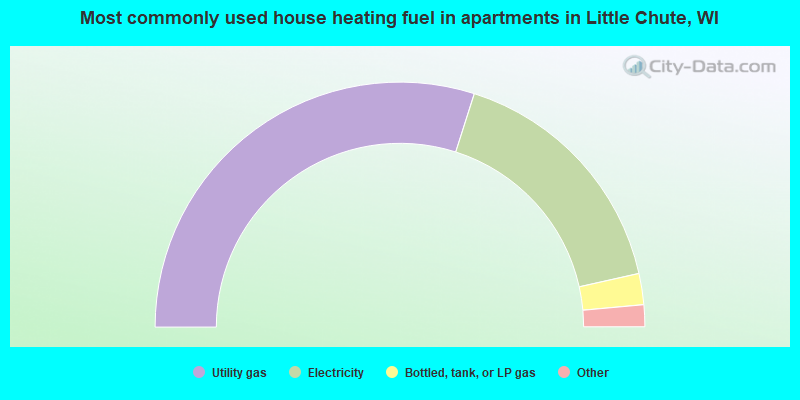
- 59.9%Utility gas
- 33.2%Electricity
- 4.1%Bottled, tank, or LP gas
- 2.5%Other fuel
- 0.3%No fuel used
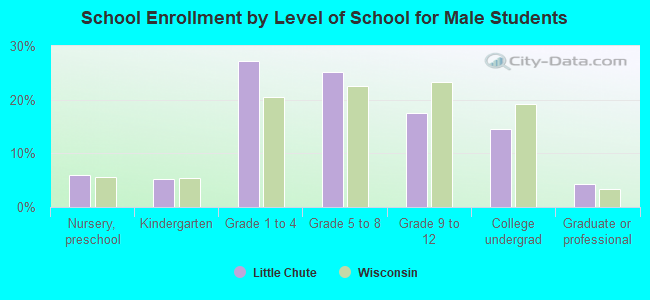
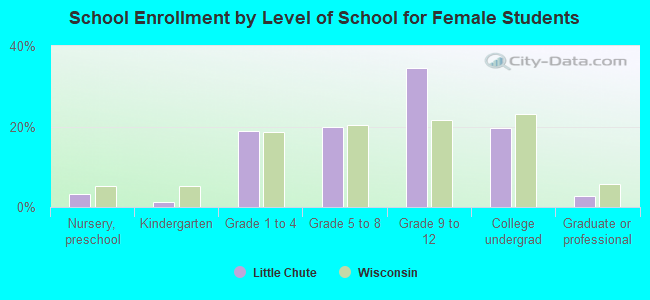
Private vs. public school enrollment:
| Here: | 17.1% |
| Wisconsin: | 16.7% |
| Here: | 3.3% |
| Wisconsin: | 12.5% |
| Here: | 4.4% |
| Wisconsin: | 17.5% |