Lisle, IL (Illinois) Houses and Residents
Estimated median house or condo value in 2022: $404,548 (it was $209,100 in 2000 )
Lisle:
$404,548Illinois:
$251,600
Lower value quartile - upper value quartile: $293,787 - $532,398Mean price in 2022: Detached houses: $497,894 Here:
$497,894State:
$310,164
Townhouses or other attached units: $298,764 Here:
$298,764State:
$286,230
In 3-to-4-unit structures: $183,822 Here:
$183,822State:
$330,907
In 5-or-more-unit structures: $134,413 Here:
$134,413State:
$318,887
Total population: 22,827 (Urban population: 21,119, Rural population: 0)
Houses: 10,436 (10,114 occupied: 5,742 owner occupied, 4,382 renter occupied )
% of renters here:
43%State:
33%
Housing density: 1,638 houses/condos per square mile
Median price asked for vacant for-sale houses and condos in 2022: $768,976.
Median contract rent in 2022: $1,391 (lower quartile is $1,145, upper quartile is $1,797)
Median rent asked for vacant for-rent units in 2022: $2,497
Median gross rent in Lisle, IL in 2022: $1,425
Housing units in Lisle with a mortgage: 3,929 (449 second mortgage, 10 home equity loan, 405 both second mortgage and home equity loan )Houses without a mortgage: 34
Median household income for houses/condos with a mortgage: $156,692
Median household income for apartments without a mortgage: $105,142
Median monthly housing costs: $1,606
Data:
Median house or condo value ($)
Median house or condo value ($ change since 2000)
Median house or condo value ($) - White
Median house or condo value ($) - Black or African American
Median house or condo value ($) - Asian
Median house or condo value ($) - Hispanic or Latino
Median house or condo value ($) - American Indian and Alaska Native
Median house or condo value ($) - Multirace
Median house or condo value ($) - Other Race
Median price asked for mobile homes ($)
Household density (households per square mile)
Mean house or condo value by units in structure - 1, detached ($)
Mean house or condo value by units in structure - 1, attached ($)
Mean house or condo value by units in structure - 2 ($)
Mean house or condo value by units in structure by units in structure - 3 or 4 ($)
Mean house or condo value by units in structure - 5 or more ($)
Mean house or condo value by units in structure - Boat, RV, van, etc. ($)
Mean house or condo value by units in structure - Mobile home ($)
Median contract rent ($)
Median contract rent - Lower quartile ($)
Median contract rent - Upper quartile ($)
Median gross rent ($)
Urban houses (%)
Rural houses (%)
Houses occupied (%)
Houses occupied (% change since 2000)
Houses owner occupied (%)
Houses owner occupied (% change since 2000)
Houses renter occupied (%)
Houses renter occupied (% change since 2000)
Vacant housing units - For rent (%)
Vacant housing units - For rent (% change since 2000)
Vacant housing units - For sale only (%)
Vacant housing units - For sale only (% change since 2000)
Vacant housing units - Rented or sold, not occupied (%)
Vacant housing units - Rented or sold, not occupied (% change since 2000)
Vacant housing units - For seasonal, recreational, or occasional use (%)
Vacant housing units - For seasonal, recreational, or occasional use (% change since 2000)
Vacant housing units - For migrant workers (%)
Vacant housing units - For migrant workers (% change since 2000)
Vacant housing units - Other vacant (%)
Vacant housing units - Other vacant (% change since 2000)
Median monthly housing costs ($)
Median household income for houses/condos with a mortgage ($)
Median household income for houses/condos without a mortgage ($)
Median household income ($)
Median household income ($) - White
Median household income ($) - Black or African American
Median household income ($) - Asian
Median household income ($) - Hispanic or Latino
Median household income ($) - American Indian and Alaska Native
Median household income ($) - Multirace
Median household income ($) - Other Race
Mortgage status - with mortgage (%)
Mortgage status - with second mortgage (%)
Mortgage status - with home equity loan (%)
Mortgage status - with both second mortgage and home equity loan (%)
Mortgage status - without a mortgage (%)
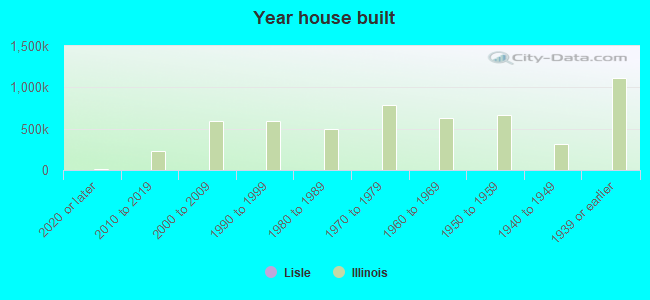
Median year house/condo built
Median year apartment built
Household type by relationship - Male householder living alone (%)
Household type by relationship - Male householder not living alone (%)
Household type by relationship - Female householder living alone (%)
Household type by relationship - Female householder not living alone (%)
Household type by relationship - Opposite-Sex spouse (%)
Household type by relationship - Same-Sex spouse (%)
Household type by relationship - Opposite-Sex unmarried partner (%)
Household type by relationship - Same-Sex unmarried partner (%)
Household type by relationship - In group quarters (%)
Size of family households - 2-person household (%)
Size of family households - 3-person household (%)
Size of family households - 4-person household (%)
Size of family households - 5-person household (%)
Size of family households - 6-person household (%)
Size of family households - 7-or-more-person household (%)
Size of nonfamily households - 1-person household (%)
Size of nonfamily households - 2-person household (%)
Size of nonfamily households - 3-person household (%)
Size of nonfamily households - 4-person household (%)
Size of nonfamily households - 5-person household (%)
Size of nonfamily households - 6-person household (%)
Size of nonfamily households - 7-or-moreperson household (%)
Year house built - Built 2010 or later (%)
Year house built - Built 2000 to 2009 (%)
Year house built - Built 1990 to 1999 (%)
Year house built - Built 1980 to 1989 (%)
Year house built - Built 1970 to 1979 (%)
Year house built - Built 1960 to 1969 (%)
Year house built - Built 1950 to 1959 (%)
Year house built - Built 1940 to 1949 (%)
Year house built - Built 1939 or earlier (%)
Median number of rooms in houses and condos
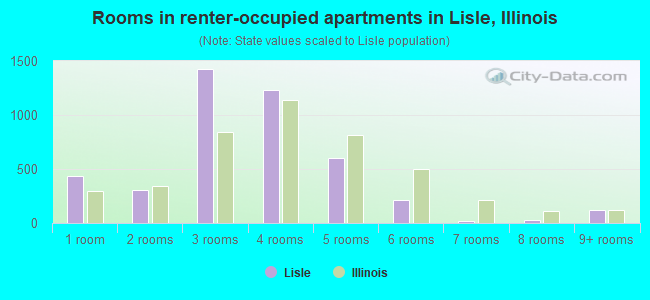
Median number of rooms in apartments
Median number of bedrooms in owner occupied houses
Mean number of bedrooms in owner occupied houses
Median number of bedrooms in renter occupied houses
Mean number of bedrooms in renter occupied houses
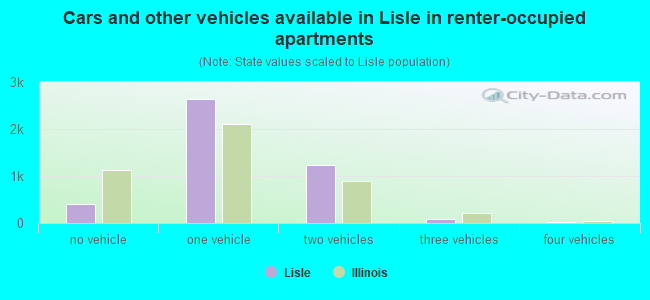
Median number of vehichles in owner occupied houses
Mean number of vehichles in owner occupied houses
Median number of vehichles in renter occupied houses
Mean number of vehichles in renter occupied houses
Rooms in owner-occupied houses - 1 room (%)
Rooms in owner-occupied houses - 2 rooms (%)
Rooms in owner-occupied houses - 3 rooms (%)
Rooms in owner-occupied houses - 4 rooms (%)
Rooms in owner-occupied houses - 5 rooms (%)
Rooms in owner-occupied houses - 6 rooms (%)
Rooms in owner-occupied houses - 7 rooms (%)
Rooms in owner-occupied houses - 8 rooms (%)
Rooms in owner-occupied houses - 9+ rooms (%)
Rooms in renter-occupied houses - 1 room (%)
Rooms in renter-occupied houses - 2 rooms (%)
Rooms in renter-occupied houses - 3 rooms (%)
Rooms in renter-occupied houses - 4 rooms (%)
Rooms in renter-occupied houses - 5 rooms (%)
Rooms in renter-occupied houses - 6 rooms (%)
Rooms in renter-occupied houses - 7 rooms (%)
Rooms in renter-occupied houses - 8 rooms (%)
Rooms in renter-occupied houses - 9+ rooms (%)
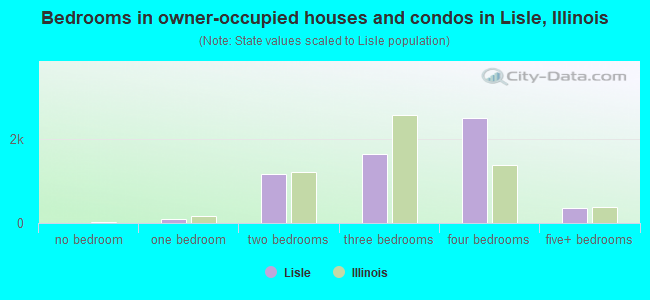
Bedrooms in owner-occupied houses - no bedrooms (%)
Bedrooms in owner-occupied houses - 1 bedroom (%)
Bedrooms in owner-occupied houses - 2 bedrooms (%)
Bedrooms in owner-occupied houses - 3 bedrooms (%)
Bedrooms in owner-occupied houses - 4 bedrooms (%)
Bedrooms in owner-occupied houses - 5+ bedrooms (%)
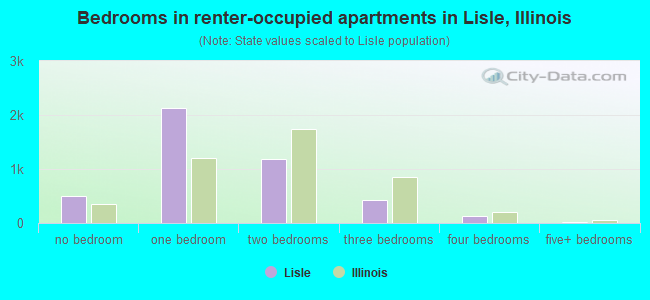
Bedrooms in renter-occupied houses - no bedrooms (%)
Bedrooms in renter-occupied houses - 1 bedroom (%)
Bedrooms in renter-occupied houses - 2 bedrooms (%)
Bedrooms in renter-occupied houses - 3 bedrooms (%)
Bedrooms in renter-occupied houses - 4 bedrooms (%)
Bedrooms in renter-occupied houses - 5+ bedrooms (%)
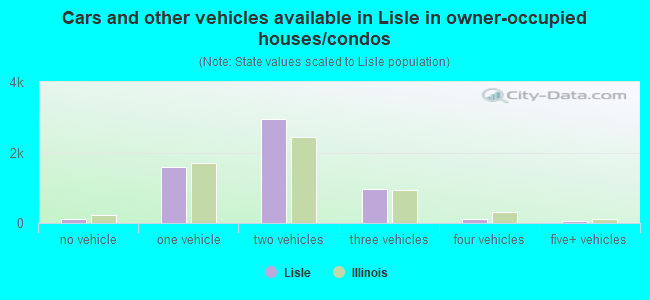
Vehicles available in owner-occupied houses - no vehicle available (%)
Vehicles available in owner-occupied houses - 1 vehicle available(%)
Vehicles available in owner-occupied houses - 2 Vehicles available (%)
Vehicles available in owner-occupied houses - 3 Vehicles available (%)
Vehicles available in owner-occupied houses - 4 Vehicles available (%)
Vehicles available in owner-occupied houses - 5+ Vehicles available (%)
Vehicles available in renter-occupied houses - no vehicle available (%)
Vehicles available in renter-occupied houses - 1 vehicle available (%)
Vehicles available in renter-occupied houses - 2 Vehicles available (%)
Vehicles available in renter-occupied houses - 3 Vehicles available (%)
Vehicles available in renter-occupied houses - 4 Vehicles available (%)
Vehicles available in renter-occupied houses - 5+ Vehicles available (%)
Housing units in structures - 1, detached (%)
Housing units in structures - 1, attached (%)
Housing units in structures - 2 (%)
Housing units in structures - 3 or 4 (%)
Housing units in structures - 5 to 9 (%)
Housing units in structures - 10 to 19 (%)
Housing units in structures - 20 to 49 (%)
Housing units in structures - 50 or more (%)
Housing units in structures - Mobile home (%)
Housing units in structures - Boat, RV, van, etc. (%)
Housing units in structures - Owners - 1, detached (%)
Housing units in structures - Owners - 1, attached (%)
Housing units in structures - Owners - 2 (%)
Housing units in structures - Owners - 3 or 4 (%)
Housing units in structures - Owners - 5 to 9 (%)
Housing units in structures - Owners - 10 to 19 (%)
Housing units in structures - Owners - 20 to 49 (%)
Housing units in structures - Owners - 50 or more (%)
Housing units in structures - Owners - Mobile home (%)
Housing units in structures - Owners - Boat, RV, van, etc. (%)
Housing units in structures - Renters - 1, detached (%)
Housing units in structures - Renters - 1, attached (%)
Housing units in structures - Renters - 2 (%)
Housing units in structures - Renters - 3 or 4 (%)
Housing units in structures - Renters - 5 to 9 (%)
Housing units in structures - Renters - 10 to 19 (%)
Housing units in structures - Renters - 20 to 49 (%)
Housing units in structures - Renters - 50 or more (%)
Housing units in structures - Renters - Mobile home (%)
Housing units in structures - Renters - Boat, RV, van, etc. (%)
House/condo owner moved in on average (years ago)
Renter moved in on average (years ago)
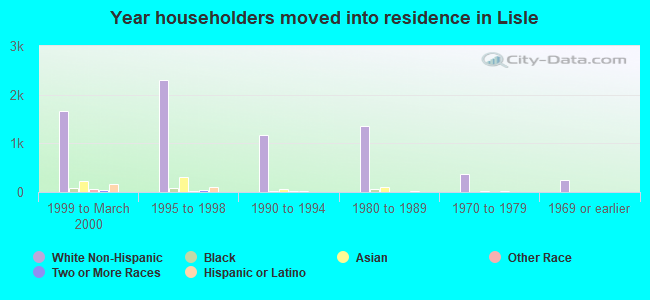
Year householder moved into unit - Moved in 1999 to March 2000 (%)
Year householder moved into unit - Moved in 1999 to March 2000 (%) - White
Year householder moved into unit - Moved in 1999 to March 2000 (%) - Black or African American
Year householder moved into unit - Moved in 1999 to March 2000 (%) - Asian
Year householder moved into unit - Moved in 1999 to March 2000 (%) - Hispanic or Latino
Year householder moved into unit - Moved in 1999 to March 2000 (%) - American Indian and Alaska Native
Year householder moved into unit - Moved in 1999 to March 2000 (%) - Multirace
Year householder moved into unit - Moved in 1999 to March 2000 (%) - Other Race
Year householder moved into unit - Moved in 1995 to 1998 (%)
Year householder moved into unit - Moved in 1995 to 1998 (%) - White
Year householder moved into unit - Moved in 1995 to 1998 (%) - Black or African American
Year householder moved into unit - Moved in 1995 to 1998 (%) - Asian
Year householder moved into unit - Moved in 1995 to 1998 (%) - Hispanic or Latino
Year householder moved into unit - Moved in 1995 to 1998 (%) - American Indian and Alaska Native
Year householder moved into unit - Moved in 1995 to 1998 (%) - Multirace
Year householder moved into unit - Moved in 1995 to 1998 (%) - Other Race
Year householder moved into unit - Moved in 1990 to 1994 (%)
Year householder moved into unit - Moved in 1990 to 1994 (%) - White
Year householder moved into unit - Moved in 1990 to 1994 (%) - Black or African American
Year householder moved into unit - Moved in 1990 to 1994 (%) - Asian
Year householder moved into unit - Moved in 1990 to 1994 (%) - Hispanic or Latino
Year householder moved into unit - Moved in 1990 to 1994 (%) - American Indian and Alaska Native
Year householder moved into unit - Moved in 1990 to 1994 (%) - Multirace
Year householder moved into unit - Moved in 1990 to 1994 (%) - Other Race
Year householder moved into unit - Moved in 1980 to 1989 (%)
Year householder moved into unit - Moved in 1980 to 1989 (%) - White
Year householder moved into unit - Moved in 1980 to 1989 (%) - Black or African American
Year householder moved into unit - Moved in 1980 to 1989 (%) - Asian
Year householder moved into unit - Moved in 1980 to 1989 (%) - Hispanic or Latino
Year householder moved into unit - Moved in 1980 to 1989 (%) - American Indian and Alaska Native
Year householder moved into unit - Moved in 1980 to 1989 (%) - Multirace
Year householder moved into unit - Moved in 1980 to 1989 (%) - Other Race
Year householder moved into unit - Moved in 1970 to 1979 (%)
Year householder moved into unit - Moved in 1970 to 1979 (%) - White
Year householder moved into unit - Moved in 1970 to 1979 (%) - Black or African American
Year householder moved into unit - Moved in 1970 to 1979 (%) - Asian
Year householder moved into unit - Moved in 1970 to 1979 (%) - Hispanic or Latino
Year householder moved into unit - Moved in 1970 to 1979 (%) - American Indian and Alaska Native
Year householder moved into unit - Moved in 1970 to 1979 (%) - Multirace
Year householder moved into unit - Moved in 1970 to 1979 (%) - Other Race
Year householder moved into unit - Moved in 1969 or earlier (%)
Year householder moved into unit - Moved in 1969 or earlier (%) - White
Year householder moved into unit - Moved in 1969 or earlier (%) - Black or African American
Year householder moved into unit - Moved in 1969 or earlier (%) - Asian
Year householder moved into unit - Moved in 1969 or earlier (%) - Hispanic or Latino
Year householder moved into unit - Moved in 1969 or earlier (%) - American Indian and Alaska Native
Year householder moved into unit - Moved in 1969 or earlier (%) - Multirace
Year householder moved into unit - Moved in 1969 or earlier (%) - Other Race
Housing units lacking complete plumbing facilities (%)
Housing units lacking complete kitchen facilities (%)
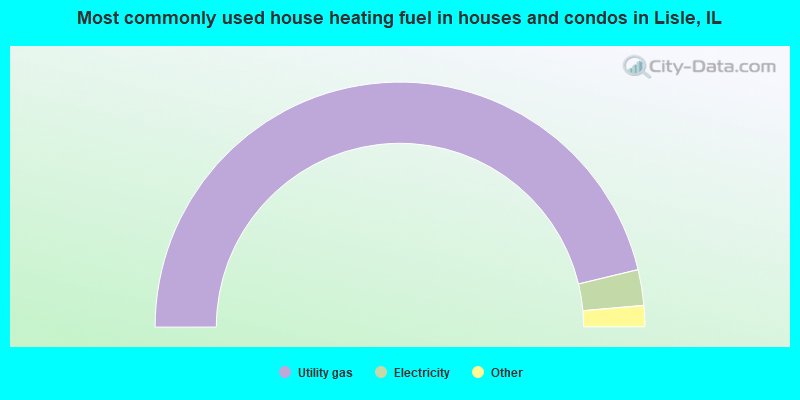
House heating fuel used in houses and condos - Utility gas (%)
House heating fuel used in houses and condos - Bottled, tank, or LP gas (%)
House heating fuel used in houses and condos - Electricity (%)
House heating fuel used in houses and condos - Fuel oil, kerosene, etc. (%)
House heating fuel used in houses and condos - Coal or coke (%)
House heating fuel used in houses and condos - Wood (%)
House heating fuel used in houses and condos - Solar energy (%)
House heating fuel used in houses and condos - Other fuel (%)
House heating fuel used in houses and condos - No fuel used (%)
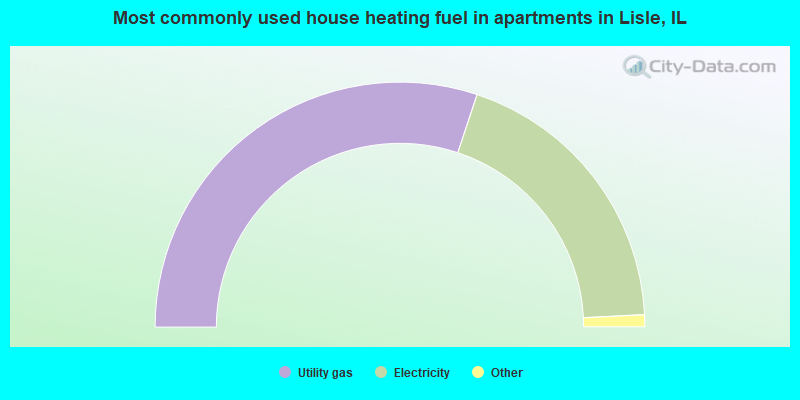
House heating fuel used in apartments - Utility gas (%)
House heating fuel used in apartments - Bottled, tank, or LP gas (%)
House heating fuel used in apartments - Electricity (%)
House heating fuel used in apartments - Fuel oil, kerosene, etc. (%)
House heating fuel used in apartments - Coal or coke (%)
House heating fuel used in apartments - Wood (%)
House heating fuel used in apartments - Solar energy (%)
House heating fuel used in apartments - Other fuel (%)
House heating fuel used in apartments - No fuel used (%)
Latest news about housing in Lisle, IL collected exclusively by city-data.com from local newspapers, TV, and radio stations
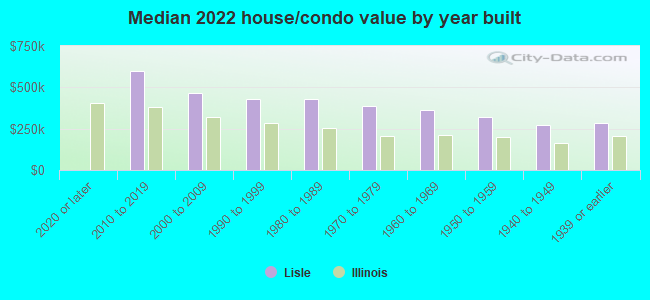
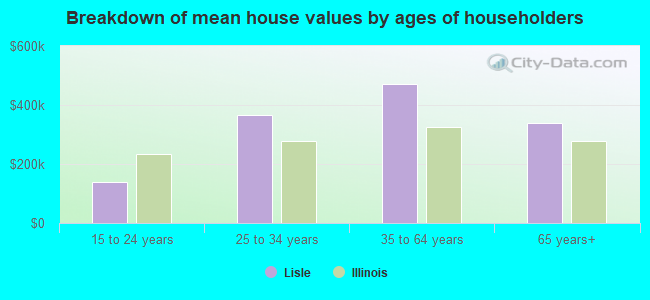
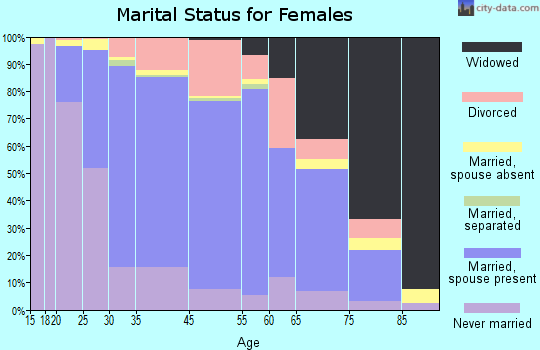
Median year house/condo built: 1982Median year apartment built: 1985Household type by relationship:
Households: 23,255
Male householders: 5,638 (1,968 living alone ), Female householders: 4,319 (1,525 living alone )4,675 spouses (4,651 opposite-sex spouses ), 742 unmarried partners , (658 opposite-sex unmarried partners ), 6,142 children (5,830 natural , 157 adopted , 154 stepchildren ), 168 grandchildren , 92 brothers or sisters , 161 parents , 0 foster children , 116 other relatives , 409 non-relatives In group quarters: 787
Size of family households: 2,742 2-persons , 1,112 3-persons , 1,193 4-persons , 510 5-persons , 56 6-persons , 15 7-or-more-persons .
Size of nonfamily households: 3,620 1-person , 869 2-persons , 18 3-persons , 31 4-persons .
3,545 married couples with children. single-parent households (332 men , 552 women ).
79.0% of residents of Lisle speak English at home. of residents speak Spanish at home (72% speak English very well , 20% speak English well , 7% speak English not well , 2% don't speak English at all ).of residents speak other Indo-European language at home (78% speak English very well , 19% speak English well , 3% speak English not well ).of residents speak Asian or Pacific Island language at home (73% speak English very well , 26% speak English well , 1% speak English not well ).of residents speak other language at home (88% speak English very well , 12% speak English well ).
Foreign born population: 3,796 (16.3%)of them are naturalized citizens )
Median number of rooms in houses and condos:
Median number of rooms in apartments
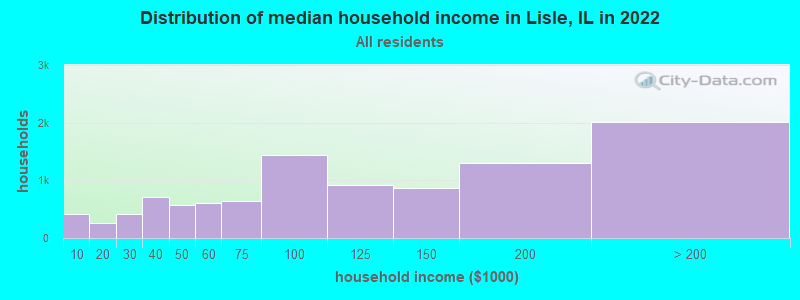
Lisle, IL household income distribution 418 Less than $10,000253 $10,000 to $19,999410 $20,000 to $29,999713 $30,000 to $39,999577 $40,000 to $49,999604 $50,000 to $59,999636 $60,000 to $74,9991,433 $75,000 to $99,999920 $100,000 to $124,999859 $125,000 to $149,9991,306 $150,000 to $199,9992,013 $200,000 or more
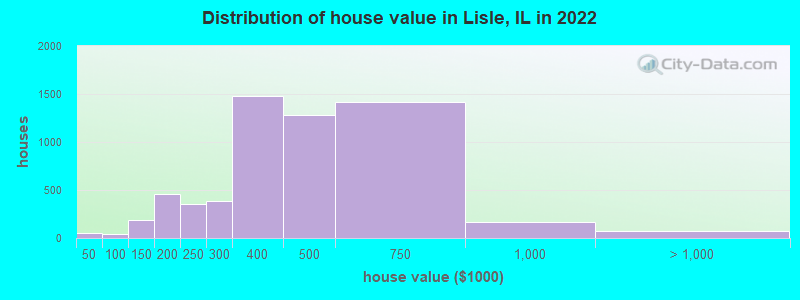
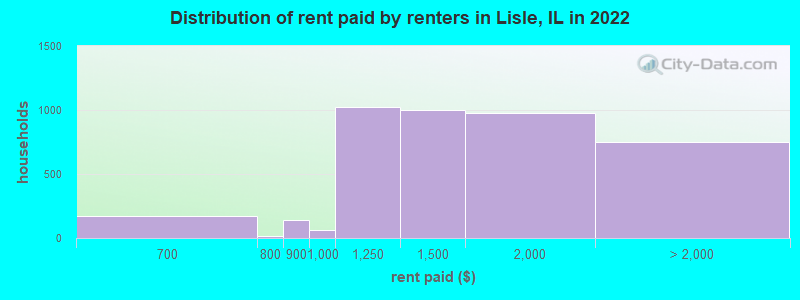
Home value of owner - occupied houses in 2022 in Lisle, IL 31 Less than $10,00014 $20,000 to $24,9996 $35,000 to $39,9994 $40,000 to $49,99912 $50,000 to $59,99912 $80,000 to $89,99911 $90,000 to $99,99938 $100,000 to $124,999153 $125,000 to $149,999275 $150,000 to $174,999181 $175,000 to $199,999354 $200,000 to $249,999384 $250,000 to $299,9991,477 $300,000 to $399,9991,282 $400,000 to $499,9991,413 $500,000 to $749,999163 $750,000 to $999,99967 $1,000,000 to $1,499,999Rent paid by renters in 2022 in Lisle, IL 134 $600 to $64937 $650 to $69912 $700 to $749138 $800 to $89962 $900 to $9991,019 $1,000 to $1,2491,002 $1,250 to $1,499973 $1,500 to $1,999260 $2,000 to $2,49965 $2,500 to $2,999126 $3,000 to $3,499182 $3,500 or more115 No cash rent
Percentage of workers working in this county: 71.4%Number of people working at home: 2,953 (23.5% of all workers )
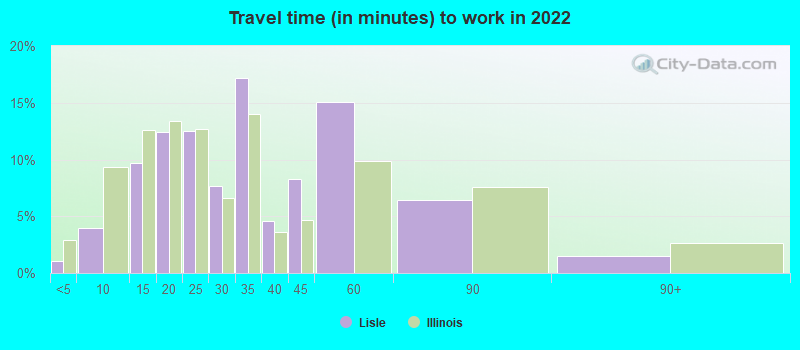
Travel time to work (commute)
Less than 5 minutes: 1445 to 9 minutes: 58510 to 14 minutes: 1,41515 to 19 minutes: 1,52620 to 24 minutes: 1,40025 to 29 minutes: 50130 to 34 minutes: 1,34135 to 39 minutes: 34640 to 44 minutes: 39345 to 59 minutes: 1,05060 to 89 minutes: 69690 or more minutes: 267
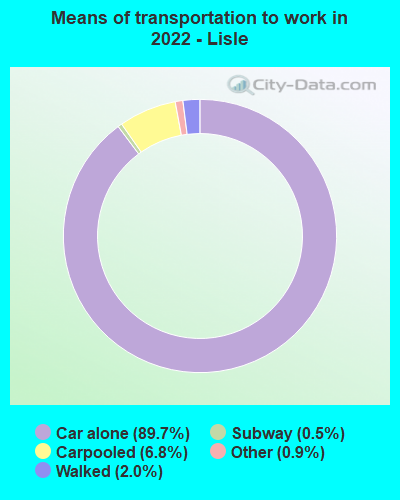
Means of transportation to work:
Drove a car alone: 16,757 (75.5%)Carpooled: 1,561 (7.0%)Long-distance train or commuter rail : 83 (0.4%)Ferryboat: 3 (0.0%)Taxi: 203 (0.9%)Bicycle: 15 (0.1%)Walked: 344 (1.5%)Worked at home: 2,953 (13.3%)
Unemployment by race in 2022
Unemployment rate for White non-Hispanic residents 3.4% Males4.4% FemalesUnemployment rate for Black residents 25.6% FemalesUnemployment rate for Asian residents 1.1% Males6.5% FemalesUnemployment rate for other race residents 13.9% MalesUnemployment rate for two or more race residents 8.3% Males5.2% FemalesUnemployment rate for Hispanic or Latino residents 3.0% Females
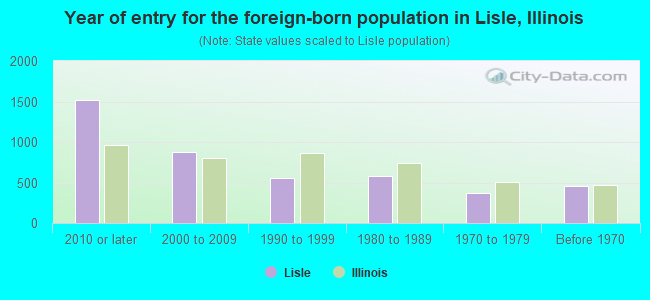
Year of entry for the foreign-born population in Lisle, Illinois
1,523 2010 or later 879 2000 to 2009 551 1990 to 1999 579 1980 to 1989 371 1970 to 1979 454 Before 1970
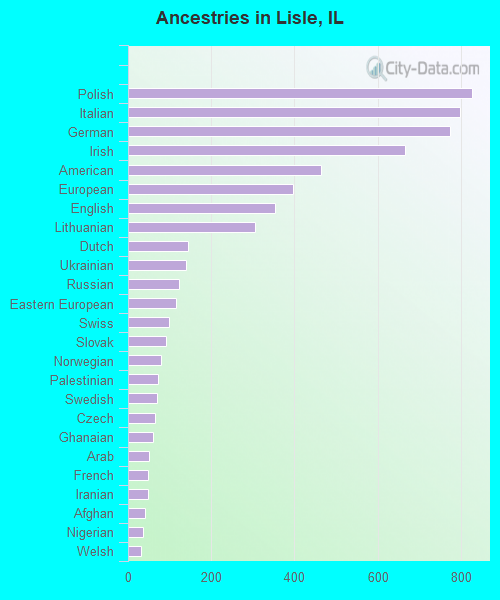
First ancestries reported:
Polish: 826 (7.7%)
Italian: 798 (7.5%)
German: 774 (7.2%)
Irish: 666 (6.2%)
American: 464 (4.3%)
European: 397 (3.7%)
English: 352 (3.3%)
Lithuanian: 306 (2.9%)
Dutch: 145 (1.4%)
Ukrainian: 139 (1.3%)
Russian: 122 (1.1%)
Eastern European: 115 (1.1%)
Swiss: 99 (0.9%)
Slovak: 91 (0.9%)
Norwegian: 80 (0.7%)
Palestinian: 73 (0.7%)
Swedish: 70 (0.7%)
Czech: 64 (0.6%)
Ghanaian: 60 (0.6%)
Arab: 50 (0.5%)
French: 48 (0.4%)
Iranian: 47 (0.4%)
Afghan: 40 (0.4%)
Nigerian: 37 (0.3%)
Welsh: 31 (0.3%)
Greek: 29 (0.3%)
Romanian: 28 (0.3%)
Croatian: 26 (0.2%)
Czechoslovakian: 25 (0.2%)
Scottish: 24 (0.2%)
Belgian: 23 (0.2%)
Canadian: 21 (0.2%)
Slovene: 21 (0.2%)
Danish: 20 (0.2%)
British: 18 (0.2%)
African: 17 (0.2%)
Jamaican: 15 (0.1%)
Finnish: 14 (0.1%)
Bulgarian: 12 (0.1%)
Scotch-Irish: 12 (0.1%)
Liberian: 12 (0.1%)
Scandinavian: 9 (0.08%)
Austrian: 8 (0.07%)
Hungarian: 8 (0.07%)
Lebanese: 8 (0.07%)
Brazilian: 6 (0.06%)
Serbian: 6 (0.06%)
Egyptian: 5 (0.05%)
Most common places of birth for foreign-born residents (%): India Lisle:
32.7% (1,249)Illinois:
9.2% (166,409)
China, excluding Hong Kong and Taiwan Lisle:
9.9% (376)Illinois:
4.1% (74,364)
Lithuania Lisle:
5.0% (189)Illinois:
0.6% (10,249)
Mexico Lisle:
4.5% (170)Illinois:
34.7% (626,958)
Taiwan Lisle:
3.8% (146)Illinois:
0.5% (8,235)
Poland Lisle:
3.6% (139)Illinois:
6.9% (124,474)
Pakistan Lisle:
3.3% (125)Illinois:
1.6% (29,519)
Philippines Lisle:
3.1% (119)Illinois:
5.2% (93,003)
Asia, n.e.c. Lisle:
2.7% (102)Illinois:
0.4% (7,117)
Canada Lisle:
2.6% (100)Illinois:
1.1% (19,306)
United Kingdom, excluding England and Scotland Lisle:
2.4% (91)Illinois:
0.5% (9,671)
Korea Lisle:
2.3% (86)Illinois:
2.2% (40,393)
Ukraine Lisle:
2.2% (83)Illinois:
1.6% (29,316)
Colombia Lisle:
2.1% (81)Illinois:
0.9% (16,553)
Kazakhstan Lisle:
2.1% (79)Illinois:
0.1% (2,070)
Hong Kong Lisle:
1.7% (65)Illinois:
0.3% (5,016)
Afghanistan Lisle:
1.5% (59)Illinois:
0.1% (1,312)
Place of birth for U.S.-born residents:
This state: 14,464Other state: 4,620Northeast: 860Midwest: 2,253South: 741West: 774 83.7% of Lisle residents lived in the same house 1 years ago.
Out of people who lived in different houses, 25.2% lived in this county.
Out of people who lived in different counties, 77.8% lived in Illinois.
Lisle:
83.7%State average:
88.3%
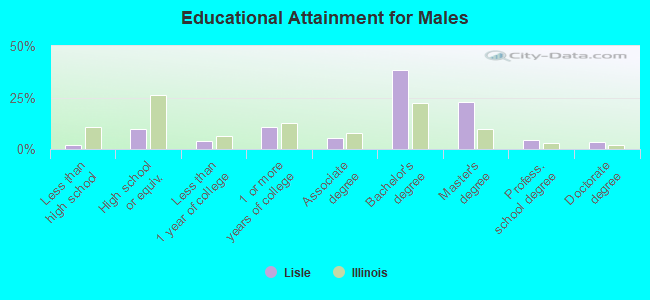
Education attainment for males 25 years and older:
No schooling: 60Nursery to 4th grade: 05th and 6th grade: 27th and 8th grade: 189th grade: 010th grade: 011th grade: 212th grade, no diploma: 98High school graduate (or equivalency): 808Less than 1 year of college: 328Some college more than 1 year, no degree: 880Associate degree: 440Bachelor's degree: 3,173Master's degree: 1,887Professional school degree: 351Doctorate degree: 277
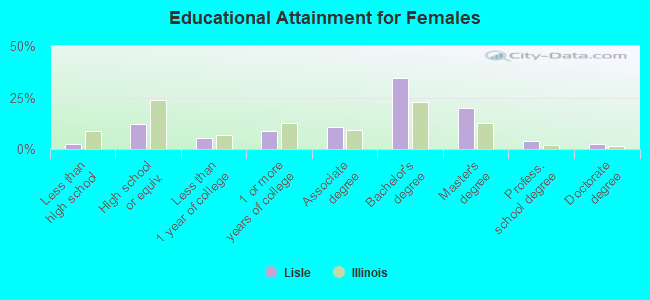
Education attainment for females 25 years and older:
No schooling: 79Nursery to 4th grade: 275th and 6th grade: 37th and 8th grade: 79th grade: 010th grade: 1011th grade: 1812th grade, no diploma: 33High school graduate (or equivalency): 934Less than 1 year of college: 419Some college more than 1 year, no degree: 671Associate degree: 848Bachelor's degree: 2,682Master's degree: 1,540Professional school degree: 312Doctorate degree: 181
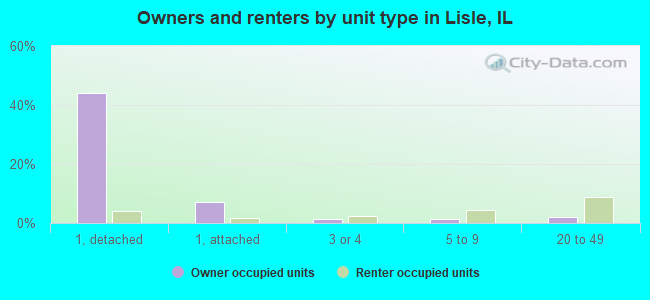
Housing units in structures:
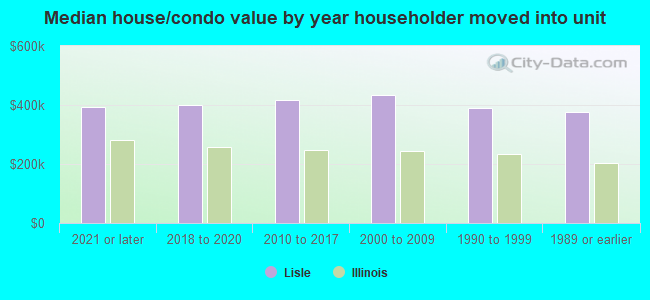
One, detached: 4,864One, attached: 858Two: 543 or 4: 5385 to 9: 84110 to 19: 86620 to 49: 94950 or more: 1,454Mobile homes: 9Housing units lacking complete kitchen facilities in 2022: 0.8%House/condo owner moved in on average 10 years ago
Renter moved in on average 1 years ago
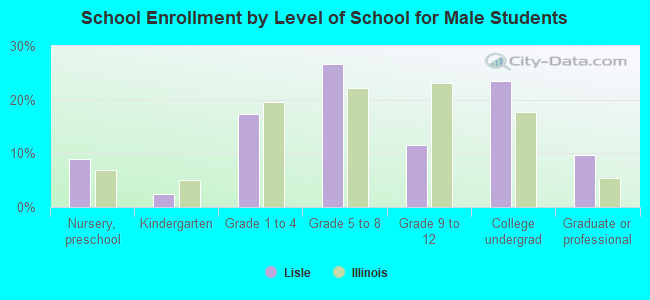
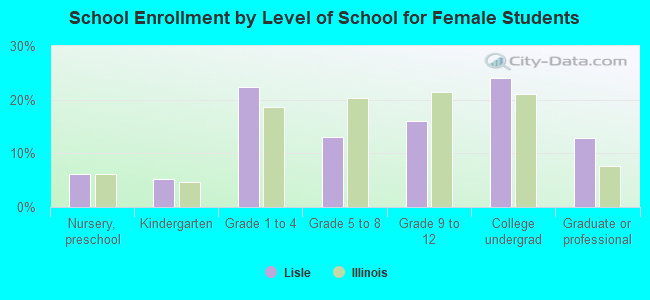
Private vs. public school enrollment:
Students in private schools in grades 1 to 8 (elementary and middle school): 290 Students in private schools in grades 9 to 12 (high school): 67 Students in private undergraduate colleges: 757