Lincoln, CA (California) Houses and Residents
| Lincoln: | $646,546 |
| California: | $715,900 |
Mean price in 2022:
Detached houses: $666,715
Here: $666,715 State: $988,808 Townhouses or other attached units: $374,851
Here: $374,851 State: $838,546 In 3-to-4-unit structures: $329,457
Here: $329,457 State: $824,253 In 5-or-more-unit structures: $756,197
Here: $756,197 State: $730,996 Mobile homes: $124,582
Here: $124,582 State: $184,506
Total population: 45,902 (Urban population: 10,012 (all inside urban clusters), Rural population: 927 (all nonfarm))
Houses: 20,472 (19,835 occupied: 16,680 owner occupied, 3,445 renter occupied)
| % of renters here: | 17% |
| State: | 44% |
Housing density: 1,119 houses/condos per square mile
Median price asked for vacant for-sale houses and condos in 2022: $528,092.
Median contract rent in 2022: $1,776 (lower quartile is $1,329, upper quartile is over $2,000)
Median rent asked for vacant for-rent units in 2022: $3,875
Median gross rent in Lincoln, CA in 2022: over $2,000
Housing units in Lincoln with a mortgage: 11,295 (1,028 second mortgage, 52 home equity loan, 917 both second mortgage and home equity loan)
Houses without a mortgage: 256
Median household income for houses/condos with a mortgage: $121,451
Median household income for apartments without a mortgage: $87,547
Median monthly housing costs: $1,981
Compare current foreclosures in Lincoln, CA:
| Photo | Address | Area | Beds / Baths | Price | Details |
|---|---|---|---|---|---|

|
#1
Portello Way
Lincoln, CA 95648
|
2,927 sq. feet
|
4 baths 4 beds |
show details | |

|
#2
246 Lariat
Lincoln, CA 95648
|
1,815 sq. feet
|
2 baths 2 beds |
show details | |

|
#3
Red Clover Way
Lincoln, CA 95648
|
1,343 sq. feet
|
2 baths 3 beds |
show details | |

|
#4
El Camino Verde Dr
Lincoln, CA 95648
|
2,740 sq. feet
|
3 baths 3 beds |
show details | |

|
#5
Cattail Ct
Lincoln, CA 95648
|
2,871 sq. feet
|
3 baths 4 beds |
show details | |

|
#6
Hidden Hills Ln
Lincoln, CA 95648
|
1,515 sq. feet
|
2 baths 2 beds |
show details | |

|
#7
Canvasback Cir
Lincoln, CA 95648
|
1,827 sq. feet
|
3 baths 3 beds |
show details | |

|
#8
Longspur Loop
Lincoln, CA 95648
|
1,836 sq. feet
|
2 baths 2 beds |
show details | |

|
#9
Courtyards Loop
Lincoln, CA 95648
|
2,142 sq. feet
|
2 baths 3 beds |
show details | |

|
#10
Larkflower Way
Lincoln, CA 95648
|
1,732 sq. feet
|
2 baths 3 beds |
show details |
| Photo | Address | Area | Beds / Baths | Price | Details |
|---|---|---|---|---|---|

|
#11
Cornerstone Ct
Lincoln, CA 95648
|
1,650 sq. feet
|
2 baths 3 beds |
show details | |

|
#12
A St
Lincoln, CA 95648
|
1,018 sq. feet
|
1 baths 2 beds |
show details | |

|
#13
Larkflower Way
Lincoln, CA 95648
|
1,530 sq. feet
|
2 baths 3 beds |
show details | |

|
#14
Longspur Loop
Lincoln, CA 95648
|
1,655 sq. feet
|
2 baths 2 beds |
show details | |

|
#15
Hillsdale Ln
Lincoln, CA 95648
|
2,298 sq. feet
|
3 baths 4 beds |
show details | |

|
#16
6th St
Lincoln, CA 95648
|
1,104 sq. feet
|
2 baths 3 beds |
show details | |

|
#17
Mary Rose Ln
Lincoln, CA 95648
|
1,473 sq. feet
|
2 baths 2 beds |
show details | |

|
#18
Silverton Cir
Lincoln, CA 95648
|
3,081 sq. feet
|
2 baths 4 beds |
show details | |

|
#19
1st St
Lincoln, CA 95648
|
1,300 sq. feet
|
1 baths 3 beds |
show details | |

|
#20
C St
Lincoln, CA 95648
|
1,056 sq. feet
|
1 baths 3 beds |
show details |
| Photo | Address | Area | Beds / Baths | Price | Details |
|---|---|---|---|---|---|

|
#21
Ainsworth Ln
Lincoln, CA 95648
|
2,301 sq. feet
|
2 baths 4 beds |
show details | |

|
#22
Armida Ct
Lincoln, CA 95648
|
2,816 sq. feet
|
3 baths 4 beds |
show details | |

|
#23
Costa Ln
Lincoln, CA 95648
|
1,579 sq. feet
|
2 baths 3 beds |
show details | |

|
#24
Cullum Ct
Lincoln, CA 95648
|
3,227 sq. feet
|
3 baths 5 beds |
show details | |

|
#25
Phoenix Cir
Lincoln, CA 95648
|
1,265 sq. feet
|
2 baths 3 beds |
show details | |

|
#26
Southwick Ln
Lincoln, CA 95648
|
3,206 sq. feet
|
3 baths 4 beds |
show details | |

|
#27
Lindbergh Ln
Lincoln, CA 95648
|
1,053 sq. feet
|
2 baths 3 beds |
show details | |

|
#28
Gladding Rd
Lincoln, CA 95648
|
1,703 sq. feet
|
1 baths 3 beds |
show details | |

|
#29
Hidden Hills Ln
Lincoln, CA 95648
|
1,813 sq. feet
|
2 baths 2 beds |
show details | |

|
#30
Laehr Dr
Lincoln, CA 95648
|
1,690 sq. feet
|
2 baths 3 beds |
show details |
| Photo | Address | Area | Beds / Baths | Price | Details |
|---|---|---|---|---|---|

|
#31
Dedham Ct
Lincoln, CA 95648
|
1,249 sq. feet
|
2 baths 3 beds |
show details | |

|
#32
Q St
Lincoln, CA 95648
|
1,204 sq. feet
|
1 baths 3 beds |
show details | |

|
#33
Redcliffe Ln
Lincoln, CA 95648
|
2,827 sq. feet
|
2 baths 4 beds |
show details | |

|
#34
Eden Ln
Lincoln, CA 95648
|
1,958 sq. feet
|
2 baths 3 beds |
show details | |

|
#35
Heartland Ct
Lincoln, CA 95648
|
3,070 sq. feet
|
3 baths 5 beds |
show details | |

|
#36
La Crena Ct
Lincoln, CA 95648
|
2,775 sq. feet
|
3 baths 4 beds |
show details | |

|
#37
Seymour Cir
Lincoln, CA 95648
|
2,032 sq. feet
|
2 baths 3 beds |
show details | |

|
#38
Vigo Ct
Lincoln, CA 95648
|
- sq. feet
|
- baths - beds |
show details | |

|
#39
Lincoln Airpark Dr
Lincoln, CA 95648
|
- sq. feet
|
- baths - beds |
show details | |

|
#40
Bartonville Rd
Lincoln, CA 95648
|
- sq. feet
|
- baths - beds |
show details |
| Photo | Address | Area | Beds / Baths | Price | Details |
|---|---|---|---|---|---|

|
#41
Citrus St
Lincoln, CA 95648
|
- sq. feet
|
- baths - beds |
show details | |

|
#42
C St
Lincoln, CA 95648
|
- sq. feet
|
- baths - beds |
show details | |

|
#43
Lincolnshire Cir
Lincoln, CA 95648
|
- sq. feet
|
- baths - beds |
show details | |

|
#44
Tucker Swallow Dr
Lincoln, CA 95648
|
- sq. feet
|
- baths - beds |
show details | |

|
#45
Green Ravine Dr
Lincoln, CA 95648
|
- sq. feet
|
- baths - beds |
show details | |

|
#46
Dripping Rock Ln
Lincoln, CA 95648
|
- sq. feet
|
- baths - beds |
show details | |

|
#47
Heartwood St
Lincoln, CA 95648
|
- sq. feet
|
- baths - beds |
show details | |

|
#48
Le Bourget Ln
Lincoln, CA 95648
|
- sq. feet
|
- baths - beds |
show details | |

|
#49
Bunting Ln
Lincoln, CA 95648
|
- sq. feet
|
- baths - beds |
show details | |

|
Check over 1 million property listings on Foreclosure.com!
|
browse all offers | |||

Latest news about housing in Lincoln, CA collected exclusively by city-data.com from local newspapers, TV, and radio stations

 | Explain to me why highrise condos/apartments in Sacramento don't pencil out (87 replies) |
| Median Household Income Census Edition (33 replies) |
| Suggestions for getting our first house (89 replies) |
| Home prices in Carmichael, Fair Oaks and Folsom (33 replies) |
| New Venice Luxury Apartments (19 replies) |
| Please help us decide between new housing developments (rancho/Lincoln/elk grove) (12 replies) |

Median year apartment built: 1998
Household type by relationship:
Households: 51,507- Male householders: 9,940 (1,278 living alone), Female householders: 9,748 (3,457 living alone)
11,915 spouses (11,833 opposite-sex spouses), 952 unmarried partners, (911 opposite-sex unmarried partners), 14,957 children (14,260 natural, 129 adopted, 568 stepchildren), 684 grandchildren, 274 brothers or sisters, 878 parents, 42 foster children, 746 other relatives, 1,158 non-relatives
- In group quarters: 207
Size of family households: 6,731 2-persons, 2,520 3-persons, 2,742 4-persons, 1,486 5-persons, 547 6-persons, 262 7-or-more-persons.
Size of nonfamily households: 4,996 1-person, 650 2-persons, 11 3-persons, 129 4-persons, 34 5-persons.
8,638 married couples with children.
2,042 single-parent households (570 men, 1,472 women).
86.4% of residents of Lincoln speak English at home.
6.4% of residents speak Spanish at home (77% speak English very well, 11% speak English well, 7% speak English not well, 4% don't speak English at all).
3.0% of residents speak other Indo-European language at home (78% speak English very well, 19% speak English well, 2% speak English not well, 2% don't speak English at all).
3.9% of residents speak Asian or Pacific Island language at home (54% speak English very well, 34% speak English well, 11% speak English not well, 1% don't speak English at all).
0.7% of residents speak other language at home (91% speak English very well, 9% speak English well).
Foreign born population: 5,623 (10.9%)
(70.2% of them are naturalized citizens)
| Here: | 6.3 |
| State: | 6.0 |
| Here: | 5.0 |
| State: | 3.9 |

- Bedrooms in owner-occupied houses and condos in Lincoln, California
- 35no bedroom
- 1791 bedroom
- 4,5372 bedrooms
- 6,2643 bedrooms
- 3,7604 bedrooms
- 1,9065+ bedrooms

- Bedrooms in renter-occupied apartments in Lincoln, California
- 16no bedroom
- 2671 bedroom
- 1,4292 bedrooms
- 1,3503 bedrooms
- 2894 bedrooms
- 965+ bedrooms

- Cars and other vehicles available in Lincoln in owner-occupied houses/condos
- 194no vehicle
- 4,9611 vehicle
- 7,6602 vehicles
- 2,9273 vehicles
- 6754 vehicles
- 2635+ vehicles

- Cars and other vehicles available in Lincoln in renter-occupied apartments
- 137no vehicle
- 1,2451 vehicle
- 1,5662 vehicles
- 3523 vehicles
- 1384 vehicles
- 95+ vehicles

- Rooms in owner-occupied houses in Lincoln, California
- 351 room
- 262 rooms
- 3533 rooms
- 1,4574 rooms
- 3,3245 rooms
- 4,3596 rooms
- 2,5747 rooms
- 2,0898 rooms
- 2,4649+ rooms

- Rooms in renter-occupied apartments in Lincoln, California
- 161 room
- 412 rooms
- 3763 rooms
- 8814 rooms
- 8205 rooms
- 7176 rooms
- 1167 rooms
- 2658 rooms
- 2149+ rooms


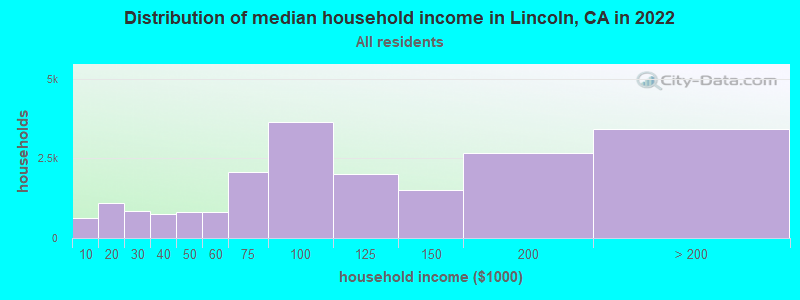
Lincoln, CA household income distribution

- 613Less than $10,000
- 1,088$10,000 to $19,999
- 858$20,000 to $29,999
- 763$30,000 to $39,999
- 830$40,000 to $49,999
- 824$50,000 to $59,999
- 2,066$60,000 to $74,999
- 3,644$75,000 to $99,999
- 2,008$100,000 to $124,999
- 1,507$125,000 to $149,999
- 2,681$150,000 to $199,999
- 3,426$200,000 or more
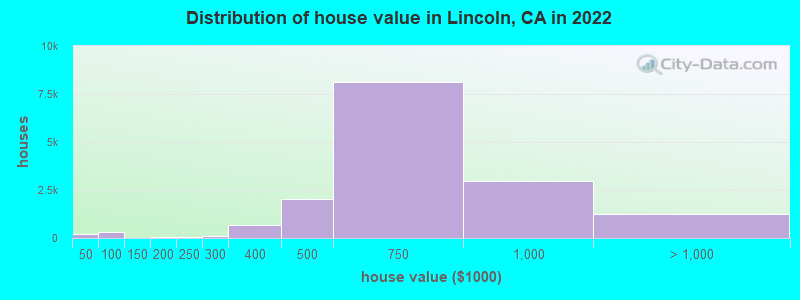
Home value of owner - occupied houses in 2022 in Lincoln, CA
-
- 140Less than $10,000
- 5$15,000 to $19,999
- 14$20,000 to $24,999
- 19$35,000 to $39,999
- 29$40,000 to $49,999
- 26$50,000 to $59,999
- 120$60,000 to $69,999
- 121$70,000 to $79,999
- 18$80,000 to $89,999
- 16$90,000 to $99,999
- 51$150,000 to $174,999
- 26$175,000 to $199,999
- 72$200,000 to $249,999
- 89$250,000 to $299,999
- 697$300,000 to $399,999
- 2,032$400,000 to $499,999
- 8,099$500,000 to $749,999
- 2,984$750,000 to $999,999
- 871$1,000,000 to $1,499,999
- 91$1,500,000 to $1,999,999
- 268$2,000,000 or more
Rent paid by renters in 2022 in Lincoln, CA
-
- 6Less than $100
- 52$150 to $199
- 34$200 to $249
- 23$300 to $349
- 9$450 to $499
- 13$600 to $649
- 29$650 to $699
- 18$800 to $899
- 451$1,000 to $1,249
- 443$1,250 to $1,499
- 845$1,500 to $1,999
- 621$2,000 to $2,499
- 208$2,500 to $2,999
- 327$3,000 to $3,499
- 93$3,500 or more
- 216No cash rent

Percentage of workers working in this county: 70.5%
Number of people working at home: 3,990 (19.3% of all workers)
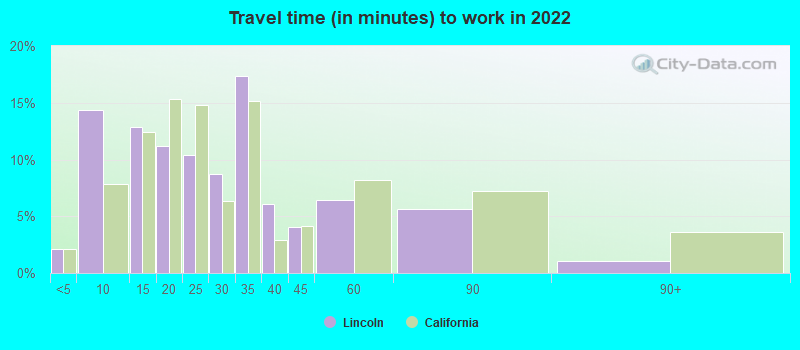
Travel time to work (commute)
- Less than 5 minutes: 283
- 5 to 9 minutes: 1,846
- 10 to 14 minutes: 2,033
- 15 to 19 minutes: 2,242
- 20 to 24 minutes: 2,042
- 25 to 29 minutes: 765
- 30 to 34 minutes: 2,262
- 35 to 39 minutes: 657
- 40 to 44 minutes: 1,164
- 45 to 59 minutes: 1,462
- 60 to 89 minutes: 1,030
- 90 or more minutes: 675
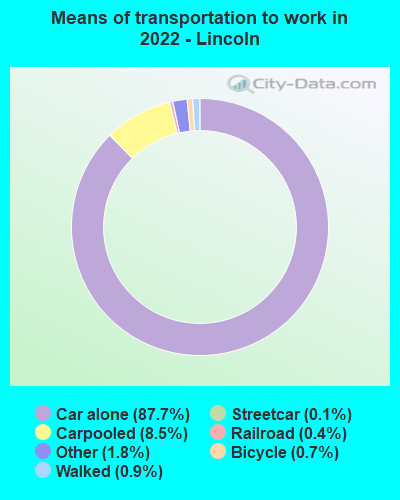
Means of transportation to work:
- Drove a car alone: 8,410 (61.1%)
- Carpooled: 1,006 (7.3%)
- Subway or elevated rail: 12 (0.1%)
- Light rail, streetcar or trolley: 59 (0.4%)
- Taxi: 230 (1.7%)
- Bicycle: 49 (0.4%)
- Walked: 154 (1.1%)
- Worked at home: 3,990 (29.0%)
- Unemployment by race in 2022
- Unemployment rate for White non-Hispanic residents
- 5.4%Males
- 3.8%Females
- Unemployment rate for American Indian and Alaska Native residents
- 32.6%Females
- Unemployment rate for Asian residents
- 4.6%Males
- 1.4%Females
- Unemployment rate for other race residents
- 7.3%Females
- Unemployment rate for two or more race residents
- 1.5%Males
- 4.0%Females
- Unemployment rate for Hispanic or Latino residents
- 1.4%Males
- 5.6%Females

- Year of entry for the foreign-born population in Lincoln, California
- 6862010 or later
- 1,1152000 to 2009
- 1,0541990 to 1999
- 3891980 to 1989
- 2981970 to 1979
- 322Before 1970

First ancestries reported:
- English: 2,546 (11.4%)
- German: 1,853 (8.3%)
- American: 1,620 (7.3%)
- Irish: 1,270 (5.7%)
- European: 1,081 (4.8%)
- Italian: 1,011 (4.5%)
- Norwegian: 300 (1.3%)
- Portuguese: 253 (1.1%)
- Scottish: 251 (1.1%)
- Scotch-Irish: 235 (1.1%)
- Swedish: 202 (0.9%)
- Dutch: 184 (0.8%)
- Serbian: 167 (0.7%)
- Ukrainian: 152 (0.7%)
- Croatian: 129 (0.6%)
- Russian: 128 (0.6%)
- Scandinavian: 116 (0.5%)
- Czech: 109 (0.5%)
- Arab: 106 (0.5%)
- Iranian: 105 (0.5%)
- Greek: 100 (0.4%)
- French: 96 (0.4%)
- Finnish: 96 (0.4%)
- Palestinian: 94 (0.4%)
- British: 70 (0.3%)
- Nigerian: 65 (0.3%)
- Polish: 59 (0.3%)
- Northern European: 52 (0.2%)
- Danish: 50 (0.2%)
- Swiss: 42 (0.2%)
- Armenian: 38 (0.2%)
- Afghan: 35 (0.2%)
- Maltese: 34 (0.2%)
- Romanian: 33 (0.1%)
- Welsh: 33 (0.1%)
- Canadian: 31 (0.1%)
- Eastern European: 27 (0.1%)
- Slovak: 25 (0.1%)
- Lithuanian: 25 (0.1%)
- Hungarian: 23 (0.1%)
- Austrian: 20 (0.09%)
- Jordanian: 12 (0.05%)
- Ethiopian: 11 (0.05%)
- Yugoslavian: 11 (0.05%)
- Belgian: 10 (0.04%)
- Jamaican: 10 (0.04%)
- Latvian: 6 (0.03%)
- Egyptian: 5 (0.02%)
- French Canadian: 4 (0.02%)
- African: 4 (0.02%)
Most common places of birth for foreign-born residents (%):
| Lincoln: | 19.2% (1,043) |
| California: | 37.2% (3,881,193) |
| Lincoln: | 14.4% (781) |
| California: | 7.8% (818,297) |
| Lincoln: | 10.1% (552) |
| California: | 5.2% (539,184) |
| Lincoln: | 5.5% (300) |
| California: | 4.9% (512,335) |
| Lincoln: | 5.1% (276) |
| California: | 0.7% (73,304) |
| Lincoln: | 4.0% (217) |
| California: | 6.6% (684,672) |
| Lincoln: | 3.3% (181) |
| California: | 0.6% (57,953) |
| Lincoln: | 3.3% (179) |
| California: | 1.2% (127,477) |
| Lincoln: | 2.8% (154) |
| California: | 3.0% (315,248) |
| Lincoln: | 2.7% (146) |
| California: | 0.7% (74,025) |
| Lincoln: | 1.9% (103) |
| California: | 0.2% (16,384) |
| Lincoln: | 1.8% (99) |
| California: | 0.6% (60,761) |
Place of birth for U.S.-born residents:
- This state: 33,440
- Other state: 11,844
- Northeast: 1,870
- Midwest: 3,866
- South: 2,510
- West: 3,564
88.6% of Lincoln residents lived in the same house 1 years ago.
Out of people who lived in different houses, 32.3% lived in this county.
Out of people who lived in different counties, 90.4% lived in California.
| Lincoln: | 88.6% |
| State average: | 88.9% |
Education attainment for males 25 years and older:
- No schooling: 254
- Nursery to 4th grade: 0
- 5th and 6th grade: 121
- 7th and 8th grade: 60
- 9th grade: 11
- 10th grade: 23
- 11th grade: 179
- 12th grade, no diploma: 70
- High school graduate (or equivalency): 3,301
- Less than 1 year of college: 1,202
- Some college more than 1 year, no degree: 3,268
- Associate degree: 2,156
- Bachelor's degree: 3,814
- Master's degree: 1,992
- Professional school degree: 523
- Doctorate degree: 310

Education attainment for females 25 years and older:
- No schooling: 360
- Nursery to 4th grade: 85
- 5th and 6th grade: 43
- 7th and 8th grade: 87
- 9th grade: 0
- 10th grade: 124
- 11th grade: 174
- 12th grade, no diploma: 176
- High school graduate (or equivalency): 4,077
- Less than 1 year of college: 1,919
- Some college more than 1 year, no degree: 3,564
- Associate degree: 2,599
- Bachelor's degree: 4,192
- Master's degree: 1,994
- Professional school degree: 510
- Doctorate degree: 128


Housing units in structures:
- One, detached: 18,829
- One, attached: 507
- Two: 65
- 3 or 4: 307
- 5 to 9: 363
- 10 to 19: 112
- 20 to 49: 113
- 50 or more: 136
- Mobile homes: 36
Housing units lacking complete kitchen facilities in 2022: 0.4%
House/condo owner moved in on average 8 years ago
Renter moved in on average 4 years ago

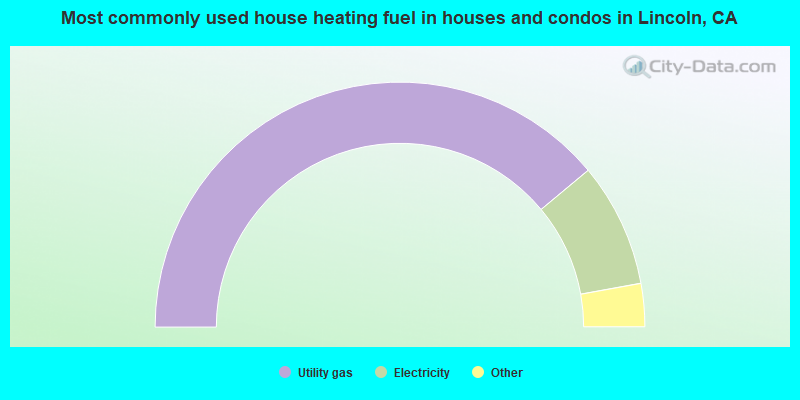
- 78.0%Utility gas
- 16.4%Electricity
- 3.9%Solar energy
- 1.4%Bottled, tank, or LP gas
- 0.3%Wood
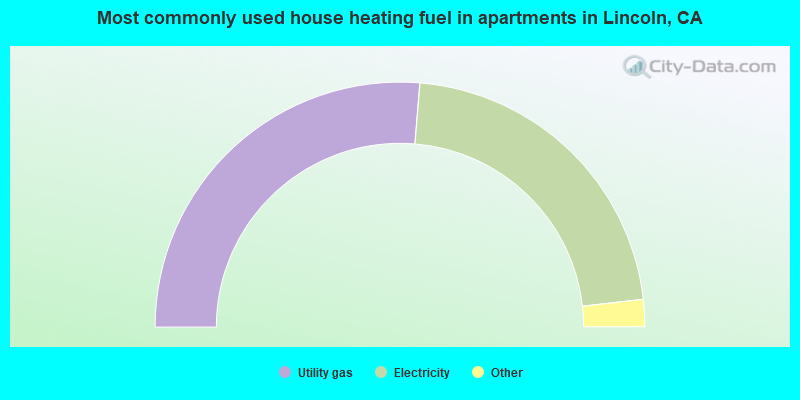
- 52.6%Utility gas
- 43.8%Electricity
- 1.4%Solar energy
- 1.1%No fuel used
- 1.0%Bottled, tank, or LP gas
- 0.2%Wood
Private vs. public school enrollment:
| Here: | 11.1% |
| California: | 10.5% |
| Here: | 3.2% |
| California: | 8.5% |
| Here: | 10.8% |
| California: | 15.9% |


