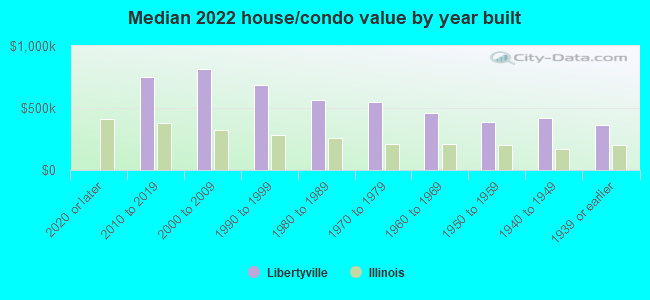
Libertyville, IL (Illinois) Houses and Residents
| Libertyville: | $510,770 |
| Illinois: | $251,600 |
Mean price in 2022:
Detached houses: $726,475
Here: $726,475 State: $310,164 Townhouses or other attached units: $432,161
Here: $432,161 State: $286,230 In 2-unit structures: $593,766
Here: $593,766 State: $299,638 In 3-to-4-unit structures: $215,043
Here: $215,043 State: $330,907 In 5-or-more-unit structures: $273,776
Here: $273,776 State: $318,887
Total population: 20,512 (All urban)
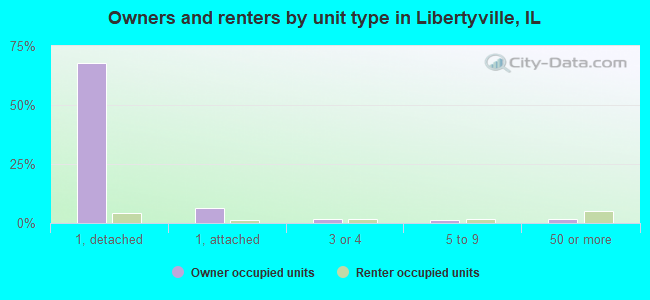
Houses: 7,941 (7,643 occupied: 6,315 owner occupied, 1,473 renter occupied)
| % of renters here: | 19% |
| State: | 33% |
Housing density: 905 houses/condos per square mile
Median price asked for vacant for-sale houses and condos in 2022: $543,487.
Median contract rent in 2022: $1,374 (lower quartile is $1,056, upper quartile is $1,769)
Median rent asked for vacant for-rent units in 2022: $2,832
Median gross rent in Libertyville, IL in 2022: $1,470
Housing units in Libertyville with a mortgage: 4,173 (395 second mortgage, 4 home equity loan, 378 both second mortgage and home equity loan)
Houses without a mortgage: 21
Median household income for houses/condos with a mortgage: $214,074
Median household income for apartments without a mortgage: $140,405
Median monthly housing costs: $2,186
Compare current foreclosures near Libertyville, IL:
| Photo | Address | Area | Beds / Baths | Price | Details |
|---|---|---|---|---|---|

|
#1
N Butterfield Rd
Libertyville, IL 60048
|
1,704 sq. feet
|
2 baths - beds |
show details | |

|
#2
S 4th Ave
Libertyville, IL 60048
|
2,144 sq. feet
|
2 baths - beds |
show details | |

|
#3
N Leesley Ct
Libertyville, IL 60048
|
2,257 sq. feet
|
2 baths - beds |
show details | |

|
#4
Forest Creek Ln # 22-11
Libertyville, IL 60048
|
2,600 sq. feet
|
2 baths - beds |
show details | |

|
#5
Glenmore Dr
Libertyville, IL 60048
|
2,058 sq. feet
|
2 baths - beds |
show details | |

|
#6
Briarwood Ln
Libertyville, IL 60048
|
1,966 sq. feet
|
2 baths - beds |
show details | |

|
#7
E Lincoln Ave
Libertyville, IL 60048
|
1,116 sq. feet
|
1 baths - beds |
show details | |

|
#8
Cranbrook Rd
Libertyville, IL 60048
|
1,792 sq. feet
|
1 baths - beds |
show details | |

|
#9
Edgewater Ct
Libertyville, IL 60048
|
3,270 sq. feet
|
2 baths - beds |
show details | |

|
#10
E Lincoln Ave
Libertyville, IL 60048
|
1,457 sq. feet
|
1 baths - beds |
show details |
| Photo | Address | Area | Beds / Baths | Price | Details |
|---|---|---|---|---|---|

|
#11
Trinity Pl
Libertyville, IL 60048
|
2,280 sq. feet
|
2 baths - beds |
show details | |

|
#12
W Arlington Dr
Libertyville, IL 60048
|
1,080 sq. feet
|
1 baths - beds |
show details | |

|
#13
N Milwaukee Ave Apt B
Libertyville, IL 60048
|
- sq. feet
|
- baths - beds |
show details | |

|
#14
W Park Ave
Libertyville, IL 60048
|
- sq. feet
|
- baths - beds |
show details | |

|
#15
Carter St
Libertyville, IL 60048
|
- sq. feet
|
- baths - beds |
show details | |

|
#16
Alexandra Dr
Libertyville, IL 60048
|
- sq. feet
|
- baths - beds |
show details | |

|
#17
W Park Ave Apt B
Libertyville, IL 60048
|
- sq. feet
|
- baths - beds |
show details | |

|
#18
W Ellis Ave Apt 11
Libertyville, IL 60048
|
- sq. feet
|
- baths - beds |
show details | |

|
#19
N Milwaukee Ave Apt 4b
Libertyville, IL 60048
|
- sq. feet
|
- baths - beds |
show details | |

|
#20
W Park Ave Apt A
Libertyville, IL 60048
|
- sq. feet
|
- baths - beds |
show details |
| Photo | Address | Area | Beds / Baths | Price | Details |
|---|---|---|---|---|---|

|
#21
Fairview Ave
Libertyville, IL 60048
|
- sq. feet
|
- baths - beds |
show details | |

|
#22
Clover Ct
Round Lake, IL 60073
|
1,682 sq. feet
|
1 baths 3 beds |
$273,000
|
show details |

|
#23
Carriage Way Dr
Arlington Heights, IL 60004
|
- sq. feet
|
2 baths 2 beds |
$179,900
|
show details |

|
#24
N 4th Ave
Des Plaines, IL 60016
|
1,381 sq. feet
|
1 baths 3 beds |
$335,000
|
show details |

|
#25
Wisconsin Ave
Barrington, IL 60010
|
1,297 sq. feet
|
2 baths 3 beds |
$499,000
|
show details |

|
#26
W Lake Shore Dr
Spring Grove, IL 60081
|
1,023 sq. feet
|
1 baths 2 beds |
$110,250
|
show details |

|
#27
Forest C 22-11
Libertyville, IL 60048
|
- sq. feet
|
- baths - beds |
show details | |

|
#28
David Pl Apt 2-G
Des Plaines, IL 60016
|
- sq. feet
|
1 baths 2 beds |
$149,900
|
show details |

|
#29
Clover Ln
Round Lake, IL 60073
|
- sq. feet
|
2 baths 3 beds |
$130,000
|
show details |

|
#30
S Sheridan Rd
Mchenry, IL 60051
|
999 sq. feet
|
1 baths 2 beds |
show details |
| Photo | Address | Area | Beds / Baths | Price | Details |
|---|---|---|---|---|---|

|
#31
S Elmhurst Rd
Mount Prospect, IL 60056
|
1,340 sq. feet
|
2 baths 3 beds |
show details | |

|
#32
Enoch Ave
Zion, IL 60099
|
1,462 sq. feet
|
2 baths 3 beds |
show details | |

|
#33
Timber Lake Dr
Antioch, IL 60002
|
3,473 sq. feet
|
3 baths 5 beds |
show details | |

|
#34
Lippincott Rd
Fox Lake, IL 60020
|
1,247 sq. feet
|
1 baths 3 beds |
show details | |

|
#35
Luke Ave
Zion, IL 60099
|
1,524 sq. feet
|
2 baths 3 beds |
show details | |

|
#36
Henley St
Glenview, IL 60025
|
3,575 sq. feet
|
2 baths 4 beds |
show details | |

|
#37
Elisha Ave
Zion, IL 60099
|
1,404 sq. feet
|
2 baths 4 beds |
show details | |

|
#38
W Tahoe Dr
Mundelein, IL 60060
|
2,849 sq. feet
|
3 baths 5 beds |
show details | |

|
#39
W Washington St
Palatine, IL 60067
|
1,040 sq. feet
|
1 baths 3 beds |
show details | |

|
#40
Park Ave
North Chicago, IL 60064
|
1,550 sq. feet
|
1 baths 3 beds |
show details |
| Photo | Address | Area | Beds / Baths | Price | Details |
|---|---|---|---|---|---|

|
#41
Lindy St
Ingleside, IL 60041
|
1,926 sq. feet
|
2 baths 3 beds |
show details | |

|
#42
Thompson Blvd
Buffalo Grove, IL 60089
|
1,670 sq. feet
|
3 baths 4 beds |
show details | |

|
#43
Lincoln St
North Chicago, IL 60064
|
1,136 sq. feet
|
1 baths 2 beds |
show details | |

|
#44
Dove St
Rolling Meadows, IL 60008
|
2,632 sq. feet
|
2 baths 3 beds |
show details | |

|
#45
Wildwood Dr
Mchenry, IL 60051
|
1,340 sq. feet
|
3 baths 2 beds |
show details | |

|
#46
Crossland Dr
Grayslake, IL 60030
|
1,562 sq. feet
|
1 baths 3 beds |
show details | |

|
#47
Otis Rd
Barrington, IL 60010
|
5,900 sq. feet
|
9 baths 7 beds |
show details | |

|
#48
N Greentree Rd
Grayslake, IL 60030
|
2,008 sq. feet
|
2 baths 4 beds |
show details | |

|
#49
Winston Dr
Schaumburg, IL 60192
|
1,379 sq. feet
|
2 baths 3 beds |
show details | |

|
Check over 1 million property listings on Foreclosure.com!
|
browse all offers | |||

Latest news about housing in Libertyville, IL collected exclusively by city-data.com from local newspapers, TV, and radio stations

 | Libertyville HS vs. Deerfield HS (80 replies) |
| Living in Vernon Hills and Visiting Libertyville (13 replies) |
| Home cooked Indian food (2 replies) |
| Lake County apartment feedback requested (5 replies) |
| top 3 areas to avoid in nw suburbs (84 replies) |
| Northern Chicago Suburbs Suggestions for House (66 replies) |
Median year apartment built: 1972
Household type by relationship:
Households: 20,439- Male householders: 4,009 (600 living alone), Female householders: 3,555 (1,143 living alone)
4,974 spouses (4,954 opposite-sex spouses), 299 unmarried partners, (299 opposite-sex unmarried partners), 6,568 children (6,277 natural, 212 adopted, 78 stepchildren), 141 grandchildren, 68 brothers or sisters, 99 parents, 0 foster children, 9 other relatives, 210 non-relatives
- In group quarters: 501
Size of family households: 2,452 2-persons, 1,140 3-persons, 1,471 4-persons, 466 5-persons, 49 6-persons, 42 7-or-more-persons.
Size of nonfamily households: 1,841 1-person, 321 2-persons, 2 3-persons, 15 5-persons.
4,497 married couples with children.
531 single-parent households (122 men, 409 women).
86.7% of residents of Libertyville speak English at home.
3.5% of residents speak Spanish at home (61% speak English very well, 30% speak English well, 5% speak English not well, 3% don't speak English at all).
5.5% of residents speak other Indo-European language at home (82% speak English very well, 12% speak English well, 5% speak English not well, 1% don't speak English at all).
2.8% of residents speak Asian or Pacific Island language at home (51% speak English very well, 30% speak English well, 13% speak English not well, 6% don't speak English at all).
0.8% of residents speak other language at home (80% speak English very well, 20% speak English well).
Foreign born population: 2,158 (10.6%)
(64.7% of them are naturalized citizens)
| Here: | 8.2 |
| State: | 6.4 |
| Here: | 4.0 |
| State: | 4.1 |
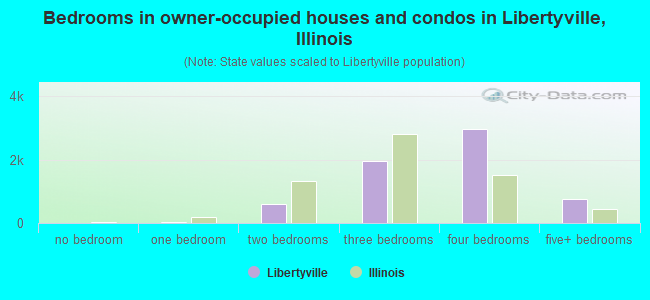
- Bedrooms in owner-occupied houses and condos in Libertyville, Illinois
- 11no bedroom
- 391 bedroom
- 5902 bedrooms
- 1,9453 bedrooms
- 2,9714 bedrooms
- 7605+ bedrooms
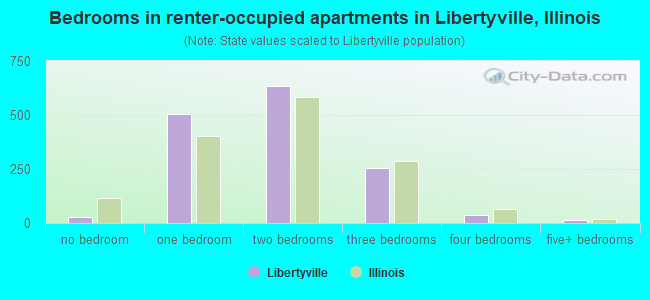
- Bedrooms in renter-occupied apartments in Libertyville, Illinois
- 26no bedroom
- 5041 bedroom
- 6342 bedrooms
- 2563 bedrooms
- 384 bedrooms
- 165+ bedrooms
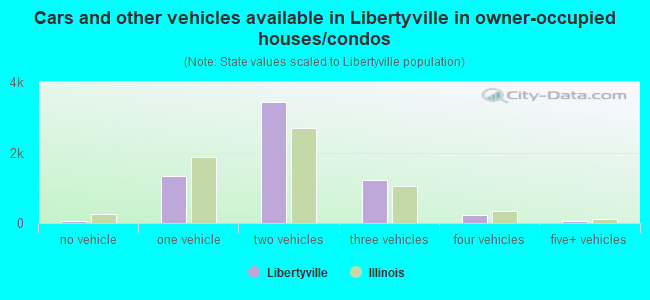
- Cars and other vehicles available in Libertyville in owner-occupied houses/condos
- 53no vehicle
- 1,3341 vehicle
- 3,4192 vehicles
- 1,2233 vehicles
- 2344 vehicles
- 525+ vehicles
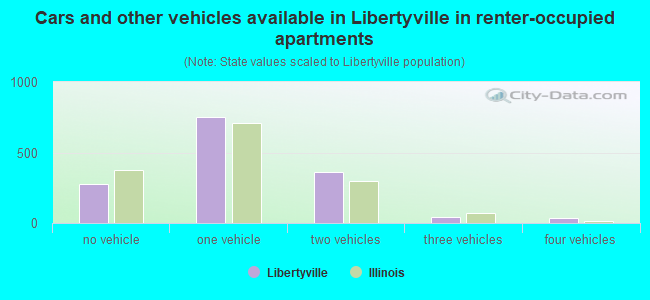
- Cars and other vehicles available in Libertyville in renter-occupied apartments
- 276no vehicle
- 7551 vehicle
- 3642 vehicles
- 453 vehicles
- 334 vehicles
- 05+ vehicles
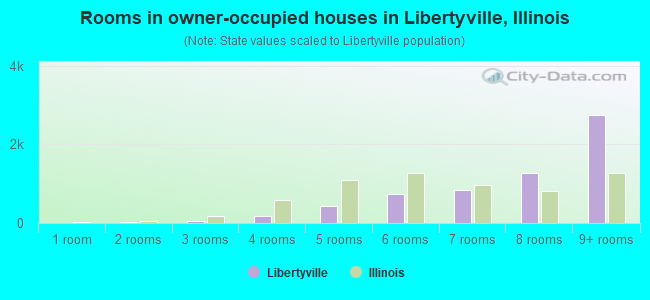
- Rooms in owner-occupied houses in Libertyville, Illinois
- 111 room
- 222 rooms
- 593 rooms
- 1894 rooms
- 4285 rooms
- 7456 rooms
- 8427 rooms
- 1,2708 rooms
- 2,7509+ rooms
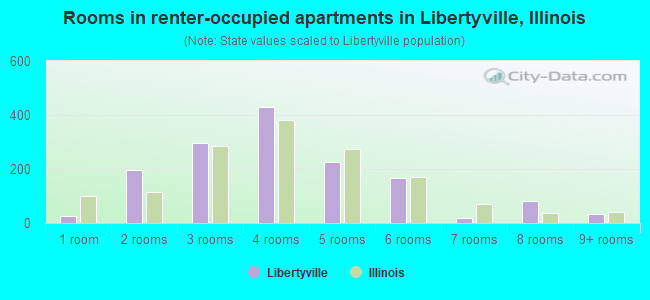
- Rooms in renter-occupied apartments in Libertyville, Illinois
- 261 room
- 1972 rooms
- 2963 rooms
- 4284 rooms
- 2255 rooms
- 1656 rooms
- 197 rooms
- 838 rooms
- 359+ rooms
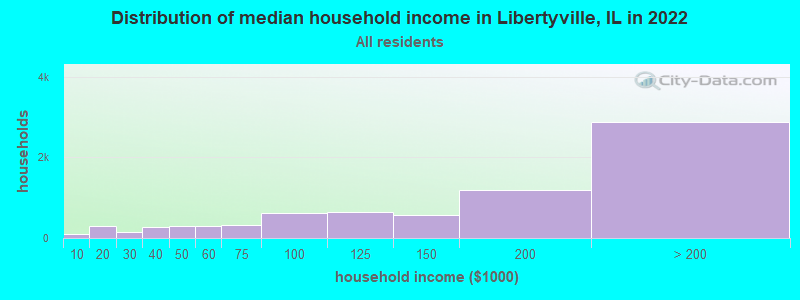
Libertyville, IL household income distribution

- 92Less than $10,000
- 296$10,000 to $19,999
- 149$20,000 to $29,999
- 278$30,000 to $39,999
- 301$40,000 to $49,999
- 298$50,000 to $59,999
- 312$60,000 to $74,999
- 617$75,000 to $99,999
- 638$100,000 to $124,999
- 567$125,000 to $149,999
- 1,197$150,000 to $199,999
- 2,880$200,000 or more
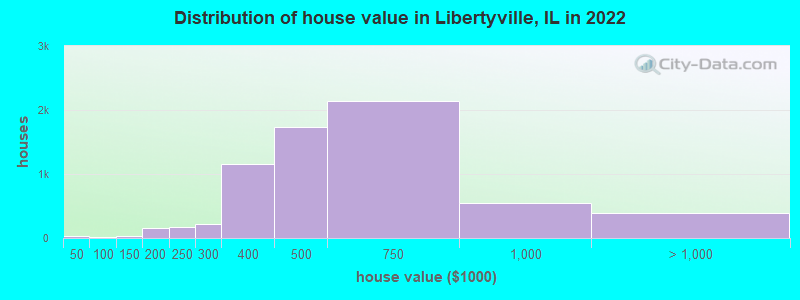
Home value of owner - occupied houses in 2022 in Libertyville, IL
-
- 30Less than $10,000
- 5$40,000 to $49,999
- 16$70,000 to $79,999
- 20$100,000 to $124,999
- 14$125,000 to $149,999
- 80$150,000 to $174,999
- 82$175,000 to $199,999
- 168$200,000 to $249,999
- 223$250,000 to $299,999
- 1,160$300,000 to $399,999
- 1,734$400,000 to $499,999
- 2,136$500,000 to $749,999
- 549$750,000 to $999,999
- 362$1,000,000 to $1,499,999
- 6$1,500,000 to $1,999,999
- 28$2,000,000 or more
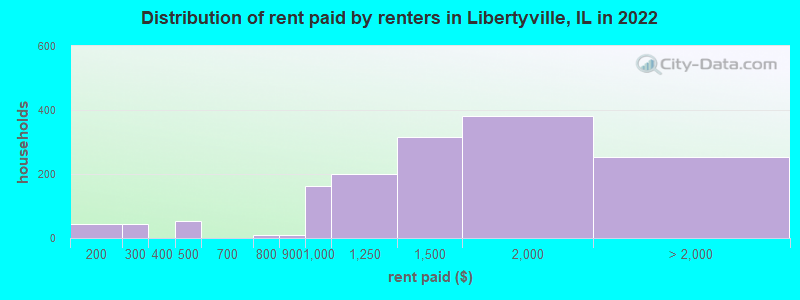
Rent paid by renters in 2022 in Libertyville, IL
-
- 44$150 to $199
- 5$200 to $249
- 37$250 to $299
- 30$400 to $449
- 21$450 to $499
- 9$700 to $749
- 7$800 to $899
- 161$900 to $999
- 199$1,000 to $1,249
- 315$1,250 to $1,499
- 380$1,500 to $1,999
- 107$2,000 to $2,499
- 33$2,500 to $2,999
- 29$3,000 to $3,499
- 3$3,500 or more
- 77No cash rent
Percentage of workers working in this county: 80.3%
Number of people working at home: 2,829 (28.2% of all workers)
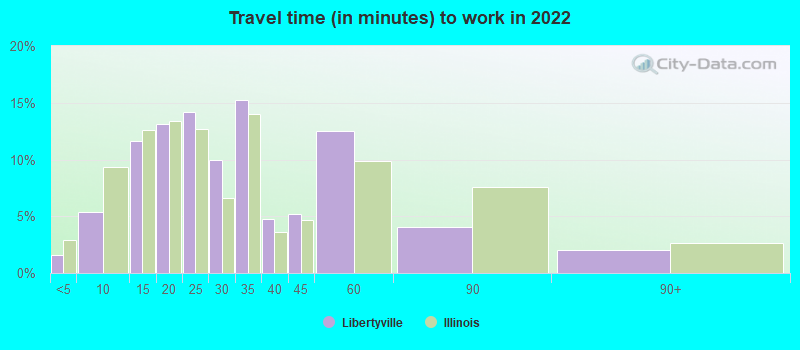
Travel time to work (commute)
- Less than 5 minutes: 183
- 5 to 9 minutes: 900
- 10 to 14 minutes: 1,102
- 15 to 19 minutes: 1,288
- 20 to 24 minutes: 905
- 25 to 29 minutes: 746
- 30 to 34 minutes: 699
- 35 to 39 minutes: 274
- 40 to 44 minutes: 280
- 45 to 59 minutes: 443
- 60 to 89 minutes: 565
- 90 or more minutes: 158
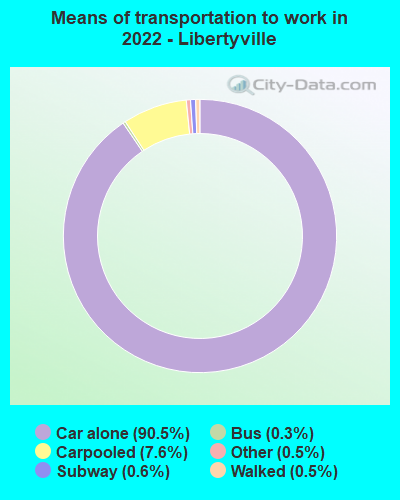
Means of transportation to work:
- Drove a car alone: 16,899 (77.3%)
- Carpooled: 1,441 (6.6%)
- Bus: 57 (0.3%)
- Subway or elevated rail: 18 (0.1%)
- Long-distance train or commuter rail: 94 (0.4%)
- Taxi: 87 (0.4%)
- Bicycle: 10 (0.0%)
- Walked: 98 (0.4%)
- Worked at home: 2,829 (12.9%)
- Unemployment by race in 2022
- Unemployment rate for White non-Hispanic residents
- 1.6%Males
- 1.6%Females
- Unemployment rate for Black residents
- 3.3%Males
- 5.9%Females
- Unemployment rate for Asian residents
- 6.4%Females
- Unemployment rate for two or more race residents
- 5.2%Males
- Unemployment rate for Hispanic or Latino residents
- 1.3%Males
- 7.4%Females
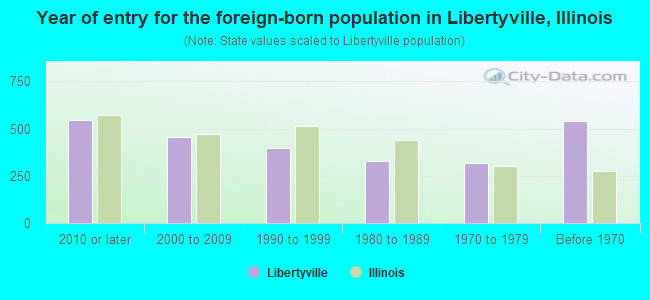
- Year of entry for the foreign-born population in Libertyville, Illinois
- 5462010 or later
- 4542000 to 2009
- 3951990 to 1999
- 3261980 to 1989
- 3171970 to 1979
- 538Before 1970
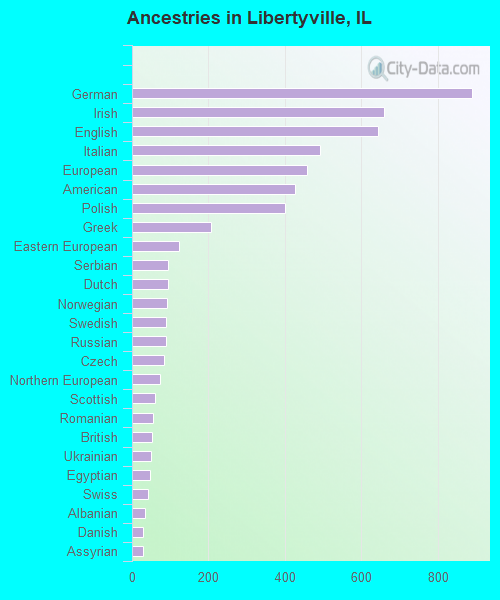
First ancestries reported:
- German: 889 (11.0%)
- Irish: 660 (8.2%)
- English: 642 (8.0%)
- Italian: 492 (6.1%)
- European: 458 (5.7%)
- American: 427 (5.3%)
- Polish: 401 (5.0%)
- Greek: 206 (2.6%)
- Eastern European: 123 (1.5%)
- Serbian: 95 (1.2%)
- Dutch: 93 (1.2%)
- Norwegian: 92 (1.1%)
- Swedish: 90 (1.1%)
- Russian: 89 (1.1%)
- Czech: 84 (1.0%)
- Northern European: 74 (0.9%)
- Scottish: 60 (0.7%)
- Romanian: 56 (0.7%)
- British: 51 (0.6%)
- Ukrainian: 50 (0.6%)
- Egyptian: 47 (0.6%)
- Swiss: 41 (0.5%)
- Albanian: 33 (0.4%)
- Danish: 29 (0.4%)
- Assyrian: 28 (0.3%)
- Scotch-Irish: 28 (0.3%)
- Lithuanian: 28 (0.3%)
- Croatian: 25 (0.3%)
- Israeli: 24 (0.3%)
- Scandinavian: 24 (0.3%)
- South African: 23 (0.3%)
- Hungarian: 22 (0.3%)
- Syrian: 22 (0.3%)
- Slovak: 21 (0.3%)
- Welsh: 20 (0.2%)
- Luxembourger: 19 (0.2%)
- Trinidadian and Tobagonian: 18 (0.2%)
- Lebanese: 17 (0.2%)
- Slovene: 16 (0.2%)
- Finnish: 15 (0.2%)
- Australian: 14 (0.2%)
- Armenian: 13 (0.2%)
- Canadian: 13 (0.2%)
- Soviet Union: 13 (0.2%)
- Jamaican: 13 (0.2%)
- Ethiopian: 12 (0.1%)
- Jordanian: 11 (0.1%)
- Nigerian: 10 (0.1%)
- Estonian: 9 (0.1%)
- French Canadian: 9 (0.1%)
- Belgian: 7 (0.09%)
- Slavic: 6 (0.07%)
Most common places of birth for foreign-born residents (%):
| Libertyville: | 14.9% (309) |
| Illinois: | 4.1% (74,364) |
| Libertyville: | 10.9% (226) |
| Illinois: | 9.2% (166,409) |
| Libertyville: | 10.7% (222) |
| Illinois: | 34.7% (626,958) |
| Libertyville: | 6.8% (141) |
| Illinois: | 1.1% (19,306) |
| Libertyville: | 3.7% (76) |
| Illinois: | 5.2% (93,003) |
| Libertyville: | 2.9% (60) |
| Illinois: | 6.9% (124,474) |
| Libertyville: | 2.7% (56) |
| Illinois: | 1.6% (29,316) |
| Libertyville: | 2.7% (56) |
| Illinois: | 2.2% (40,393) |
| Libertyville: | 2.6% (53) |
| Illinois: | 1.0% (18,753) |
| Libertyville: | 2.4% (49) |
| Illinois: | 0.4% (6,781) |
| Libertyville: | 2.2% (45) |
| Illinois: | 0.9% (16,308) |
| Libertyville: | 2.0% (42) |
| Illinois: | 0.2% (2,988) |
| Libertyville: | 2.0% (41) |
| Illinois: | 0.3% (5,016) |
| Libertyville: | 1.9% (39) |
| Illinois: | 0.3% (5,762) |
| Libertyville: | 1.8% (37) |
| Illinois: | 0.3% (4,938) |
| Libertyville: | 1.7% (36) |
| Illinois: | 0.8% (14,736) |
| Libertyville: | 1.6% (33) |
| Illinois: | 0.5% (8,778) |
Place of birth for U.S.-born residents:
- This state: 11,366
- Other state: 6,574
- Northeast: 1,267
- Midwest: 2,896
- South: 1,110
- West: 1,247
86.7% of Libertyville residents lived in the same house 1 years ago.
Out of people who lived in different houses, 38.1% lived in this county.
Out of people who lived in different counties, 54.8% lived in Illinois.
| Libertyville: | 86.7% |
| State average: | 88.3% |
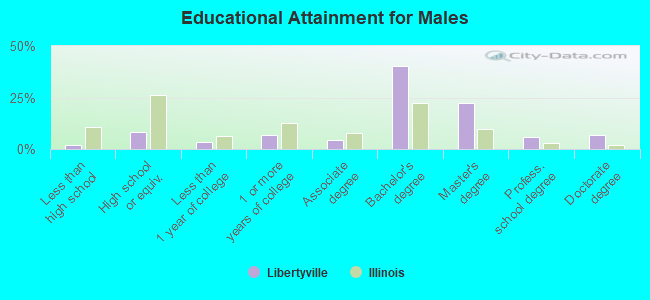
Education attainment for males 25 years and older:
- No schooling: 34
- Nursery to 4th grade: 10
- 5th and 6th grade: 0
- 7th and 8th grade: 26
- 9th grade: 23
- 10th grade: 0
- 11th grade: 0
- 12th grade, no diploma: 55
- High school graduate (or equivalency): 565
- Less than 1 year of college: 252
- Some college more than 1 year, no degree: 456
- Associate degree: 299
- Bachelor's degree: 2,788
- Master's degree: 1,553
- Professional school degree: 390
- Doctorate degree: 470
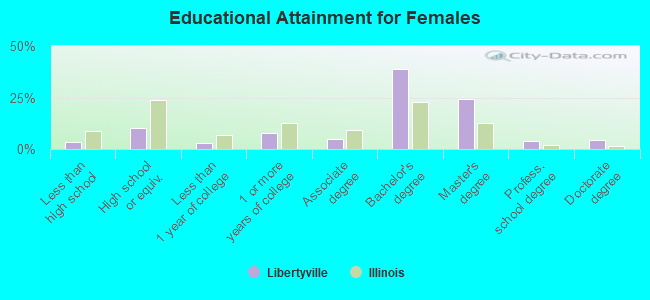
Education attainment for females 25 years and older:
- No schooling: 42
- Nursery to 4th grade: 17
- 5th and 6th grade: 13
- 7th and 8th grade: 42
- 9th grade: 0
- 10th grade: 0
- 11th grade: 42
- 12th grade, no diploma: 91
- High school graduate (or equivalency): 727
- Less than 1 year of college: 198
- Some college more than 1 year, no degree: 564
- Associate degree: 352
- Bachelor's degree: 2,816
- Master's degree: 1,771
- Professional school degree: 292
- Doctorate degree: 317
Housing units in structures:
- One, detached: 5,500
- One, attached: 672
- Two: 213
- 3 or 4: 234
- 5 to 9: 253
- 10 to 19: 276
- 20 to 49: 256
- 50 or more: 519
- Mobile homes: 16
Housing units lacking complete kitchen facilities in 2022: 0.2%
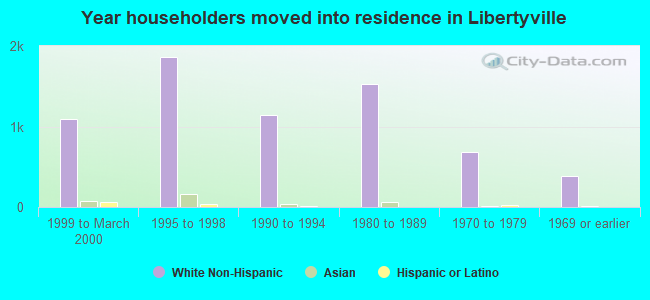
House/condo owner moved in on average 10 years ago
Renter moved in on average 2 years ago
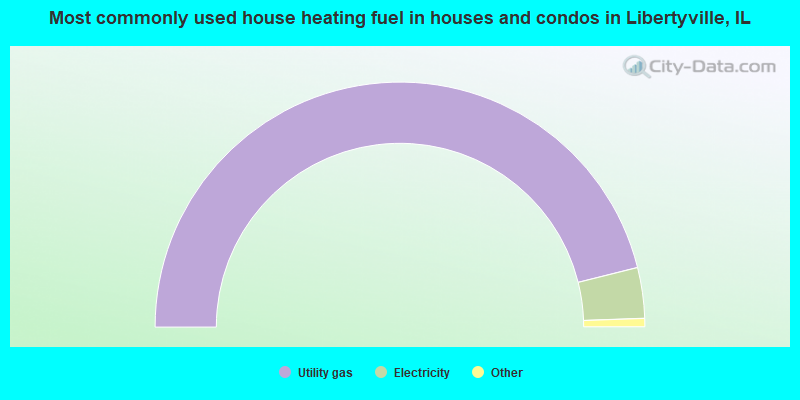
- 92.2%Utility gas
- 6.7%Electricity
- 0.9%Bottled, tank, or LP gas
- 0.2%Wood
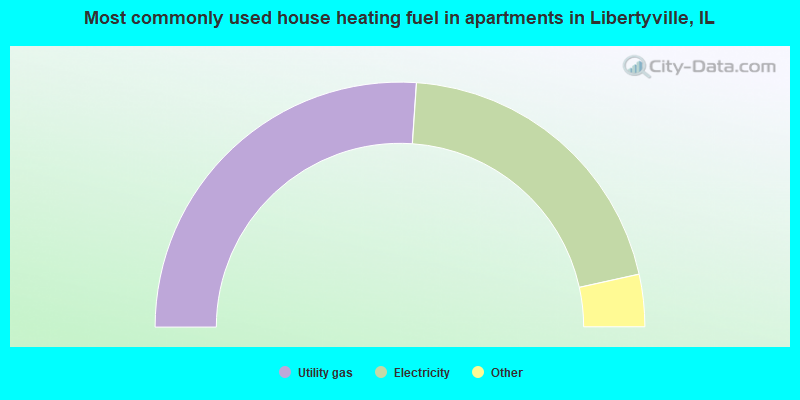
- 52.2%Utility gas
- 41.0%Electricity
- 2.9%Bottled, tank, or LP gas
- 2.5%Other fuel
- 0.9%No fuel used
- 0.5%Wood
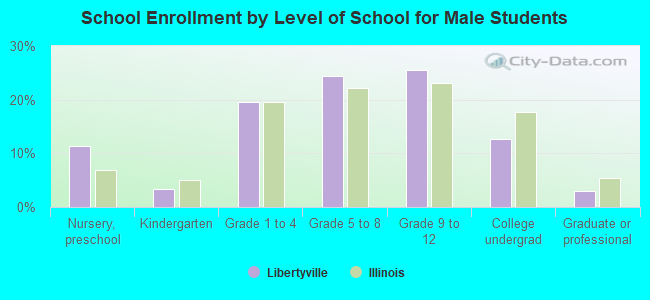
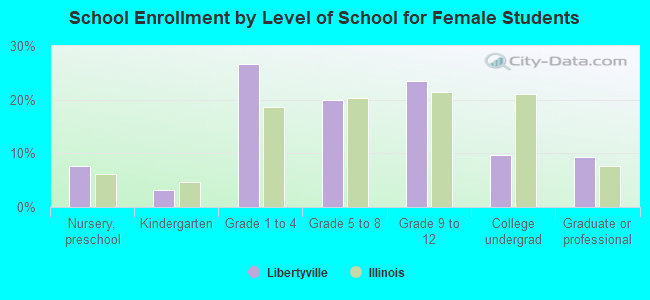
Private vs. public school enrollment:
| Here: | 11.2% |
| Illinois: | 13.3% |
| Here: | 13.8% |
| Illinois: | 9.9% |
| Here: | 10.6% |
| Illinois: | 27.4% |