Housing density: 787 houses/condos per square mile
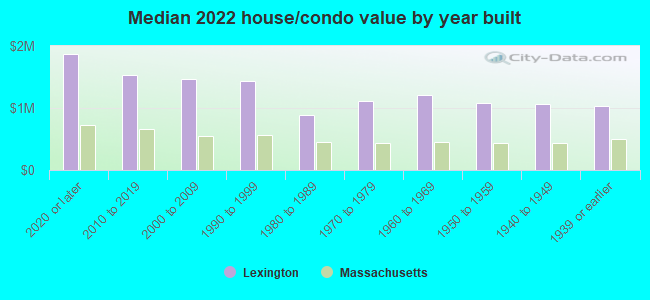
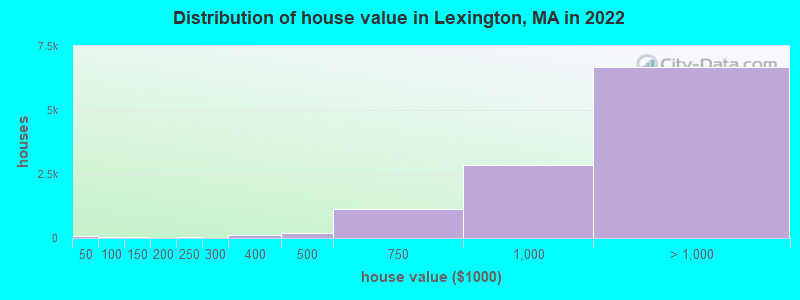
Median price asked for vacant for-sale houses and condos in 2022: $2,861,249.
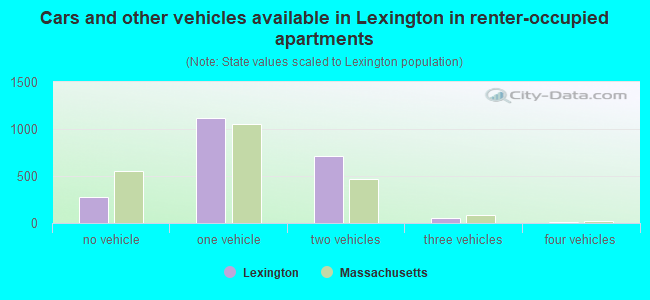
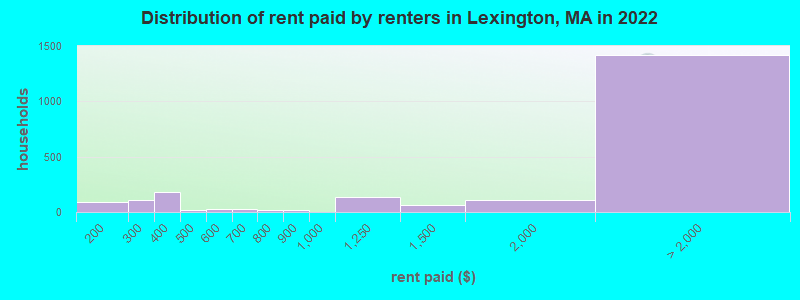
Median contract rent in 2022: over $2,000 (lower quartile is $1,178, upper quartile is over $2,000)
Median rent asked for vacant for-rent units in 2022: $4,620
Median gross rent in Lexington, MA in 2022: over $2,000
Housing units in Lexington with a mortgage: 6,188 (1,164 second mortgage, 28 home equity loan, 1,058 both second mortgage and home equity loan) Houses without a mortgage: 188
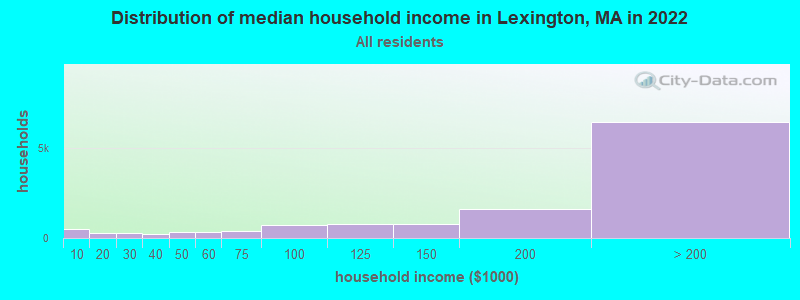
Median household income for houses/condos with a mortgage: $243,233
Median household income for apartments without a mortgage: $173,139
Median monthly housing costs: $3,260
Compare current foreclosures near Lexington, MA:
#1
Sunny Knoll Ave
Lexington, MA 02421
1,726
sq. feet
2
baths
3
beds
#2
Solomon Pierce Rd
Lexington, MA 02420
6,483
sq. feet
5
baths
5
beds
#3
Solomon Pierce Rd
Lexington, MA 02420
4,536
sq. feet
5
baths
6
beds
#4
Taft Ave
Lexington, MA 02421
1,616
sq. feet
2
baths
3
beds
#5
Katahdin Dr
Lexington, MA 02421
-
sq. feet
-
baths
-
beds
#6
Lowell St
Lexington, MA 02420
-
sq. feet
-
baths
-
beds
#7
$650,000
Boyd St
Boston, MA 02124
3,970
sq. feet
3
baths
9
beds
#8
$418,000
Stillman St
Framingham, MA 01702
1,122
sq. feet
1
baths
2
beds
#9
Church St
Boston, MA 02122
3,663
sq. feet
3
baths
6
beds
#10
Belvoir Rd
Milton, MA 02186
2,528
sq. feet
2
baths
4
beds
#11
Margin Street
Lynn, MA 01905
1,240
sq. feet
2
baths
2
beds
#12
Fenwick St
Revere, MA 02151
2,080
sq. feet
1
baths
3
beds
#13
Tobey Ln
Wakefield, MA 01880
3,240
sq. feet
2
baths
4
beds
#14
Ballou St
Quincy, MA 02169
1,758
sq. feet
1
baths
3
beds
#15
Vernal St
Everett, MA 02149
2,601
sq. feet
2
baths
5
beds
#16
3rd Ave
North Chelmsford, MA 01863
-
sq. feet
1
baths
2
beds
#17
Eastern Ave
Malden, MA 02148
2,288
sq. feet
3
baths
4
beds
#18
Grv St
Needham, MA 02492
6,542
sq. feet
4
baths
6
beds
#19
Essex St
Swampscott, MA 01907
2,029
sq. feet
2
baths
3
beds
#20
Thomas St
Jamaica Plain, MA 02130
1,990
sq. feet
2
baths
2
beds
#21
Richmond St
Boston, MA 02124
2,516
sq. feet
2
baths
4
beds
#22
Aiken Ave Apt 15
Lowell, MA 01850
1,100
sq. feet
1
baths
2
beds
#23
Harvard St
Lowell, MA 01851
2,676
sq. feet
2
baths
4
beds
#24
Bower St
Medford, MA 02155
2,323
sq. feet
2
baths
4
beds
#25
Gilbert Rd
Needham, MA 02492
1,778
sq. feet
2
baths
3
beds
#26
Crestway Rd
Boston, MA 02128
1,370
sq. feet
2
baths
4
beds
#27
Savin Hill Avenue, Unit 2 190 Savin Hill Avenue Condominium
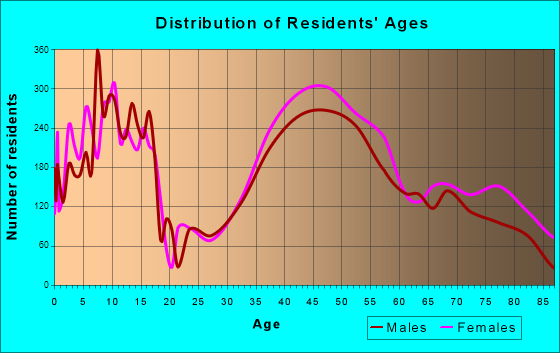
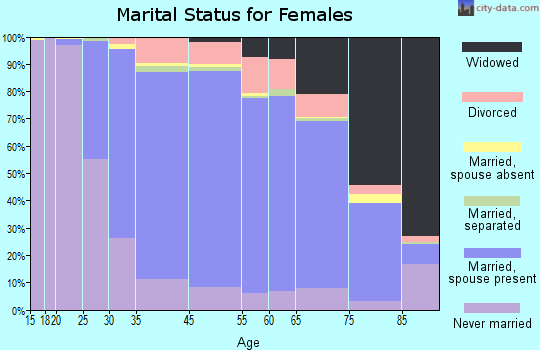
7,541 married couples with children.
936 single-parent households (418 men, 518 women).
60.6% of residents of Lexington speak English at home.
2.2% of residents speak Spanish at home (78% speak English very well, 20% speak English well, 1% speak English not well, 2% don't speak English at all).
13.8% of residents speak other Indo-European language at home (90% speak English very well, 8% speak English well, 2% speak English not well).
21.7% of residents speak Asian or Pacific Island language at home (75% speak English very well, 12% speak English well, 10% speak English not well, 3% don't speak English at all).
2.9% of residents speak other language at home (94% speak English very well, 6% speak English well, 1% speak English not well).
Foreign born population: 11,641 (34.1%)
(63.1% of them are naturalized citizens)
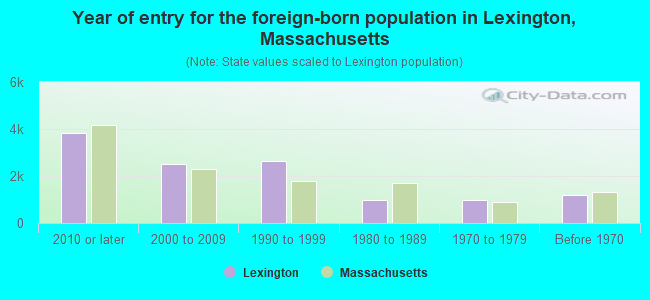
Year of entry for the foreign-born population in Lexington, Massachusetts
3,8222010 or later
2,5232000 to 2009
2,6531990 to 1999
9901980 to 1989
9891970 to 1979
1,182Before 1970
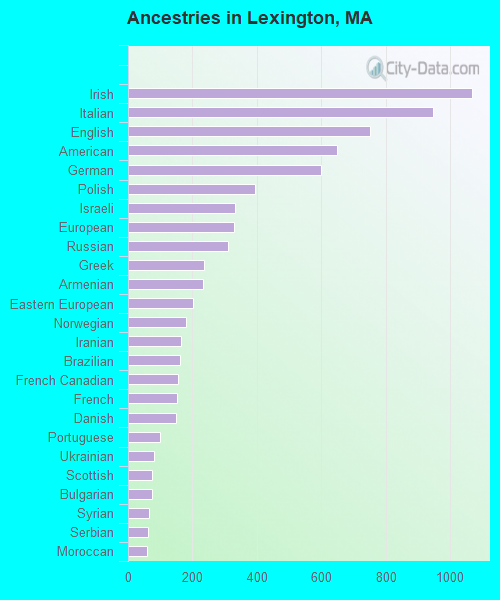
First ancestries reported:
Irish: 1,068 (5.5%)
Italian: 948 (4.9%)
English: 751 (3.9%)
American: 650 (3.4%)
German: 599 (3.1%)
Polish: 396 (2.1%)
Israeli: 332 (1.7%)
European: 328 (1.7%)
Russian: 311 (1.6%)
Greek: 237 (1.2%)
Armenian: 234 (1.2%)
Eastern European: 201 (1.0%)
Norwegian: 181 (0.9%)
Iranian: 164 (0.9%)
Brazilian: 161 (0.8%)
French Canadian: 156 (0.8%)
French: 151 (0.8%)
Danish: 148 (0.8%)
Portuguese: 100 (0.5%)
Ukrainian: 80 (0.4%)
Scottish: 76 (0.4%)
Bulgarian: 76 (0.4%)
Syrian: 64 (0.3%)
Serbian: 62 (0.3%)
Moroccan: 60 (0.3%)
Northern European: 55 (0.3%)
African: 53 (0.3%)
Jordanian: 52 (0.3%)
Canadian: 50 (0.3%)
New Zealander: 49 (0.3%)
Scotch-Irish: 44 (0.2%)
Welsh: 44 (0.2%)
Albanian: 42 (0.2%)
Lithuanian: 41 (0.2%)
Lebanese: 41 (0.2%)
Hungarian: 40 (0.2%)
Turkish: 33 (0.2%)
Finnish: 32 (0.2%)
Swedish: 31 (0.2%)
Jamaican: 27 (0.1%)
Cypriot: 24 (0.1%)
Czech: 23 (0.1%)
Cape Verdean: 23 (0.1%)
Swiss: 23 (0.1%)
Dutch: 20 (0.1%)
Nigerian: 19 (0.10%)
Belgian: 16 (0.08%)
Austrian: 15 (0.08%)
British: 13 (0.07%)
Romanian: 11 (0.06%)
Scandinavian: 8 (0.04%)
Slovak: 5 (0.03%)
Most common places of birth for foreign-born residents (%):
China, excluding Hong Kong and Taiwan
Lexington:
26.6% (3,098)
Massachusetts:
8.4% (103,233)
India
Lexington:
17.5% (2,038)
Massachusetts:
6.8% (82,934)
Korea
Lexington:
5.0% (577)
Massachusetts:
1.4% (17,613)
Israel
Lexington:
4.4% (508)
Massachusetts:
0.5% (6,073)
Taiwan
Lexington:
3.2% (370)
Massachusetts:
0.7% (8,270)
Hong Kong
Lexington:
3.0% (353)
Massachusetts:
0.7% (8,536)
Armenia
Lexington:
2.7% (309)
Massachusetts:
0.2% (2,307)
Canada
Lexington:
2.5% (293)
Massachusetts:
2.3% (28,158)
Russia
Lexington:
2.3% (268)
Massachusetts:
1.5% (18,278)
Japan
Lexington:
1.9% (223)
Massachusetts:
0.6% (7,301)
Brazil
Lexington:
1.9% (219)
Massachusetts:
7.6% (92,959)
Mexico
Lexington:
1.8% (207)
Massachusetts:
1.1% (13,065)
Place of birth for U.S.-born residents:
This state: 12,127
Other state: 9,965
Northeast: 4,799
Midwest: 1,904
South: 1,691
West: 1,509
86.3% of Lexington residents lived in the same house 1 years ago. Out of people who lived in different houses, 35.0% lived in this county. Out of people who lived in different counties, 51.6% lived in Massachusetts.
Lexington:
86.3%
State average:
87.7%
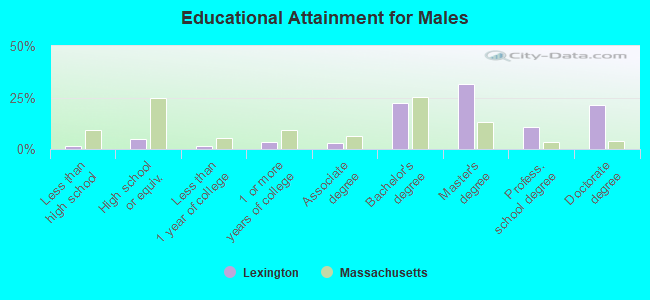
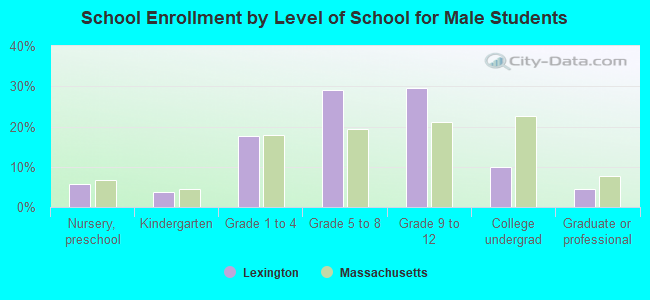
Education attainment for males 25 years and older:
No schooling: 8
Nursery to 4th grade: 0
5th and 6th grade: 7
7th and 8th grade: 10
9th grade: 9
10th grade: 4
11th grade: 75
12th grade, no diploma: 42
High school graduate (or equivalency): 559
Less than 1 year of college: 155
Some college more than 1 year, no degree: 365
Associate degree: 356
Bachelor's degree: 2,542
Master's degree: 3,637
Professional school degree: 1,242
Doctorate degree: 2,429
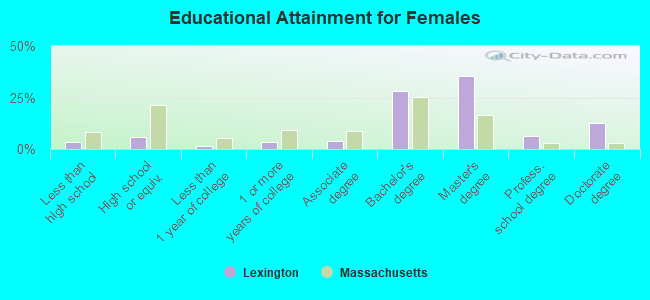
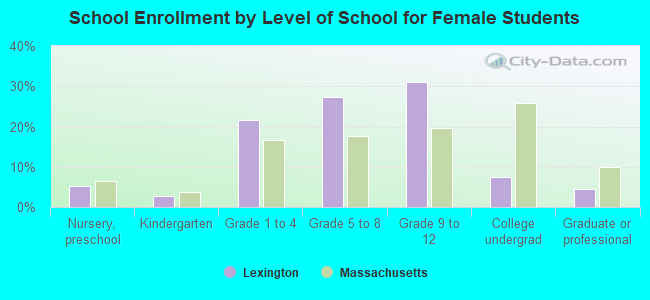
Education attainment for females 25 years and older:
No schooling: 30
Nursery to 4th grade: 23
5th and 6th grade: 13
7th and 8th grade: 101
9th grade: 93
10th grade: 19
11th grade: 5
12th grade, no diploma: 111
High school graduate (or equivalency): 723
Less than 1 year of college: 170
Some college more than 1 year, no degree: 434
Associate degree: 486
Bachelor's degree: 3,512
Master's degree: 4,370
Professional school degree: 770
Doctorate degree: 1,551
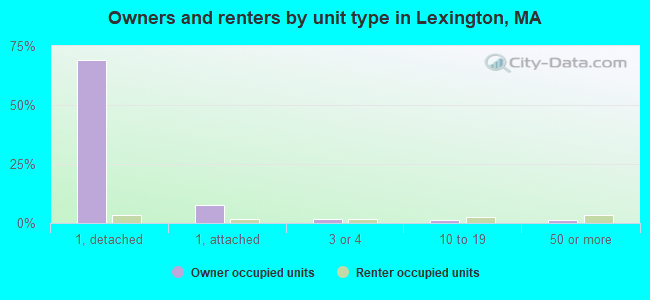
Housing units in structures:
One, detached: 9,477
One, attached: 1,102
Two: 248
3 or 4: 384
5 to 9: 297
10 to 19: 486
20 to 49: 316
50 or more: 595
Housing units lacking complete plumbing facilities in 2022: 0.8%
Housing units lacking complete kitchen facilities in 2022: 1.8%
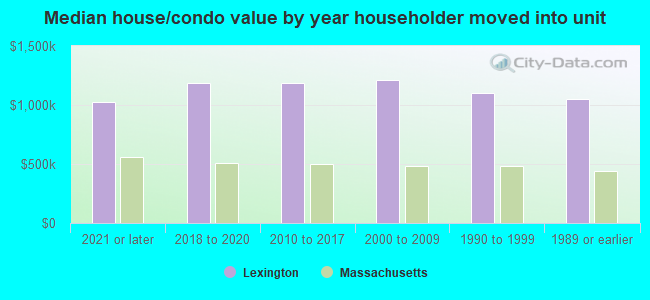
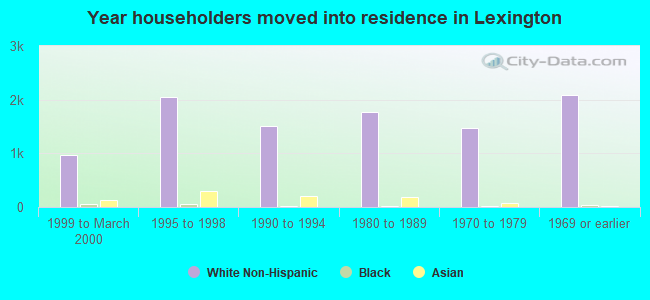
House/condo owner moved in on average 13 years ago