Lexington, IL (Illinois) Houses and Residents
| Lexington: | $169,345 |
| Illinois: | $251,600 |
Total population: 2,068 (Urban population: 0, Rural population: 1,922 (3 farm, 1,919 nonfarm))
Houses: 919 (855 occupied: 723 owner occupied, 131 renter occupied)
| % of renters here: | 15% |
| State: | 33% |
Housing density: 875 houses/condos per square mile
Median price asked for vacant for-sale houses and condos in 2022: $341,799.
Median contract rent in 2022: $646 (lower quartile is $607, upper quartile is $694)
Median rent asked for vacant for-rent units in 2022: $676
Median gross rent in Lexington, IL in 2022: $770
Housing units in Lexington with a mortgage: 361 (27 second mortgage, 0 home equity loan, 25 both second mortgage and home equity loan)
Houses without a mortgage: 45
Median household income for houses/condos with a mortgage: $86,996
Median household income for apartments without a mortgage: $94,314
Median monthly housing costs: $894
Compare current foreclosures near Lexington, IL:
| Photo | Address | Area | Beds / Baths | Price | Details |
|---|---|---|---|---|---|

|
#1
W Walnut St
Lexington, IL 61753
|
956 sq. feet
|
1 baths - beds |
show details | |

|
#2
Rainbow Bridge Rd
Lexington, IL 61753
|
1,036 sq. feet
|
1 baths - beds |
show details | |

|
#3
Anvil Dr
Lexington, IL 61753
|
- sq. feet
|
- baths - beds |
show details | |

|
#4
N Lee St
Lexington, IL 61753
|
- sq. feet
|
- baths - beds |
show details | |

|
#5
S Prairie St
Bloomington, IL 61701
|
1,544 sq. feet
|
1 baths 3 beds |
show details | |

|
#6
Rowe Dr
Bloomington, IL 61701
|
1,188 sq. feet
|
3 baths 3 beds |
show details | |

|
#7
W Monroe St
Bloomington, IL 61701
|
758 sq. feet
|
1 baths 2 beds |
show details | |

|
#8
E 1st St
El Paso, IL 61738
|
1,930 sq. feet
|
3 baths 6 beds |
show details | |

|
#9
W Monroe St
Towanda, IL 61776
|
1,163 sq. feet
|
1 baths - beds |
show details | |

|
#10
Rebecca Ln
Normal, IL 61761
|
1,074 sq. feet
|
- baths 3 beds |
show details |
| Photo | Address | Area | Beds / Baths | Price | Details |
|---|---|---|---|---|---|

|
#11
Bull St
Normal, IL 61761
|
1,086 sq. feet
|
- baths 3 beds |
show details | |

|
#12
Livingston St
Gridley, IL 61744
|
1,381 sq. feet
|
1 baths - beds |
show details | |

|
#13
N Ford St
Gridley, IL 61744
|
864 sq. feet
|
1 baths - beds |
show details | |

|
#14
S Fell Ave
Normal, IL 61761
|
1,930 sq. feet
|
- baths 3 beds |
show details | |

|
#15
Hovey Ave
Normal, IL 61761
|
1,013 sq. feet
|
- baths 3 beds |
show details | |

|
#16
Labrador Ln
Normal, IL 61761
|
2,243 sq. feet
|
- baths 5 beds |
show details | |

|
#17
N Linden St
Normal, IL 61761
|
1,524 sq. feet
|
- baths 3 beds |
show details | |

|
#18
Abercorn St
Normal, IL 61761
|
2,069 sq. feet
|
- baths 4 beds |
show details | |

|
#19
Walton Pl
Normal, IL 61761
|
2,170 sq. feet
|
- baths 3 beds |
show details | |

|
#20
Belview Ave
Normal, IL 61761
|
1,020 sq. feet
|
- baths 4 beds |
show details |
| Photo | Address | Area | Beds / Baths | Price | Details |
|---|---|---|---|---|---|

|
#21
S Jackson St
Flanagan, IL 61740
|
2,596 sq. feet
|
- baths 5 beds |
show details | |

|
#22
Parktrail Rd
Normal, IL 61761
|
1,344 sq. feet
|
- baths 3 beds |
show details | |

|
#23
E Sycamore St
Normal, IL 61761
|
2,884 sq. feet
|
- baths 4 beds |
show details | |

|
#24
E 3000 North Rd
Chenoa, IL 61726
|
1,898 sq. feet
|
1 baths - beds |
show details | |

|
#25
N Grove St
Normal, IL 61761
|
1,514 sq. feet
|
- baths 3 beds |
show details | |

|
#26
Partridge Pt
Normal, IL 61761
|
1,856 sq. feet
|
- baths 3 beds |
show details | |

|
#27
Inez Ln
Normal, IL 61761
|
1,826 sq. feet
|
- baths 3 beds |
show details | |

|
#28
Ironwood Cc Dr
Normal, IL 61761
|
2,971 sq. feet
|
- baths 4 beds |
show details | |

|
#29
E North St
Colfax, IL 61728
|
1,296 sq. feet
|
2 baths - beds |
show details | |

|
#30
Fieldcrest Ct
Normal, IL 61761
|
1,326 sq. feet
|
- baths 2 beds |
show details |
| Photo | Address | Area | Beds / Baths | Price | Details |
|---|---|---|---|---|---|

|
#31
Tompkins Dr
Normal, IL 61761
|
1,304 sq. feet
|
- baths 3 beds |
show details | |

|
#32
Highpoint Rd
Normal, IL 61761
|
1,141 sq. feet
|
- baths 3 beds |
show details | |

|
#33
Currie Ct
Bloomington, IL 61704
|
3,177 sq. feet
|
3 baths - beds |
show details | |

|
#34
N Monroe St
Flanagan, IL 61740
|
1,248 sq. feet
|
- baths 3 beds |
show details | |

|
#35
N 1000 East Rd
Pontiac, IL 61764
|
1,740 sq. feet
|
- baths 3 beds |
show details | |

|
#36
N Towanda Ave
Normal, IL 61761
|
2,052 sq. feet
|
- baths 3 beds |
show details | |

|
#37
N East St
Hudson, IL 61748
|
1,294 sq. feet
|
1 baths - beds |
show details | |

|
#38
Arcadia Dr
Bloomington, IL 61704
|
- sq. feet
|
- baths - beds |
show details | |

|
#39
S Sycamore St
El Paso, IL 61738
|
- sq. feet
|
- baths - beds |
show details | |

|
#40
Rhodes Ln
Bloomington, IL 61704
|
- sq. feet
|
- baths - beds |
show details |
| Photo | Address | Area | Beds / Baths | Price | Details |
|---|---|---|---|---|---|

|
#41
Revolutionary Sq Apt 2
Bloomington, IL 61704
|
- sq. feet
|
- baths - beds |
show details | |

|
#42
Pier Way Apt 2
Bloomington, IL 61704
|
- sq. feet
|
- baths - beds |
show details | |

|
#43
W Market St Apt 2
Bloomington, IL 61701
|
- sq. feet
|
- baths - beds |
show details | |

|
#44
E Jefferson St Apt 5
Bloomington, IL 61701
|
- sq. feet
|
- baths - beds |
show details | |

|
#45
W South St
Ellsworth, IL 61737
|
- sq. feet
|
- baths - beds |
show details | |

|
#46
Orlando Ave
Normal, IL 61761
|
- sq. feet
|
- baths - beds |
show details | |

|
#47
Eastland Dr
Bloomington, IL 61704
|
- sq. feet
|
- baths - beds |
show details | |

|
#48
Hillview Dr Apt 4
Normal, IL 61761
|
- sq. feet
|
- baths - beds |
show details | |

|
#49
Orlando Ave Apt D
Normal, IL 61761
|
- sq. feet
|
- baths - beds |
show details | |

|
Check over 1 million property listings on Foreclosure.com!
|
browse all offers | |||

Latest news about housing in Lexington, IL collected exclusively by city-data.com from local newspapers, TV, and radio stations

 | Why are homes so overpriced in the Chicago suburbs? (41 replies) |
| Where are the nice homes in Chicago? (356 replies) |
| A lot of Bridgeport Single Family Homes being built this summer (96 replies) |
| What areas to invest in for real estate? (155 replies) |
| Thinking of moving to Illinois (77 replies) |
| Moving to IL - is there any future? (202 replies) |

Median year apartment built: 1969
Household type by relationship:
Households: 2,106- Male householders: 470 (102 living alone), Female householders: 378 (97 living alone)
483 spouses (479 opposite-sex spouses), 19 unmarried partners, (19 opposite-sex unmarried partners), 628 children (582 natural, 15 adopted, 29 stepchildren), 47 grandchildren, 0 brothers or sisters, 13 parents, 0 foster children, 0 other relatives, 62 non-relatives
Size of family households: 294 2-persons, 102 3-persons, 96 4-persons, 51 5-persons, 18 6-persons, 7 7-or-more-persons.
Size of nonfamily households: 224 1-person, 44 2-persons.
381 married couples with children.
95 single-parent households (17 men, 78 women).
96.4% of residents of Lexington speak English at home.
1.8% of residents speak Spanish at home (51% speak English very well, 31% speak English well, 9% speak English not well, 9% don't speak English at all).
0.6% of residents speak other Indo-European language at home (100% speak English very well).
0.4% of residents speak other language at home (62% speak English very well, 38% speak English well).
Foreign born population: 40 (1.9%)
(62.5% of them are naturalized citizens)
| Here: | 6.7 |
| State: | 6.4 |
| Here: | 4.3 |
| State: | 4.1 |

- Bedrooms in owner-occupied houses and condos in Lexington, Illinois
- 0no bedroom
- 111 bedroom
- 692 bedrooms
- 3983 bedrooms
- 2244 bedrooms
- 205+ bedrooms

- Bedrooms in renter-occupied apartments in Lexington, Illinois
- 14no bedroom
- 211 bedroom
- 602 bedrooms
- 113 bedrooms
- 254 bedrooms
- 05+ bedrooms

- Cars and other vehicles available in Lexington in owner-occupied houses/condos
- 10no vehicle
- 1971 vehicle
- 3202 vehicles
- 1353 vehicles
- 454 vehicles
- 165+ vehicles

- Cars and other vehicles available in Lexington in renter-occupied apartments
- 13no vehicle
- 401 vehicle
- 682 vehicles
- 03 vehicles
- 104 vehicles
- 05+ vehicles

- Rooms in owner-occupied houses in Lexington, Illinois
- 01 room
- 02 rooms
- 213 rooms
- 54 rooms
- 785 rooms
- 1866 rooms
- 1937 rooms
- 1288 rooms
- 1129+ rooms

- Rooms in renter-occupied apartments in Lexington, Illinois
- 141 room
- 62 rooms
- 153 rooms
- 314 rooms
- 295 rooms
- 246 rooms
- 07 rooms
- 68 rooms
- 69+ rooms


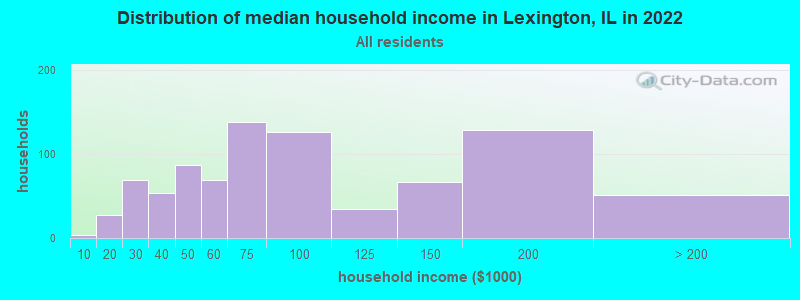
Lexington, IL household income distribution

- 4Less than $10,000
- 27$10,000 to $19,999
- 69$20,000 to $29,999
- 54$30,000 to $39,999
- 87$40,000 to $49,999
- 69$50,000 to $59,999
- 138$60,000 to $74,999
- 126$75,000 to $99,999
- 34$100,000 to $124,999
- 67$125,000 to $149,999
- 128$150,000 to $199,999
- 51$200,000 or more
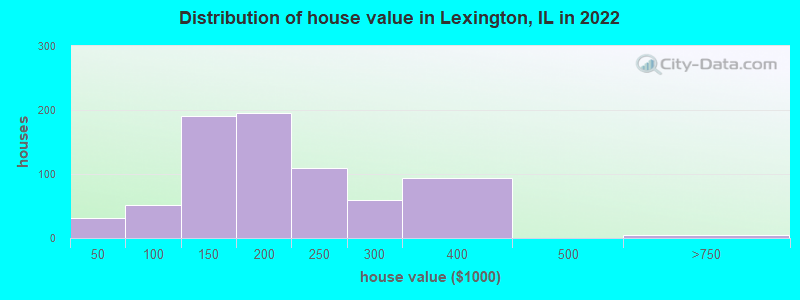
Home value of owner - occupied houses in 2022 in Lexington, IL
-
- 13Less than $10,000
- 15$15,000 to $19,999
- 3$40,000 to $49,999
- 15$50,000 to $59,999
- 7$70,000 to $79,999
- 13$80,000 to $89,999
- 11$90,000 to $99,999
- 100$100,000 to $124,999
- 89$125,000 to $149,999
- 150$150,000 to $174,999
- 45$175,000 to $199,999
- 110$200,000 to $249,999
- 59$250,000 to $299,999
- 92$300,000 to $399,999
- 4$500,000 to $749,999
Rent paid by renters in 2022 in Lexington, IL
-
- 6$150 to $199
- 5$300 to $349
- 4$450 to $499
- 12$550 to $599
- 30$600 to $649
- 9$650 to $699
- 28$700 to $749
- 13$1,000 to $1,249
- 5$1,500 to $1,999


Percentage of workers working in this county: 79.0%
Number of people working at home: 204 (18.9% of all workers)
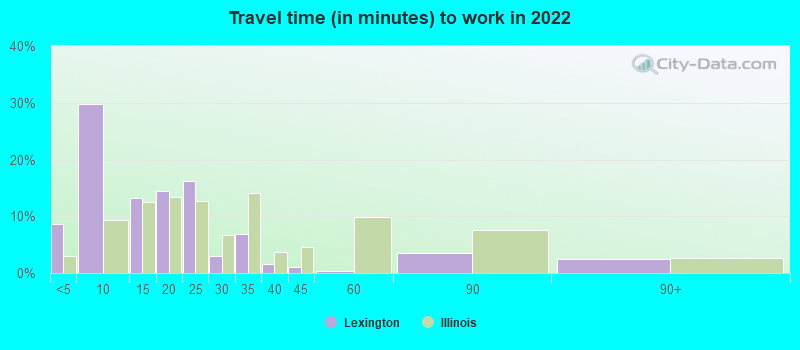
Travel time to work (commute)
- Less than 5 minutes: 10
- 5 to 9 minutes: 66
- 10 to 14 minutes: 29
- 15 to 19 minutes: 62
- 20 to 24 minutes: 170
- 25 to 29 minutes: 132
- 30 to 34 minutes: 298
- 35 to 39 minutes: 2
- 40 to 44 minutes: 40
- 45 to 59 minutes: 25
- 60 to 89 minutes: 32
- 90 or more minutes: 57
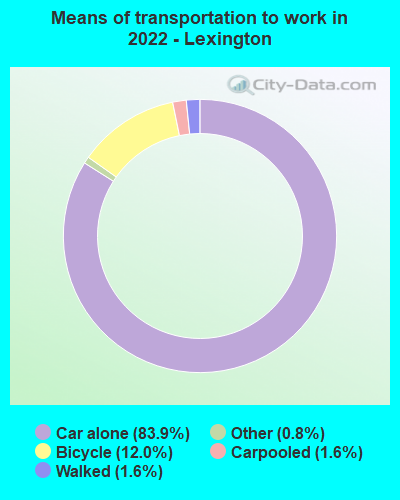
Means of transportation to work:
- Drove a car alone: 396 (62.4%)
- Carpooled: 6 (0.9%)
- Taxi: 2 (0.3%)
- Bicycle: 89 (14.0%)
- Walked: 7 (1.1%)
- Worked at home: 204 (32.1%)

- Unemployment by race in 2022
- Unemployment rate for White non-Hispanic residents
- 1.2%Males
- 3.4%Females
- Unemployment rate for Hispanic or Latino residents
- 6.4%Females

- Year of entry for the foreign-born population in Lexington, Illinois
- 02010 or later
- 172000 to 2009
- 211990 to 1999
- 01980 to 1989
- 01970 to 1979
- 7Before 1970

First ancestries reported:
- German: 319 (27.8%)
- Irish: 297 (25.9%)
- English: 243 (21.2%)
- American: 153 (13.3%)
- Greek: 40 (3.5%)
- Dutch: 16 (1.4%)
- Italian: 10 (0.9%)
- Swedish: 9 (0.8%)
- Welsh: 8 (0.7%)
- Belgian: 7 (0.6%)
- Norwegian: 5 (0.4%)
- Scottish: 5 (0.4%)
- French: 4 (0.3%)
- Scotch-Irish: 4 (0.3%)
- British: 3 (0.3%)
- European: 3 (0.3%)
- Polish: 2 (0.2%)
Most common places of birth for foreign-born residents (%):
| Lexington: | 45.7% (21) |
| Illinois: | 34.7% (626,958) |
| Lexington: | 28.3% (13) |
| Illinois: | 2.2% (40,393) |
| Lexington: | 8.7% (4) |
| Illinois: | 0.2% (4,414) |
Place of birth for U.S.-born residents:
- This state: 1,865
- Other state: 195
- Northeast: 21
- Midwest: 146
- South: 26
- West: 6
92.0% of Lexington residents lived in the same house 1 years ago.
Out of people who lived in different houses, 29.5% lived in this county.
Out of people who lived in different counties, 82.9% lived in Illinois.
| Lexington: | 92.0% |
| State average: | 88.3% |
Education attainment for males 25 years and older:
- No schooling: 0
- Nursery to 4th grade: 4
- 5th and 6th grade: 0
- 7th and 8th grade: 0
- 9th grade: 0
- 10th grade: 15
- 11th grade: 16
- 12th grade, no diploma: 0
- High school graduate (or equivalency): 250
- Less than 1 year of college: 64
- Some college more than 1 year, no degree: 54
- Associate degree: 37
- Bachelor's degree: 192
- Master's degree: 25
- Professional school degree: 12
- Doctorate degree: 4

Education attainment for females 25 years and older:
- No schooling: 5
- Nursery to 4th grade: 3
- 5th and 6th grade: 8
- 7th and 8th grade: 0
- 9th grade: 0
- 10th grade: 4
- 11th grade: 0
- 12th grade, no diploma: 0
- High school graduate (or equivalency): 240
- Less than 1 year of college: 48
- Some college more than 1 year, no degree: 129
- Associate degree: 49
- Bachelor's degree: 174
- Master's degree: 30
- Professional school degree: 73
- Doctorate degree: 0


Housing units in structures:
- One, detached: 728
- One, attached: 35
- Two: 32
- 3 or 4: 60
- 5 to 9: 9
- Mobile homes: 54
Median worth of mobile homes: $12,126
Housing units lacking complete kitchen facilities in 2022: 3.0%
House/condo owner moved in on average 8 years ago
Renter moved in on average 5 years ago

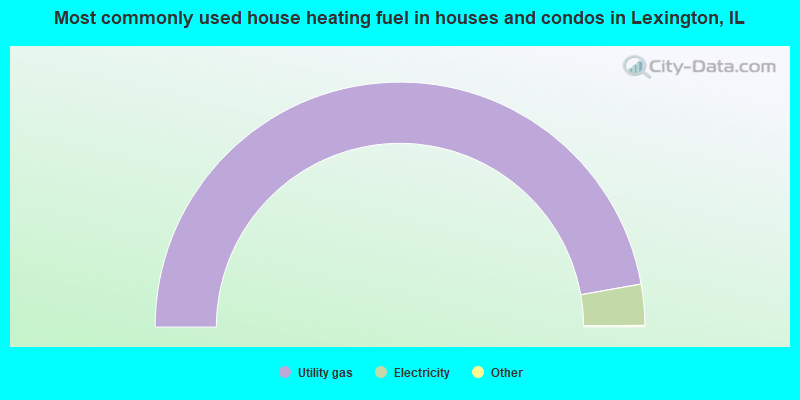
- 94.6%Utility gas
- 5.4%Electricity
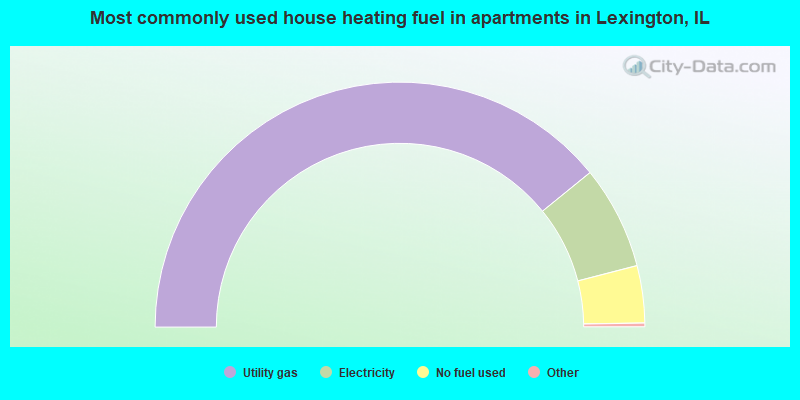
- 78.6%Utility gas
- 13.7%Electricity
- 7.6%No fuel used
Private vs. public school enrollment:
| Here: | 15.1% |
| Illinois: | 13.3% |
| Here: | 0.0% |
| Illinois: | 9.9% |
| Here: | 19.3% |
| Illinois: | 27.4% |


