Leverett, MA (Massachusetts) Houses and Residents
| Leverett: | $445,094 |
| Massachusetts: | $534,700 |
Total population: 1,851 (Urban population: 0, Rural population: 1,663 (17 farm, 1,646 nonfarm))
Houses: 648 (632 occupied: 506 owner occupied, 126 renter occupied)
| % of renters here: | 20% |
| State: | 38% |
Housing density: 28 houses/condos per square mile
Median price asked for vacant for-sale houses and condos in 2022 in this county: $191,319.
Median contract rent in 2022: $1,262 (lower quartile is $752, upper quartile is $1,879)
Median rent asked for vacant for-rent units in 2022: $963
Median gross rent in Leverett, MA in 2022: $1,492
Housing units in Leverett with a mortgage: 234 (20 second mortgage, 51 home equity loan, 2 both second mortgage and home equity loan)
Houses without a mortgage: 118
Compare current foreclosures near Leverett, MA:
| Photo | Address | Area | Beds / Baths | Price | Details |
|---|---|---|---|---|---|

|
#1
Lampblack Rd
Greenfield, MA 01301
|
2,078 sq. feet
|
1 baths 3 beds |
$369,900
|
show details |

|
#2
Route 2
Shelburne Falls, MA 01370
|
- sq. feet
|
3 baths 6 beds |
$229,900
|
show details |

|
#3
J St
Turners Falls, MA 01376
|
3,256 sq. feet
|
2 baths 7 beds |
show details | |

|
#4
Priestly Farms Rd
South Hadley, MA 01075
|
3,795 sq. feet
|
4 baths 4 beds |
show details | |

|
#5
N Orange Rd
Athol, MA 01331
|
950 sq. feet
|
1 baths 3 beds |
show details | |

|
#6
Sabans Rd
Conway, MA 01341
|
1,246 sq. feet
|
2 baths 3 beds |
show details | |

|
#7
Hillcrest Dr
Bernardston, MA 01337
|
1,120 sq. feet
|
1 baths 3 beds |
show details | |

|
#8
Daniel Shays Hwy
Athol, MA 01331
|
1,736 sq. feet
|
2 baths 4 beds |
show details | |

|
#9
Chauncey Walker St
Belchertown, MA 01007
|
1,768 sq. feet
|
1 baths 3 beds |
show details | |

|
#10
Rogers Ave
Orange, MA 01364
|
1,296 sq. feet
|
1 baths 3 beds |
show details |
| Photo | Address | Area | Beds / Baths | Price | Details |
|---|---|---|---|---|---|

|
#11
Kennebunk St
Athol, MA 01331
|
3,518 sq. feet
|
2 baths 4 beds |
show details | |

|
#12
Ella St
Athol, MA 01331
|
1,026 sq. feet
|
1 baths 2 beds |
show details | |

|
#13
Briggs Rd
Shutesbury, MA 01072
|
1,434 sq. feet
|
1 baths 3 beds |
show details | |

|
#14
Myrtle St # 1
Northampton, MA 01060
|
2,222 sq. feet
|
2 baths 4 beds |
show details | |

|
#15
White Pond Rd
Athol, MA 01331
|
2,340 sq. feet
|
2 baths 5 beds |
show details | |

|
#16
Aldrich St
Granby, MA 01033
|
624 sq. feet
|
1 baths 3 beds |
show details | |

|
#17
Westbrook Rd
South Hadley, MA 01075
|
1,048 sq. feet
|
1 baths 3 beds |
show details | |

|
#18
Eddy St
Orange, MA 01364
|
1,116 sq. feet
|
1 baths 2 beds |
show details | |

|
#19
N Main St, Unit A
Orange, MA 01364
|
598 sq. feet
|
1 baths 2 beds |
show details | |

|
#20
Alvord Pl
South Hadley, MA 01075
|
1,358 sq. feet
|
3 baths 3 beds |
show details |
| Photo | Address | Area | Beds / Baths | Price | Details |
|---|---|---|---|---|---|

|
#21
Maplecrest Dr
Belchertown, MA 01007
|
1,685 sq. feet
|
2 baths 4 beds |
show details | |

|
#22
E River St
Orange, MA 01364
|
1,332 sq. feet
|
1 baths 3 beds |
show details | |

|
#23
Main St
Athol, MA 01331
|
1,236 sq. feet
|
1 baths 3 beds |
show details | |

|
#24
Bald Mountain Rd
Bernardston, MA 01337
|
918 sq. feet
|
1 baths 2 beds |
show details | |

|
#25
Plumtree Rd
Sunderland, MA 01375
|
1,536 sq. feet
|
2 baths 2 beds |
show details | |

|
#26
East Rd
Orange, MA 01364
|
960 sq. feet
|
1 baths 3 beds |
show details | |

|
#27
Cahillane Ter
Florence, MA 01062
|
1,388 sq. feet
|
1 baths 3 beds |
show details | |

|
#28
Main St
Northfield, MA 01360
|
6,076 sq. feet
|
2 baths 9 beds |
show details | |

|
#29
Everett St
Athol, MA 01331
|
1,080 sq. feet
|
1 baths 3 beds |
show details | |

|
#30
Charden Ln
Athol, MA 01331
|
1,200 sq. feet
|
1 baths 3 beds |
show details |
| Photo | Address | Area | Beds / Baths | Price | Details |
|---|---|---|---|---|---|

|
#31
Mill Valley Rd
Belchertown, MA 01007
|
1,596 sq. feet
|
1 baths 3 beds |
show details | |

|
#32
Chestnut St
Athol, MA 01331
|
1,503 sq. feet
|
2 baths 4 beds |
show details | |

|
#33
Helen Ln
Belchertown, MA 01007
|
2,567 sq. feet
|
2 baths 4 beds |
show details | |

|
#34
South St
Athol, MA 01331
|
1,135 sq. feet
|
1 baths 3 beds |
show details | |

|
#35
Cahillane Ter
Florence, MA 01062
|
1,388 sq. feet
|
1 baths 3 beds |
show details | |

|
#36
Oak Ave
Athol, MA 01331
|
1,362 sq. feet
|
2 baths 4 beds |
show details | |

|
#37
Boyle Rd
Northfield, MA 01354
|
1,500 sq. feet
|
2 baths 3 beds |
show details | |

|
#38
Leonard St
Athol, MA 01331
|
2,542 sq. feet
|
2 baths 4 beds |
show details | |

|
#39
W State St
Granby, MA 01033
|
1,333 sq. feet
|
2 baths 3 beds |
show details | |

|
#40
Brierwood Dr
Florence, MA 01062
|
960 sq. feet
|
1 baths 3 beds |
show details |
| Photo | Address | Area | Beds / Baths | Price | Details |
|---|---|---|---|---|---|

|
#41
Chesterfield Rd
Easthampton, MA 01027
|
3,977 sq. feet
|
2 baths 6 beds |
show details | |

|
#42
Central St
Athol, MA 01331
|
1,397 sq. feet
|
2 baths 3 beds |
show details | |

|
#43
Howard St
Belchertown, MA 01007
|
960 sq. feet
|
1 baths 3 beds |
show details | |

|
#44
Park St
Athol, MA 01331
|
1,000 sq. feet
|
1 baths 2 beds |
show details | |

|
#45
Riceville Rd
Athol, MA 01331
|
1,304 sq. feet
|
2 baths 3 beds |
show details | |

|
#46
Prescott Ln
Orange, MA 01364
|
2,064 sq. feet
|
2 baths 3 beds |
show details | |

|
#47
New Plain Rd
Northfield, MA 01360
|
2,370 sq. feet
|
2 baths 2 beds |
show details | |

|
#48
Jennifer Dr
Granby, MA 01033
|
1,132 sq. feet
|
1 baths 3 beds |
show details | |

|
#49
Breezy Ln
Granby, MA 01033
|
918 sq. feet
|
2 baths 2 beds |
show details | |

|
Check over 1 million property listings on Foreclosure.com!
|
browse all offers | |||
Latest news about housing in Leverett, MA collected exclusively by city-data.com from local newspapers, TV, and radio stations

 | How Much Massachusetts Households Make Per Year: Census Data (37 replies) |
| Estate In Leverett (6 replies) |
| 2023 Real Estate Observations (5278 replies) |
| What Is Yankee Culture? (61 replies) |
| Pioneer Valley: Wood Stoves + Well/Spring Water? (31 replies) |
| To What Extent does Yankee Culture still exist in New England (87 replies) |

Household type by relationship:
Households: 69,891- In family households: 54,236 (12,210 male householders, 6,107 female householders)
13,655 spouses, 17,750 children (16,448 natural, 543 adopted, 759 stepchildren), 917 grandchildren, 418 brothers or sisters, 464 parents, foster children, 409 other relatives, 1,987 non-relatives
- In nonfamily households: 15,655 (5,446 male householders (3,978 living alone)), 6,699 female householders (5,318 living alone)), 3,510 nonrelatives
- In group quarters: 1,481 (665 institutionalized population)
11,122 married couples with children.
4,422 single-parent households (1,025 men, 3,397 women).
94.2% of residents of Leverett speak English at home.
1.4% of residents speak Spanish at home (78% speak English very well, 9% speak English well, 13% speak English not well).
3.1% of residents speak other Indo-European language at home (70% speak English very well, 8% speak English well, 18% speak English not well, 4% don't speak English at all).
0.9% of residents speak Asian or Pacific Island language at home (53% speak English very well, 47% speak English not well).
0.3% of residents speak other language at home (100% speak English very well).
Foreign born population: 151 (9.2%)
(33.8% of them are naturalized citizens)
| Here: | 6.4 |
| State: | 6.5 |
| Here: | 4.0 |
| State: | 4.0 |

- Bedrooms in owner-occupied houses and condos in Leverett, Massachusetts
- 2no bedroom
- 181 bedroom
- 1032 bedrooms
- 2283 bedrooms
- 1214 bedrooms
- 345+ bedrooms

- Bedrooms in renter-occupied apartments in Leverett, Massachusetts
- 11no bedroom
- 81 bedroom
- 492 bedrooms
- 403 bedrooms
- 164 bedrooms
- 25+ bedrooms

- Cars and other vehicles available in Leverett in owner-occupied houses/condos
- 4no vehicle
- 1341 vehicle
- 2622 vehicles
- 783 vehicles
- 234 vehicles
- 55+ vehicles

- Cars and other vehicles available in Leverett in renter-occupied apartments
- 10no vehicle
- 441 vehicle
- 492 vehicles
- 173 vehicles
- 64 vehicles
- 05+ vehicles

- Rooms in owner-occupied houses in Leverett, Massachusetts
- 21 room
- 22 rooms
- 73 rooms
- 304 rooms
- 765 rooms
- 1096 rooms
- 1027 rooms
- 818 rooms
- 979+ rooms

- Rooms in renter-occupied apartments in Leverett, Massachusetts
- 111 room
- 52 rooms
- 83 rooms
- 344 rooms
- 225 rooms
- 276 rooms
- 107 rooms
- 38 rooms
- 69+ rooms


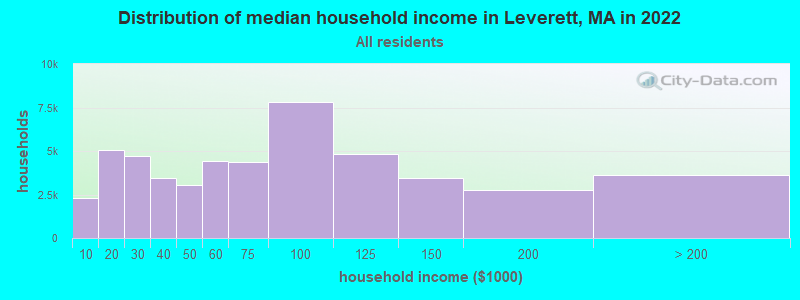
Leverett, MA household income distribution

- 2,304Less than $10,000
- 5,051$10,000 to $19,999
- 4,728$20,000 to $29,999
- 3,451$30,000 to $39,999
- 3,021$40,000 to $49,999
- 4,415$50,000 to $59,999
- 4,378$60,000 to $74,999
- 7,797$75,000 to $99,999
- 4,804$100,000 to $124,999
- 3,466$125,000 to $149,999
- 2,786$150,000 to $199,999
- 3,628$200,000 or more
Percentage of workers working in this county: 37.4%
Number of people working at home: 194 (18.4% of all workers)
Travel time to work (commute)
- Less than 5 minutes: 20
- 5 to 9 minutes: 41
- 10 to 14 minutes: 145
- 15 to 19 minutes: 182
- 20 to 24 minutes: 166
- 25 to 29 minutes: 43
- 30 to 34 minutes: 92
- 35 to 39 minutes: 27
- 40 to 44 minutes: 17
- 45 to 59 minutes: 41
- 60 to 89 minutes: 29
- 90 or more minutes: 25
Means of transportation to work:
- Drove a car alone: 746 (80.0%)
- Carpooled: 55 (5.9%)
- Subway or elevated: 3 (0.3%)
- Railroad: 1 (0.1%)
- Bicycle: 4 (0.4%)
- Walked: 16 (1.7%)
- Other means: 3 (0.3%)
- Worked at home: 105 (11.3%)


- Year of entry for the foreign-born population in Leverett, Massachusetts
- 271995 to March 2000
- 91990 to 1994
- 91985 to 1989
- 111980 to 1984
- 01975 to 1979
- 81970 to 1974
- 111965 to 1969
- 22Before 1965

First ancestries reported:
- English: 357 (16.7%)
- Other: 308 (14.4%)
- Irish: 240 (11.2%)
- German: 223 (10.4%)
- Polish: 130 (6.1%)
- Italian: 121 (5.6%)
- French: 110 (5.1%)
- United States: 102 (4.8%)
- Russian: 86 (4.0%)
- Scottish: 75 (3.5%)
- French Canadian: 74 (3.5%)
- Scotch-Irish: 50 (2.3%)
- Swedish: 50 (2.3%)
- Hungarian: 39 (1.8%)
- Dutch: 38 (1.8%)
- Welsh: 27 (1.3%)
- Lithuanian: 24 (1.1%)
- Norwegian: 16 (0.7%)
- Swiss: 16 (0.7%)
- Subsaharan African: 11 (0.5%)
- Arab: 8 (0.4%)
- Czech: 8 (0.4%)
- West Indian: 8 (0.4%)
- Greek: 7 (0.3%)
- Danish: 6 (0.3%)
- Ukrainian: 5 (0.2%)
- Portuguese: 3 (0.1%)
Most common places of birth for foreign-born residents (%):
| Leverett: | 15.5% (15) |
| Massachusetts: | 3.3% (25,403) |
| Leverett: | 14.4% (14) |
| Massachusetts: | 1.9% (14,883) |
| Leverett: | 12.4% (12) |
| Massachusetts: | 1.0% (7,867) |
| Leverett: | 11.3% (11) |
| Massachusetts: | 0.3% (2,242) |
| Leverett: | 8.2% (8) |
| Massachusetts: | 5.2% (40,247) |
| Leverett: | 7.2% (7) |
| Massachusetts: | 1.6% (12,350) |
| Leverett: | 5.2% (5) |
| Massachusetts: | 1.8% (13,801) |
| Leverett: | 4.1% (4) |
| Massachusetts: | 2.3% (17,987) |
| Leverett: | 3.1% (3) |
| Massachusetts: | 0.3% (2,642) |
| Leverett: | 2.1% (2) |
| Massachusetts: | 0.3% (2,135) |
| Leverett: | 2.1% (2) |
| Massachusetts: | 0.4% (3,051) |
| Leverett: | 2.1% (2) |
| Massachusetts: | 0.8% (5,895) |
| Leverett: | 2.1% (2) |
| Massachusetts: | 1.7% (13,456) |
| Leverett: | 2.1% (2) |
| Massachusetts: | 0.4% (3,319) |
| Leverett: | 2.1% (2) |
| Massachusetts: | 0.7% (5,693) |
| Leverett: | 2.1% (2) |
| Massachusetts: | 0.2% (1,855) |
| Leverett: | 2.1% (2) |
| Massachusetts: | 0.4% (3,066) |
Place of birth for U.S.-born residents:
- This state: 845
- Other state: 691
- Northeast: 399
- Midwest: 113
- South: 103
- West: 76
69% of Leverett residents lived in the same house 5 years ago.
Out of people who lived in different houses, 32% lived in this county.
Out of people who lived in different counties, 73% lived in Massachusetts.
Education attainment for males 25 years and older:
- No schooling: 2
- Nursery to 4th grade: 0
- 5th and 6th grade: 0
- 7th and 8th grade: 0
- 9th grade: 7
- 10th grade: 8
- 11th grade: 12
- 12th grade, no diploma: 11
- High school graduate (or equivalency): 78
- Less than 1 year of college: 22
- Some college more than 1 year, no degree: 50
- Associate degree: 21
- Bachelor's degree: 118
- Master's degree: 88
- Professional school degree: 31
- Doctorate degree: 122

Education attainment for females 25 years and older:
- No schooling: 3
- Nursery to 4th grade: 0
- 5th and 6th grade: 0
- 7th and 8th grade: 2
- 9th grade: 10
- 10th grade: 2
- 11th grade: 3
- 12th grade, no diploma: 4
- High school graduate (or equivalency): 68
- Less than 1 year of college: 22
- Some college more than 1 year, no degree: 41
- Associate degree: 33
- Bachelor's degree: 130
- Master's degree: 156
- Professional school degree: 36
- Doctorate degree: 61


Housing units in structures:
- One, detached: 532
- One, attached: 22
- Two: 52
- 3 or 4: 3
- 5 to 9: 8
- Mobile homes: 28
- Boats, RVs, vans, etc.: 3
Median worth of mobile homes: $127,475
Housing units lacking complete kitchen facilities: 1.1%

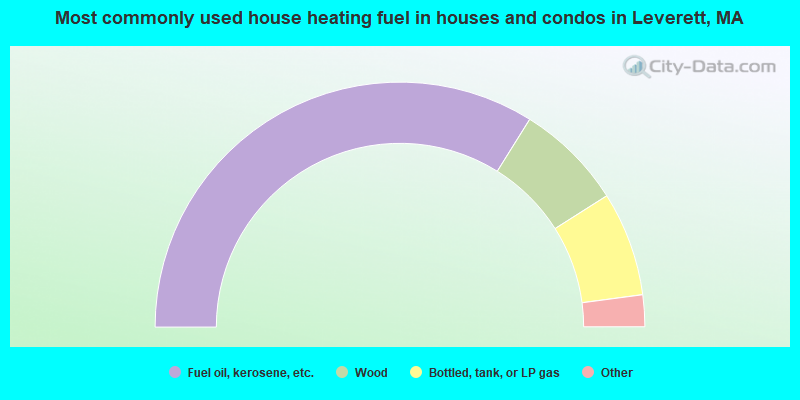
- 67.8%Fuel oil, kerosene, etc.
- 14.2%Wood
- 13.8%Bottled, tank, or LP gas
- 3.8%Electricity
- 0.4%Coal or coke
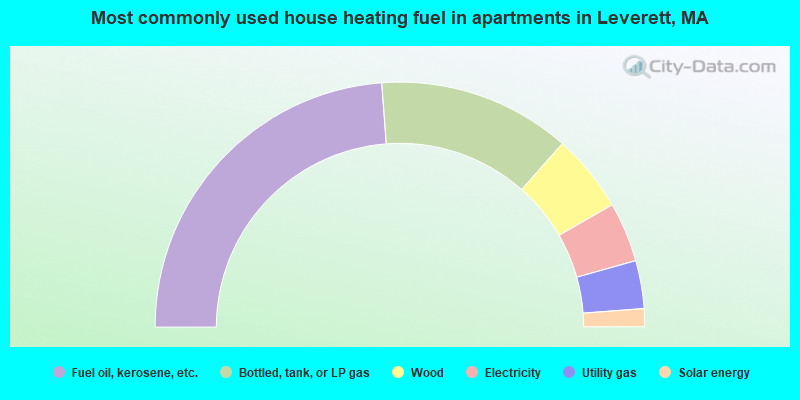
- 47.6%Fuel oil, kerosene, etc.
- 25.4%Bottled, tank, or LP gas
- 10.3%Wood
- 7.9%Electricity
- 6.3%Utility gas
- 2.4%Solar energy
Private vs. public school enrollment:
| Here: | 6.8% |
| Massachusetts: | 10.8% |
| Here: | 7.7% |
| Massachusetts: | 12.2% |
| Here: | 14.6% |
| Massachusetts: | 48.2% |


