Leslie, MI (Michigan) Houses and Residents
| Leslie: | $129,890 |
| Michigan: | $224,400 |
Mean price in 2022:
Detached houses: $142,469
Here: $142,469 State: $280,038 Mobile homes: $20,038
Here: $20,038 State: $72,868
Total population: 1,857 (Urban population: 0, Rural population: 2,040 (all nonfarm))
Houses: 842 (770 occupied: 613 owner occupied, 170 renter occupied)
| % of renters here: | 22% |
| State: | 27% |
Housing density: 633 houses/condos per square mile
Median price asked for vacant for-sale houses and condos in 2022: $318,084.
Median contract rent in 2022: $657 (lower quartile is $542, upper quartile is $751)
Median rent asked for vacant for-rent units in 2022: $705
Median gross rent in Leslie, MI in 2022: $831
Housing units in Leslie with a mortgage: 366 (14 second mortgage, 0 home equity loan, 14 both second mortgage and home equity loan)
Houses without a mortgage: 4
Median household income for houses/condos with a mortgage: $83,994
Median household income for apartments without a mortgage: $54,352
Median monthly housing costs: $909
Compare current foreclosures near Leslie, MI:
| Photo | Address | Area | Beds / Baths | Price | Details |
|---|---|---|---|---|---|

|
#1
Wright Rd
Leslie, MI 49251
|
- sq. feet
|
- baths - beds |
show details | |

|
#2
Potter Rd
Leslie, MI 49251
|
- sq. feet
|
- baths - beds |
show details | |

|
#3
Broadcrest Rd
Jackson, MI 49203
|
1,365 sq. feet
|
1 baths 3 beds |
$238,000
|
show details |

|
#4
Tomlinson Rd
Mason, MI 48854
|
1,456 sq. feet
|
2 baths 3 beds |
$408,500
|
show details |

|
#5
Brogan Rd
Stockbridge, MI 49285
|
2,098 sq. feet
|
2 baths 3 beds |
$409,900
|
show details |

|
#6
Dart Rd
Mason, MI 48854
|
1,118 sq. feet
|
2 baths 4 beds |
$296,500
|
show details |

|
#7
W Palmer Ave
Jackson, MI 49203
|
1,574 sq. feet
|
1 baths 2 beds |
$37,500
|
show details |

|
#8
Franklin St
Leslie, MI 49251
|
- sq. feet
|
- baths - beds |
show details | |

|
#9
Olds Rd
Leslie, MI 49251
|
- sq. feet
|
- baths - beds |
show details | |

|
#10
Washington St
Leslie, MI 49251
|
- sq. feet
|
- baths - beds |
show details |
| Photo | Address | Area | Beds / Baths | Price | Details |
|---|---|---|---|---|---|

|
#11
Mcneal St
Jackson, MI 49203
|
- sq. feet
|
1 baths 4 beds |
$79,769
|
show details |

|
#12
E Michigan Ave
Jackson, MI 49201
|
2,109 sq. feet
|
2 baths 3 beds |
show details | |

|
#13
S Gorham St
Jackson, MI 49203
|
1,768 sq. feet
|
2 baths 6 beds |
show details | |

|
#14
Valencia Blvd
Lansing, MI 48911
|
1,039 sq. feet
|
2 baths 3 beds |
show details | |

|
#15
17th St
Jackson, MI 49203
|
1,255 sq. feet
|
1 baths 2 beds |
show details | |

|
#16
Andrew Ave
Jackson, MI 49202
|
1,166 sq. feet
|
1 baths 3 beds |
show details | |

|
#17
4th St
Jackson, MI 49203
|
- sq. feet
|
2 baths 5 beds |
show details | |

|
#18
E Berry Rd
Rives Junction, MI 49277
|
3,030 sq. feet
|
3 baths 6 beds |
show details | |

|
#19
S Main St
Munith, MI 49259
|
1,008 sq. feet
|
1 baths 3 beds |
show details | |

|
#20
Sweet Ave
Jackson, MI 49203
|
1 sq. feet
|
1 baths 3 beds |
show details |
| Photo | Address | Area | Beds / Baths | Price | Details |
|---|---|---|---|---|---|

|
#21
Tomlinson St
Jackson, MI 49203
|
- sq. feet
|
2 baths 3 beds |
show details | |

|
#22
Aurelius Rd
Lansing, MI 48910
|
1,860 sq. feet
|
2 baths 3 beds |
show details | |

|
#23
Thornwood Dr
Holt, MI 48842
|
2,064 sq. feet
|
2 baths 3 beds |
show details | |

|
#24
Vining St
Jackson, MI 49203
|
719 sq. feet
|
1 baths 3 beds |
show details | |

|
#25
N Blackstone St
Jackson, MI 49201
|
4,478 sq. feet
|
2 baths 6 beds |
show details | |

|
#26
Somerset Drive
Holt, MI 48842
|
2,368 sq. feet
|
3 baths 4 beds |
show details | |

|
#27
Fern Ave
Jackson, MI 49202
|
902 sq. feet
|
1 baths 2 beds |
show details | |

|
#28
E Ganson St
Jackson, MI 49201
|
- sq. feet
|
1 baths 4 beds |
show details | |

|
#29
Juniper Dr
Jackson, MI 49201
|
1,671 sq. feet
|
1 baths 3 beds |
show details | |

|
#30
Gregory Rd
Jackson, MI 49202
|
- sq. feet
|
2 baths 4 beds |
show details |
| Photo | Address | Area | Beds / Baths | Price | Details |
|---|---|---|---|---|---|

|
#31
N Edgar Rd
Mason, MI 48854
|
1,312 sq. feet
|
1 baths 2 beds |
show details | |

|
#32
Lincoln St
Jackson, MI 49202
|
788 sq. feet
|
1 baths 1 beds |
show details | |

|
#33
Seymour Ave
Jackson, MI 49202
|
960 sq. feet
|
1 baths 2 beds |
show details | |

|
#34
W Palmer Ave
Jackson, MI 49203
|
1,161 sq. feet
|
1 baths 3 beds |
show details | |

|
#35
Randolph St
Jackson, MI 49203
|
1,316 sq. feet
|
1 baths 2 beds |
show details | |

|
#36
S Oak Creek Dr
Jackson, MI 49201
|
2,928 sq. feet
|
2 baths 3 beds |
show details | |

|
#37
Noble Rd
Williamston, MI 48895
|
1,004 sq. feet
|
1 baths 3 beds |
show details | |

|
#38
Vining St
Jackson, MI 49203
|
744 sq. feet
|
1 baths 1 beds |
show details | |

|
#39
Moreno Dr
Lansing, MI 48911
|
2,185 sq. feet
|
2 baths 4 beds |
show details | |

|
#40
Birdsell St
Jackson, MI 49203
|
1,128 sq. feet
|
1 baths 2 beds |
show details |
| Photo | Address | Area | Beds / Baths | Price | Details |
|---|---|---|---|---|---|

|
#41
Francis St
Jackson, MI 49203
|
1,959 sq. feet
|
1 baths 3 beds |
show details | |

|
#42
Deerfield Dr
Jackson, MI 49203
|
1,578 sq. feet
|
2 baths 3 beds |
show details | |

|
#43
Trumbull St
Lansing, MI 48911
|
1,674 sq. feet
|
1 baths 4 beds |
show details | |

|
#44
Orange St
Jackson, MI 49202
|
- sq. feet
|
- baths - beds |
$3,500
|
show details |

|
#45
Harper Rd
Mason, MI 48854
|
2,476 sq. feet
|
1 baths 6 beds |
show details | |

|
#46
Fernwood Ln
Mason, MI 48854
|
1,602 sq. feet
|
2 baths 3 beds |
show details | |

|
#47
Park Ln
Holt, MI 48842
|
1,288 sq. feet
|
2 baths 3 beds |
show details | |

|
#48
Woodworth Ave
Holt, MI 48842
|
1,821 sq. feet
|
2 baths 5 beds |
show details | |

|
#49
Cartago Dr
Lansing, MI 48911
|
2,744 sq. feet
|
3 baths 4 beds |
show details | |

|
Check over 1 million property listings on Foreclosure.com!
|
browse all offers | |||

Latest news about housing in Leslie, MI collected exclusively by city-data.com from local newspapers, TV, and radio stations

 | Looking to Move Home (13 replies) |
| Small farm/homestead - where? (14 replies) |
| SAHM seeking family-friendly rental advice for $1000-1200/mo (1 reply) |
| Artist needs straight scoop on NO. MI., iso quiet friendly area (14 replies) |
| Relocating to Ann Arbor, need advice (20 replies) |
| Visiting Lansing before potential move (3 replies) |

Median year apartment built: 1971
Household type by relationship:
Households: 2,165- Male householders: 305 (85 living alone), Female householders: 463 (87 living alone)
388 spouses (380 opposite-sex spouses), 53 unmarried partners, (53 opposite-sex unmarried partners), 669 children (632 natural, 10 adopted, 27 stepchildren), 74 grandchildren, 27 brothers or sisters, 35 parents, 10 foster children, 3 other relatives, 111 non-relatives
- In group quarters: 24
Size of family households: 174 2-persons, 110 3-persons, 118 4-persons, 137 5-persons, 6 6-persons, 2 7-or-more-persons.
Size of nonfamily households: 186 1-person, 49 2-persons, 5 3-persons.
256 married couples with children.
196 single-parent households (66 men, 130 women).
96.6% of residents of Leslie speak English at home.
2.0% of residents speak Spanish at home (100% speak English very well).
0.6% of residents speak other Indo-European language at home (46% speak English very well, 54% speak English not well).
Foreign born population: 21 (1.0%)
(61.9% of them are naturalized citizens)
| Here: | 6.2 |
| State: | 6.5 |
| Here: | 4.6 |
| State: | 4.3 |

- Bedrooms in owner-occupied houses and condos in Leslie, Michigan
- 3no bedroom
- 51 bedroom
- 1372 bedrooms
- 3183 bedrooms
- 1244 bedrooms
- 275+ bedrooms

- Bedrooms in renter-occupied apartments in Leslie, Michigan
- 6no bedroom
- 481 bedroom
- 822 bedrooms
- 313 bedrooms
- 34 bedrooms
- 05+ bedrooms

- Cars and other vehicles available in Leslie in owner-occupied houses/condos
- 24no vehicle
- 1171 vehicle
- 2612 vehicles
- 1623 vehicles
- 404 vehicles
- 105+ vehicles

- Cars and other vehicles available in Leslie in renter-occupied apartments
- 0no vehicle
- 791 vehicle
- 622 vehicles
- 233 vehicles
- 04 vehicles
- 65+ vehicles

- Rooms in owner-occupied houses in Leslie, Michigan
- 31 room
- 32 rooms
- 103 rooms
- 504 rooms
- 1375 rooms
- 1586 rooms
- 837 rooms
- 588 rooms
- 1119+ rooms

- Rooms in renter-occupied apartments in Leslie, Michigan
- 61 room
- 252 rooms
- 143 rooms
- 354 rooms
- 475 rooms
- 236 rooms
- 87 rooms
- 68 rooms
- 69+ rooms


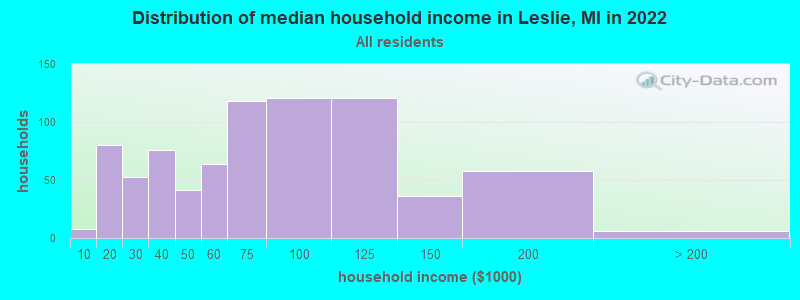
Leslie, MI household income distribution

- 8Less than $10,000
- 80$10,000 to $19,999
- 53$20,000 to $29,999
- 76$30,000 to $39,999
- 41$40,000 to $49,999
- 64$50,000 to $59,999
- 118$60,000 to $74,999
- 121$75,000 to $99,999
- 121$100,000 to $124,999
- 36$125,000 to $149,999
- 58$150,000 to $199,999
- 6$200,000 or more
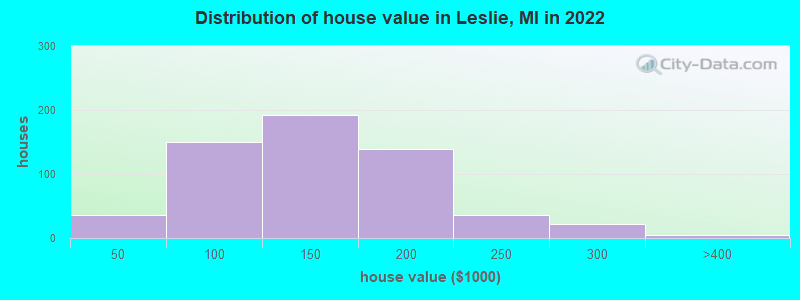
Home value of owner - occupied houses in 2022 in Leslie, MI
-
- 14Less than $10,000
- 13$25,000 to $29,999
- 6$40,000 to $49,999
- 12$50,000 to $59,999
- 37$60,000 to $69,999
- 38$70,000 to $79,999
- 20$80,000 to $89,999
- 34$90,000 to $99,999
- 104$100,000 to $124,999
- 86$125,000 to $149,999
- 68$150,000 to $174,999
- 70$175,000 to $199,999
- 35$200,000 to $249,999
- 21$250,000 to $299,999
- 4$300,000 to $399,999
Rent paid by renters in 2022 in Leslie, MI
-
- 5$200 to $249
- 2$450 to $499
- 27$500 to $549
- 15$550 to $599
- 10$600 to $649
- 24$650 to $699
- 14$700 to $749
- 30$750 to $799
- 10$800 to $899
- 14$900 to $999
- 2$1,000 to $1,249
- 28No cash rent


Percentage of workers working in this county: 61.4%
Number of people working at home: 77 (7.1% of all workers)
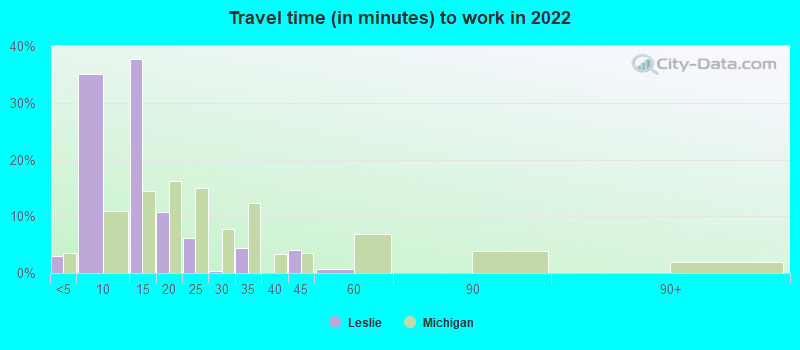
Travel time to work (commute)
- Less than 5 minutes: 21
- 5 to 9 minutes: 136
- 10 to 14 minutes: 45
- 15 to 19 minutes: 122
- 20 to 24 minutes: 150
- 25 to 29 minutes: 124
- 30 to 34 minutes: 178
- 35 to 39 minutes: 76
- 40 to 44 minutes: 70
- 45 to 59 minutes: 29
- 60 to 89 minutes: 12
- 90 or more minutes: 37
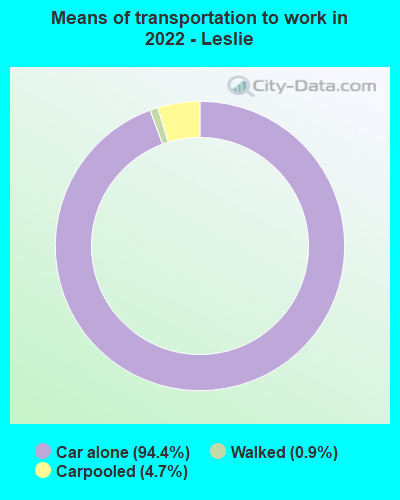
Means of transportation to work:
- Drove a car alone: 644 (82.9%)
- Carpooled: 30 (3.9%)
- Walked: 7 (0.9%)
- Worked at home: 77 (9.9%)

- Unemployment by race in 2022
- Unemployment rate for White non-Hispanic residents
- 6.1%Males
- 1.7%Females
- Unemployment rate for Hispanic or Latino residents
- 8.0%Females

- Year of entry for the foreign-born population in Leslie, Michigan
- 172010 or later
- 02000 to 2009
- 01990 to 1999
- 31980 to 1989
- 21970 to 1979
- 1Before 1970
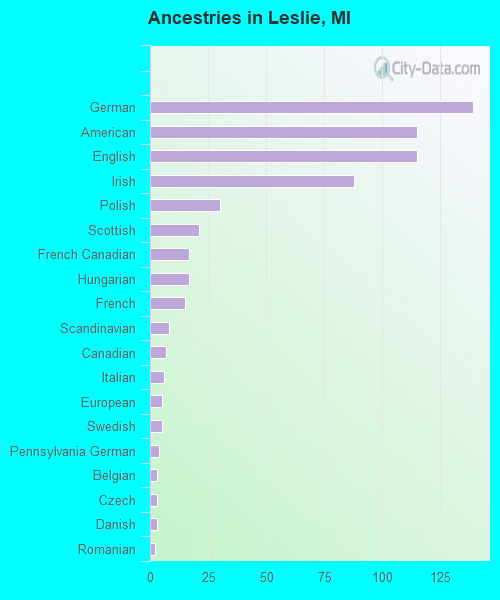
First ancestries reported:
- German: 139 (18.9%)
- American: 115 (15.6%)
- English: 115 (15.6%)
- Irish: 88 (11.9%)
- Polish: 30 (4.1%)
- Scottish: 21 (2.9%)
- French Canadian: 17 (2.3%)
- Hungarian: 17 (2.3%)
- French: 15 (2.0%)
- Scandinavian: 8 (1.1%)
- Canadian: 7 (1.0%)
- Italian: 6 (0.8%)
- European: 5 (0.7%)
- Swedish: 5 (0.7%)
- Pennsylvania German: 4 (0.5%)
- Belgian: 3 (0.4%)
- Czech: 3 (0.4%)
- Danish: 3 (0.4%)
- Romanian: 2 (0.3%)
Most common places of birth for foreign-born residents (%):
| Leslie: | 77.3% (17) |
| Michigan: | 0.1% (873) |
| Leslie: | 27.3% (6) |
| Michigan: | 1.0% (6,730) |
| Leslie: | 4.5% (1) |
| Michigan: | 5.0% (35,052) |
Place of birth for U.S.-born residents:
- This state: 1,867
- Other state: 273
- Northeast: 55
- Midwest: 72
- South: 110
- West: 34
88.4% of Leslie residents lived in the same house 1 years ago.
Out of people who lived in different houses, 34.1% lived in this county.
Out of people who lived in different counties, 70.5% lived in Michigan.
| Leslie: | 88.4% |
| State average: | 88.4% |
Education attainment for males 25 years and older:
- No schooling: 42
- Nursery to 4th grade: 0
- 5th and 6th grade: 11
- 7th and 8th grade: 1
- 9th grade: 8
- 10th grade: 5
- 11th grade: 0
- 12th grade, no diploma: 11
- High school graduate (or equivalency): 252
- Less than 1 year of college: 56
- Some college more than 1 year, no degree: 141
- Associate degree: 27
- Bachelor's degree: 55
- Master's degree: 12
- Professional school degree: 0
- Doctorate degree: 5

Education attainment for females 25 years and older:
- No schooling: 0
- Nursery to 4th grade: 0
- 5th and 6th grade: 5
- 7th and 8th grade: 0
- 9th grade: 6
- 10th grade: 14
- 11th grade: 6
- 12th grade, no diploma: 6
- High school graduate (or equivalency): 199
- Less than 1 year of college: 86
- Some college more than 1 year, no degree: 182
- Associate degree: 89
- Bachelor's degree: 105
- Master's degree: 17
- Professional school degree: 3
- Doctorate degree: 3


Housing units in structures:
- One, detached: 638
- One, attached: 18
- Two: 42
- 3 or 4: 32
- 5 to 9: 40
- 10 to 19: 21
- Mobile homes: 50
Median worth of mobile homes: $12,396
Housing units lacking complete kitchen facilities in 2022: 1.6%
House/condo owner moved in on average 7 years ago
Renter moved in on average 3 years ago

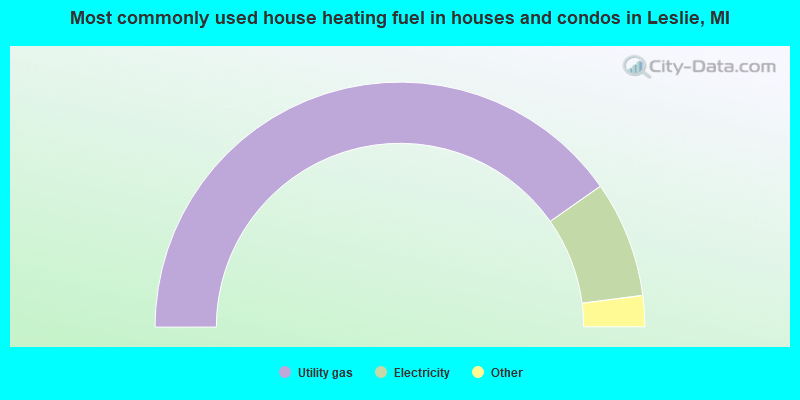
- 80.6%Utility gas
- 15.4%Electricity
- 3.3%Bottled, tank, or LP gas
- 0.7%Wood
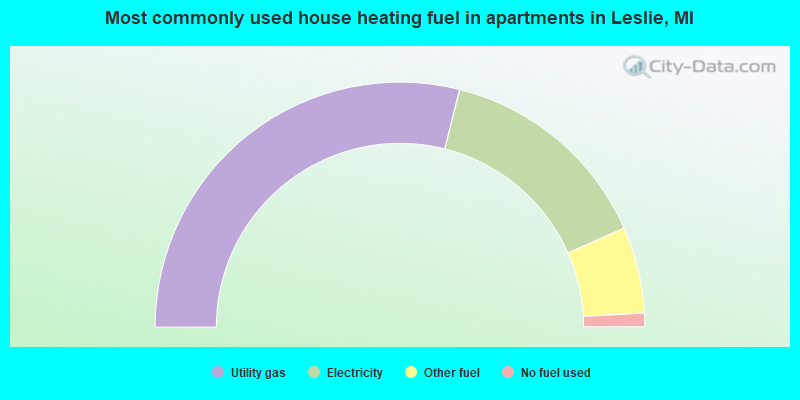
- 57.8%Utility gas
- 28.9%Electricity
- 11.4%Other fuel
- 1.8%No fuel used
Private vs. public school enrollment:
| Here: | 1.3% |
| Michigan: | 12.4% |
| Here: | 7.3% |
| Michigan: | 9.8% |
| Here: | 1.5% |
| Michigan: | 14.9% |


