Lenape Heights, PA (Pennsylvania) Houses and Residents
| Lenape Heights: | $160,211 |
| Pennsylvania: | $245,500 |
Mean price in 2022:
Detached houses: $173,194
Here: $173,194 State: $317,202
Total population: 1,167 (Urban population: 1,032 (all inside urban clusters), Rural population: 137 (all nonfarm))
Houses: 607 (607 occupied: 485 owner occupied, 121 renter occupied)
| % of renters here: | 20% |
| State: | 31% |
Housing density: 837 houses/condos per square mile
Median price asked for vacant for-sale houses and condos in 2022 in this county: $46,631.
Median contract rent in 2022: $703 (lower quartile is $635, upper quartile is $816)
Median gross rent in Lenape Heights, PA in 2022: $911
Housing units in Lenape Heights with a mortgage: 117 (39 second mortgage, 0 home equity loan, 0 both second mortgage and home equity loan)
Houses without a mortgage: 18
Median household income for apartments without a mortgage: $66,942
Median monthly housing costs: $604
Compare current foreclosures near Lenape Heights, PA:
| Photo | Address | Area | Beds / Baths | Price | Details |
|---|---|---|---|---|---|

|
#1
Ice Pond Rd
Leechburg, PA 15656
|
1,440 sq. feet
|
1 baths 3 beds |
$194,500
|
show details |

|
#2
Maple Dr
Ford City, PA 16226
|
1,332 sq. feet
|
1 baths 2 beds |
$42,276
|
show details |

|
#3
Terrace Ave
Apollo, PA 15613
|
856 sq. feet
|
1 baths 2 beds |
$76,005
|
show details |

|
#4
E Brady Rd
Kittanning, PA 16201
|
1,509 sq. feet
|
1 baths 3 beds |
$95,128
|
show details |

|
#5
Freeport Rd
Kittanning, PA 16201
|
1,091 sq. feet
|
1 baths 2 beds |
$61,723
|
show details |

|
#6
Lehigh Dr
Leechburg, PA 15656
|
1,154 sq. feet
|
1 baths 3 beds |
$17,206
|
show details |

|
#7
Armstrong Ave
Vandergrift, PA 15690
|
1,206 sq. feet
|
1 baths 2 beds |
$73,510
|
show details |

|
#8
Riverside Dr
Freeport, PA 16229
|
1,060 sq. feet
|
1 baths 3 beds |
$97,941
|
show details |

|
#9
Ridge Ave
Kittanning, PA 16201
|
1,088 sq. feet
|
1 baths 2 beds |
$36,654
|
show details |

|
#10
Reefer Hollow Rd
Rural Valley, PA 16249
|
2,160 sq. feet
|
1 baths 3 beds |
$124,157
|
show details |
| Photo | Address | Area | Beds / Baths | Price | Details |
|---|---|---|---|---|---|

|
#11
Beale Ave
Leechburg, PA 15656
|
1,200 sq. feet
|
1 baths 2 beds |
$52,770
|
show details |

|
#12
Campbell Run Rd
Ford City, PA 16226
|
2,048 sq. feet
|
1 baths 3 beds |
$130,428
|
show details |

|
#13
Hungry Hollow Rd
Leechburg, PA 15656
|
1,496 sq. feet
|
1 baths 4 beds |
$14,900
|
show details |

|
#14
Maple Rd
Vandergrift, PA 15690
|
1,144 sq. feet
|
1 baths 3 beds |
$63,205
|
show details |

|
#15
State Route 85
Kittanning, PA 16201
|
2,020 sq. feet
|
2 baths 4 beds |
$92,090
|
show details |

|
#16
Canal Rd
Apollo, PA 15613
|
1,517 sq. feet
|
1 baths 5 beds |
$159,924
|
show details |

|
#17
7th Ave
Ford City, PA 16226
|
1,320 sq. feet
|
1 baths 2 beds |
$39,648
|
show details |

|
#18
Kings Rd
Apollo, PA 15613
|
900 sq. feet
|
1 baths 2 beds |
show details | |

|
#19
2nd St
Leechburg, PA 15656
|
1,416 sq. feet
|
2 baths 3 beds |
show details | |

|
#20
Greenwich St
Natrona Heights, PA 15065
|
1,076 sq. feet
|
1 baths 2 beds |
show details |
| Photo | Address | Area | Beds / Baths | Price | Details |
|---|---|---|---|---|---|

|
#21
Schnur Rd
Butler, PA 16002
|
1,443 sq. feet
|
1 baths 3 beds |
show details | |

|
#22
Seldom Seen Rd
Kittanning, PA 16201
|
1,255 sq. feet
|
1 baths 4 beds |
show details | |

|
#23
State Route 28 And 66
Kittanning, PA 16201
|
834 sq. feet
|
1 baths 2 beds |
show details | |

|
#24
Juniata St
Natrona Heights, PA 15065
|
1,080 sq. feet
|
1 baths 2 beds |
show details | |

|
#25
Palm St
Natrona Heights, PA 15065
|
1,088 sq. feet
|
1 baths 3 beds |
show details | |

|
#26
Pine St
Natrona Heights, PA 15065
|
1,096 sq. feet
|
1 baths 2 beds |
show details | |

|
#27
Deer Dr
New Kensington, PA 15068
|
2,477 sq. feet
|
3 baths 4 beds |
show details | |

|
#28
Olive Ave
Natrona Heights, PA 15065
|
1,200 sq. feet
|
1 baths 3 beds |
show details | |

|
#29
Mccutcheon Short Cut Rd
Leechburg, PA 15656
|
1,880 sq. feet
|
2 baths 3 beds |
show details | |

|
#30
East First Street
Rural Valley, PA 16249
|
- sq. feet
|
1 baths 2 beds |
show details |
| Photo | Address | Area | Beds / Baths | Price | Details |
|---|---|---|---|---|---|

|
#31
Bradys Bend Cemetery Rd
East Brady, PA 16028
|
1,680 sq. feet
|
1 baths 4 beds |
show details | |

|
#32
Westmoreland Ave
Avonmore, PA 15618
|
1,824 sq. feet
|
2 baths 4 beds |
show details | |

|
#33
Indiana Avenue Ext
Avonmore, PA 15618
|
- sq. feet
|
2 baths 4 beds |
show details | |

|
#34
Lincoln St
Vandergrift, PA 15690
|
1,334 sq. feet
|
1 baths 3 beds |
show details | |

|
#35
Ormond St
Tarentum, PA 15084
|
1,998 sq. feet
|
2 baths 3 beds |
show details | |

|
#36
N 2nd St
Apollo, PA 15613
|
- sq. feet
|
2 baths 4 beds |
show details | |

|
#37
S Mckean St
Kittanning, PA 16201
|
2,244 sq. feet
|
1 baths 3 beds |
show details | |

|
#38
9th Ave
Brackenridge, PA 15014
|
1,260 sq. feet
|
1 baths 3 beds |
show details | |

|
#39
Circle Ct
Natrona Heights, PA 15065
|
784 sq. feet
|
1 baths 2 beds |
show details | |

|
#40
Stewartson Rd
Templeton, PA 16259
|
- sq. feet
|
- baths - beds |
$94,752
|
show details |
| Photo | Address | Area | Beds / Baths | Price | Details |
|---|---|---|---|---|---|

|
#41
Jefferson Ave
Natrona Heights, PA 15065
|
1,130 sq. feet
|
1 baths 2 beds |
show details | |

|
#42
Elwood Rd
Apollo, PA 15613
|
- sq. feet
|
- baths - beds |
$10,507
|
show details |

|
#43
Armstrong Ave
Apollo, PA 15613
|
1,425 sq. feet
|
1 baths 3 beds |
show details | |

|
#44
Monroe St
Natrona Heights, PA 15065
|
1,080 sq. feet
|
1 baths 2 beds |
show details | |

|
#45
Maple Dr
Ford City, PA 16226
|
1,332 sq. feet
|
1 baths 2 beds |
show details | |

|
#46
Grace St
Apollo, PA 15613
|
1,408 sq. feet
|
1 baths 3 beds |
show details | |

|
#47
Lane Ave
Natrona Heights, PA 15065
|
1,260 sq. feet
|
1 baths 2 beds |
show details | |

|
#48
Palm St
Natrona Heights, PA 15065
|
1,944 sq. feet
|
1 baths 3 beds |
show details | |

|
#49
Stieren Ave
Brackenridge, PA 15014
|
1,736 sq. feet
|
2 baths 3 beds |
show details | |

|
Check over 1 million property listings on Foreclosure.com!
|
browse all offers | |||


Median year apartment built: 1973
Household type by relationship:
Households: 1,305- Male householders: 263 (25 living alone), Female householders: 336 (112 living alone)
244 spouses (229 opposite-sex spouses), 43 unmarried partners, (43 opposite-sex unmarried partners), 304 children (304 natural, 0 adopted, 0 stepchildren), 29 grandchildren, 0 brothers or sisters, 21 parents, 0 foster children, 0 other relatives, 61 non-relatives
Size of family households: 265 2-persons, 45 3-persons, 68 4-persons.
Size of nonfamily households: 152 1-person, 70 2-persons.
13 married couples with children.
190 single-parent households (98 men, 92 women).
97.5% of residents of Lenape Heights speak English at home.
1.5% of residents speak other Indo-European language at home (100% speak English very well).
0.5% of residents speak Asian or Pacific Island language at home (100% speak English well).
Foreign born population: 7 (0.5%)
(0.0% of them are naturalized citizens)
| Here: | 6.2 |
| State: | 6.8 |
| Here: | 5.2 |
| State: | 4.3 |

- Bedrooms in owner-occupied houses and condos in Lenape Heights, Pennsylvania
- 0no bedroom
- 01 bedroom
- 1272 bedrooms
- 2763 bedrooms
- 834 bedrooms
- 05+ bedrooms

- Bedrooms in renter-occupied apartments in Lenape Heights, Pennsylvania
- 0no bedroom
- 01 bedroom
- 1022 bedrooms
- 203 bedrooms
- 04 bedrooms
- 05+ bedrooms

- Cars and other vehicles available in Lenape Heights in owner-occupied houses/condos
- 19no vehicle
- 1271 vehicle
- 1702 vehicles
- 1503 vehicles
- 04 vehicles
- 205+ vehicles

- Cars and other vehicles available in Lenape Heights in renter-occupied apartments
- 6no vehicle
- 591 vehicle
- 372 vehicles
- 03 vehicles
- 204 vehicles
- 05+ vehicles

- Rooms in owner-occupied houses in Lenape Heights, Pennsylvania
- 01 room
- 02 rooms
- 03 rooms
- 154 rooms
- 1595 rooms
- 1406 rooms
- 377 rooms
- 818 rooms
- 549+ rooms

- Rooms in renter-occupied apartments in Lenape Heights, Pennsylvania
- 01 room
- 02 rooms
- 63 rooms
- 304 rooms
- 575 rooms
- 296 rooms
- 07 rooms
- 08 rooms
- 09+ rooms


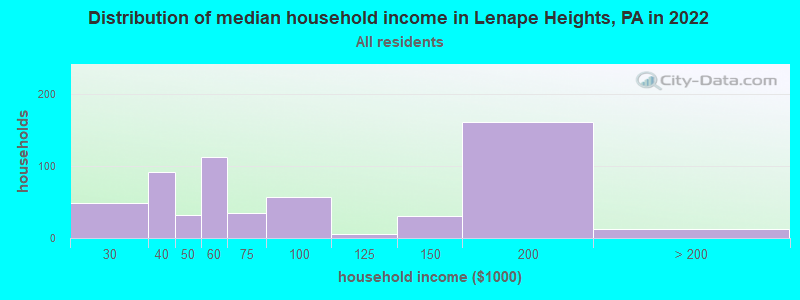
Lenape Heights, PA household income distribution

- 48$20,000 to $29,999
- 91$30,000 to $39,999
- 32$40,000 to $49,999
- 112$50,000 to $59,999
- 35$60,000 to $74,999
- 57$75,000 to $99,999
- 6$100,000 to $124,999
- 31$125,000 to $149,999
- 161$150,000 to $199,999
- 13$200,000 or more
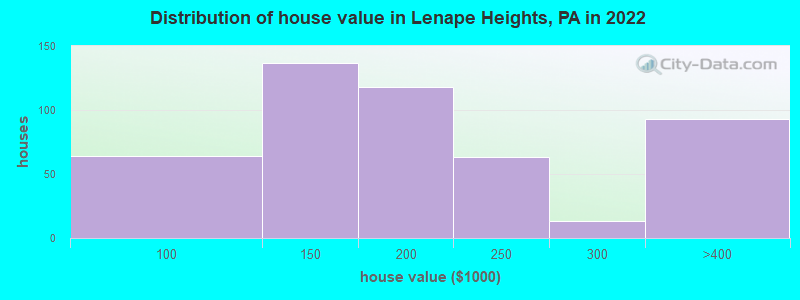
Home value of owner - occupied houses in 2022 in Lenape Heights, PA
-
- 34$70,000 to $79,999
- 29$80,000 to $89,999
- 93$100,000 to $124,999
- 44$125,000 to $149,999
- 118$150,000 to $174,999
- 63$200,000 to $249,999
- 13$250,000 to $299,999
- 93$300,000 to $399,999
Rent paid by renters in 2022 in Lenape Heights, PA
-
- 22$350 to $399
- 64$650 to $699
- 46$750 to $799
- 23$800 to $899
- 5$900 to $999


Percentage of workers working in this county: 55.3%
Number of people working at home: 90 (12.2% of all workers)
Travel time to work (commute)
- Less than 5 minutes: 0
- 5 to 9 minutes: 60
- 10 to 14 minutes: 175
- 15 to 19 minutes: 0
- 20 to 24 minutes: 0
- 25 to 29 minutes: 49
- 30 to 34 minutes: 85
- 35 to 39 minutes: 77
- 40 to 44 minutes: 52
- 45 to 59 minutes: 17
- 60 to 89 minutes: 129
- 90 or more minutes: 0
Means of transportation to work:
- Drove a car alone: 361 (89.4%)
- Carpooled: 29 (7.2%)
- Bus or trolley bus: 4 (1.0%)
- Worked at home: 10 (2.5%)

- Unemployment by race in 2022
- Unemployment rate for White non-Hispanic residents
- 4.9%Females

- Year of entry for the foreign-born population in Lenape Heights, Pennsylvania
- 02010 or later
- 62000 to 2009
- 01990 to 1999
- 51980 to 1989
- 81970 to 1979
- 0Before 1970

First ancestries reported:
- English: 81 (18.3%)
- Italian: 76 (17.2%)
- Scotch-Irish: 69 (15.6%)
- German: 37 (8.4%)
- European: 36 (8.1%)
- French Canadian: 35 (7.9%)
- Kenyan: 34 (7.7%)
- Slovak: 21 (4.7%)
- Czech: 16 (3.6%)
Most common places of birth for foreign-born residents (%):
| Lenape Heights: | 100.0% (6) |
| Pennsylvania: | 7.2% (67,704) |
Place of birth for U.S.-born residents:
- This state: 1,170
- Other state: 130
- Northeast: 0
- Midwest: 0
- South: 125
- West: 21
88.7% of Lenape Heights residents lived in the same house 1 years ago.
Out of people who lived in different houses, 45.4% lived in this county.
Out of people who lived in different counties, 0.0% lived in Pennsylvania.
| Lenape Heights: | 88.7% |
| State average: | 89.3% |
Education attainment for males 25 years and older:
- No schooling: 0
- Nursery to 4th grade: 0
- 5th and 6th grade: 0
- 7th and 8th grade: 33
- 9th grade: 0
- 10th grade: 0
- 11th grade: 0
- 12th grade, no diploma: 0
- High school graduate (or equivalency): 199
- Less than 1 year of college: 76
- Some college more than 1 year, no degree: 85
- Associate degree: 64
- Bachelor's degree: 99
- Master's degree: 0
- Professional school degree: 0
- Doctorate degree: 18

Education attainment for females 25 years and older:
- No schooling: 0
- Nursery to 4th grade: 0
- 5th and 6th grade: 0
- 7th and 8th grade: 0
- 9th grade: 0
- 10th grade: 0
- 11th grade: 0
- 12th grade, no diploma: 0
- High school graduate (or equivalency): 194
- Less than 1 year of college: 39
- Some college more than 1 year, no degree: 32
- Associate degree: 27
- Bachelor's degree: 96
- Master's degree: 24
- Professional school degree: 18
- Doctorate degree: 0


Housing units in structures:
- One, detached: 511
- 3 or 4: 48
- Mobile homes: 46
House/condo owner moved in on average 21 years ago
Renter moved in on average 0 years ago

Private vs. public school enrollment:
| Here: | 0.0% |
| Pennsylvania: | 15.7% |
| Here: | 0.0% |
| Pennsylvania: | 13.4% |
| Here: | 0.0% |
| Pennsylvania: | 39.8% |


