Median price asked for vacant for-sale houses and condos in 2022 in this county: $350,177.
Median contract rent in 2022: $1,817 (lower quartile is $1,479, upper quartile is over $2,000)
Median rent asked for vacant for-rent units in 2022: $3,124
Median gross rent in Lemmon Valley-Golden Valley, NV in 2022: over $2,000
Housing units in Lemmon Valley-Golden Valley with a mortgage: 1,414 (165 second mortgage, 175 home equity loan, 16 both second mortgage and home equity loan) Houses without a mortgage: 203
Compare current foreclosures near Lemmon Valley-Golden Valley, NV:
In family households: 333,280 (72,131 male householders, 30,637 female householders)
74,494 spouses, 114,518 children (105,670 natural, 2,626 adopted, 6,222 stepchildren), 8,423 grandchildren, 5,233 brothers or sisters, 4,625 parents, foster children, 6,388 other relatives, 13,408 non-relatives
In nonfamily households: 82,855 (32,101 male householders (22,736 living alone)), 28,576 female householders (21,733 living alone)), 22,178 nonrelatives
In group quarters: 5,272 (2,106 institutionalized population)
55,429 married couples with children.
20,124 single-parent households (5,984 men, 14,140 women).
93.0% of residents of Lemmon Valley-Golden Valley speak English at home.
3.2% of residents speak Spanish at home (81% speak English very well, 7% speak English well, 12% speak English not well).
2.3% of residents speak other Indo-European language at home (71% speak English very well, 16% speak English well, 13% speak English not well).
1.1% of residents speak Asian or Pacific Island language at home (58% speak English very well, 32% speak English well, 10% speak English not well).
0.3% of residents speak other language at home (100% speak English very well).
Foreign born population: 328 (3.3%)
(56.4% of them are naturalized citizens)
Year of entry for the foreign-born population in Lemmon Valley-Golden Valley, Nevada
531995 to March 2000
81990 to 1994
331985 to 1989
271980 to 1984
251975 to 1979
101970 to 1974
361965 to 1969
37Before 1965
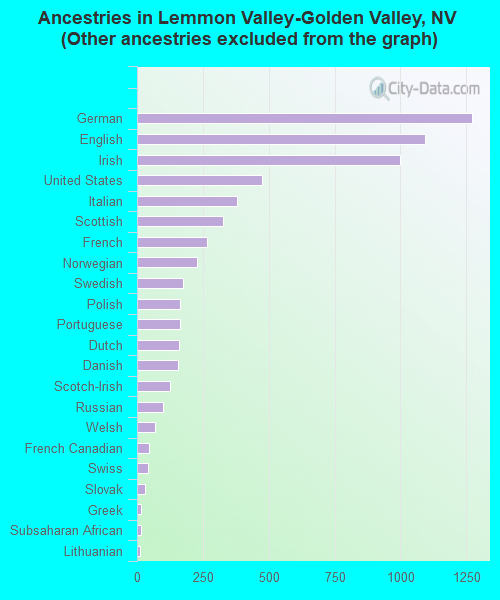
First ancestries reported:
Other: 1,385 (17.9%)
German: 1,273 (16.5%)
English: 1,094 (14.2%)
Irish: 999 (12.9%)
United States: 473 (6.1%)
Italian: 379 (4.9%)
Scottish: 328 (4.2%)
French: 267 (3.5%)
Norwegian: 229 (3.0%)
Swedish: 173 (2.2%)
Polish: 164 (2.1%)
Portuguese: 163 (2.1%)
Dutch: 161 (2.1%)
Danish: 157 (2.0%)
Scotch-Irish: 124 (1.6%)
Russian: 97 (1.3%)
Welsh: 67 (0.9%)
French Canadian: 47 (0.6%)
Swiss: 42 (0.5%)
Slovak: 29 (0.4%)
Greek: 16 (0.2%)
Subsaharan African: 15 (0.2%)
Lithuanian: 13 (0.2%)
Ukrainian: 11 (0.1%)
Czech: 9 (0.1%)
Hungarian: 9 (0.1%)
Most common places of birth for foreign-born residents (%):
Mexico
Lemmon Valley-Golden Valley:
32.3% (74)
Nevada:
48.6% (153,946)
China, excluding Hong Kong and Taiwan
Lemmon Valley-Golden Valley:
12.2% (28)
Nevada:
1.6% (5,210)
Taiwan
Lemmon Valley-Golden Valley:
10.9% (25)
Nevada:
0.6% (1,994)
Costa Rica
Lemmon Valley-Golden Valley:
8.3% (19)
Nevada:
0.2% (568)
Philippines
Lemmon Valley-Golden Valley:
6.1% (14)
Nevada:
9.9% (31,491)
Guatemala
Lemmon Valley-Golden Valley:
5.7% (13)
Nevada:
1.7% (5,463)
Canada
Lemmon Valley-Golden Valley:
5.7% (13)
Nevada:
3.4% (10,690)
France
Lemmon Valley-Golden Valley:
4.4% (10)
Nevada:
0.5% (1,493)
Germany
Lemmon Valley-Golden Valley:
3.9% (9)
Nevada:
2.1% (6,621)
Romania
Lemmon Valley-Golden Valley:
3.9% (9)
Nevada:
0.3% (808)
Japan
Lemmon Valley-Golden Valley:
3.1% (7)
Nevada:
1.2% (3,935)
Belarus
Lemmon Valley-Golden Valley:
2.2% (5)
Nevada:
0.0% (13)
Place of birth for U.S.-born residents:
This state: 1,939
Other state: 4,566
Northeast: 444
Midwest: 749
South: 459
West: 2,914
62% of Lemmon Valley-Golden Valley residents lived in the same house 5 years ago. Out of people who lived in different houses, 66% lived in this county. Out of people who lived in different counties, 22% lived in Nevada.
Education attainment for males 25 years and older:
No schooling: 15
Nursery to 4th grade: 0
5th and 6th grade: 0
7th and 8th grade: 23
9th grade: 58
10th grade: 66
11th grade: 33
12th grade, no diploma: 140
High school graduate (or equivalency): 732
Less than 1 year of college: 224
Some college more than 1 year, no degree: 575
Associate degree: 200
Bachelor's degree: 161
Master's degree: 104
Professional school degree: 5
Doctorate degree: 31
Education attainment for females 25 years and older: