Lebanon, IL (Illinois) Houses and Residents
| Lebanon: | $135,436 |
| Illinois: | $251,600 |
Mean price in 2022:
Detached houses: $145,934
Here: $145,934 State: $310,164 Townhouses or other attached units: $135,659
Here: $135,659 State: $286,230
Total population: 4,466 (Urban population: 3,397, Rural population: 30 (all nonfarm))
Houses: 2,085 (1,733 occupied: 1,120 owner occupied, 627 renter occupied)
| % of renters here: | 36% |
| State: | 33% |
Housing density: 971 houses/condos per square mile
Median price asked for vacant for-sale houses and condos in 2022: $263,548.
Median contract rent in 2022: $960 (lower quartile is $329, upper quartile is $1,202)
Median rent asked for vacant for-rent units in 2022: $1,500
Median gross rent in Lebanon, IL in 2022: $1,108
Housing units in Lebanon with a mortgage: 934 (122 second mortgage, 18 home equity loan, 118 both second mortgage and home equity loan)
Houses without a mortgage: 26
Median household income for houses/condos with a mortgage: $92,849
Median household income for apartments without a mortgage: $93,947
Median monthly housing costs: $1,174
Compare current foreclosures near Lebanon, IL:
| Photo | Address | Area | Beds / Baths | Price | Details |
|---|---|---|---|---|---|

|
#1
Hagemann Rd
Lebanon, IL 62254
|
- sq. feet
|
- baths - beds |
show details | |

|
#2
E Saint Louis St Apt 1
Lebanon, IL 62254
|
- sq. feet
|
- baths - beds |
show details | |

|
#3
Fort Henry Rd
Belleville, IL 62221
|
1,800 sq. feet
|
2 baths 3 beds |
$229,000
|
show details |

|
#4
State Route 159
Smithton, IL 62285
|
1,916 sq. feet
|
2 baths 3 beds |
$261,000
|
show details |

|
#5
W Adams St
O Fallon, IL 62269
|
905 sq. feet
|
1 baths 2 beds |
$172,000
|
show details |

|
#6
Hillcrest Dr
Glen Carbon, IL 62034
|
1,425 sq. feet
|
2 baths 3 beds |
$265,000
|
show details |

|
#7
Lucinda Dr
Fairview Heights, IL 62208
|
1,040 sq. feet
|
2 baths 2 beds |
$157,900
|
show details |

|
#8
N 15th St
Belleville, IL 62220
|
1,467 sq. feet
|
1 baths 4 beds |
$147,000
|
show details |

|
#9
N 55th St
East Saint Louis, IL 62204
|
672 sq. feet
|
1 baths 2 beds |
$1
|
show details |

|
#10
West Blvd
Belleville, IL 62221
|
1,462 sq. feet
|
2 baths 2 beds |
$187,900
|
show details |
| Photo | Address | Area | Beds / Baths | Price | Details |
|---|---|---|---|---|---|

|
#11
Frey Ln
Fairview Heights, IL 62208
|
1,258 sq. feet
|
2 baths 3 beds |
$165,000
|
show details |

|
#12
N 46th St
East Saint Louis, IL 62204
|
1,218 sq. feet
|
1 baths 3 beds |
$1
|
show details |

|
#13
Weil Rd
Lebanon, IL 62254
|
- sq. feet
|
- baths - beds |
show details | |

|
#14
Hunter St
Lebanon, IL 62254
|
- sq. feet
|
- baths - beds |
show details | |

|
#15
E Schuetz St
Lebanon, IL 62254
|
- sq. feet
|
- baths - beds |
show details | |

|
#16
Janet Dr
Lebanon, IL 62254
|
- sq. feet
|
- baths - beds |
show details | |

|
#17
Harmon Dr
Lebanon, IL 62254
|
- sq. feet
|
- baths - beds |
show details | |

|
#18
Harmon Dr
Lebanon, IL 62254
|
- sq. feet
|
- baths - beds |
show details | |

|
#19
Mckendree Park Rd
Lebanon, IL 62254
|
- sq. feet
|
- baths - beds |
show details | |

|
#20
Cherry St
Lebanon, IL 62254
|
- sq. feet
|
- baths - beds |
show details |
| Photo | Address | Area | Beds / Baths | Price | Details |
|---|---|---|---|---|---|

|
#21
N Horner St
Lebanon, IL 62254
|
- sq. feet
|
- baths - beds |
show details | |

|
#22
Mckendree Park Rd
Lebanon, IL 62254
|
- sq. feet
|
- baths - beds |
show details | |

|
#23
Optimist Dr
Belleville, IL 62220
|
- sq. feet
|
1 baths 3 beds |
$57,200
|
show details |

|
#24
S 18th St
Belleville, IL 62226
|
- sq. feet
|
1 baths 4 beds |
$47,250
|
show details |

|
#25
N 36th St
Belleville, IL 62226
|
2,447 sq. feet
|
1 baths 3 beds |
show details | |

|
#26
Farragut Ct
Belleville, IL 62221
|
1,104 sq. feet
|
2 baths 3 beds |
show details | |

|
#27
Eileen St
Collinsville, IL 62234
|
1,680 sq. feet
|
1 baths 3 beds |
show details | |

|
#28
Old Saint Louis Rd
Belleville, IL 62223
|
1,560 sq. feet
|
2 baths 3 beds |
show details | |

|
#29
S Fillmore St
Edwardsville, IL 62025
|
750 sq. feet
|
1 baths 3 beds |
show details | |

|
#30
S 34th St
Belleville, IL 62226
|
1,182 sq. feet
|
1 baths 2 beds |
show details |
| Photo | Address | Area | Beds / Baths | Price | Details |
|---|---|---|---|---|---|

|
#31
N 32nd St
East Saint Louis, IL 62205
|
720 sq. feet
|
1 baths 2 beds |
show details | |

|
#32
S Main St
Troy, IL 62294
|
1,620 sq. feet
|
2 baths 3 beds |
show details | |

|
#33
N 31st St
Belleville, IL 62226
|
- sq. feet
|
2 baths 3 beds |
show details | |

|
#34
Hillcrest Dr
Belleville, IL 62221
|
2,120 sq. feet
|
2 baths 3 beds |
show details | |

|
#35
S 88th St
Belleville, IL 62223
|
1,052 sq. feet
|
1 baths 2 beds |
show details | |

|
#36
N 41st St
Belleville, IL 62226
|
- sq. feet
|
1 baths 2 beds |
show details | |

|
#37
N Park Dr
Belleville, IL 62226
|
1,392 sq. feet
|
1 baths 3 beds |
show details | |

|
#38
Seasons Ridge Ct
Maryville, IL 62062
|
3,800 sq. feet
|
5 baths 6 beds |
show details | |

|
#39
Granvue Dr
Belleville, IL 62223
|
3,415 sq. feet
|
3 baths 5 beds |
show details | |

|
#40
Marian Ct
Belleville, IL 62226
|
999 sq. feet
|
2 baths 3 beds |
show details |
| Photo | Address | Area | Beds / Baths | Price | Details |
|---|---|---|---|---|---|

|
#41
Frank Scott Pkwy W
Belleville, IL 62223
|
1,073 sq. feet
|
1 baths 3 beds |
show details | |

|
#42
N 72nd St
East Saint Louis, IL 62203
|
720 sq. feet
|
1 baths 2 beds |
show details | |

|
#43
N 17th St
Belleville, IL 62226
|
1,684 sq. feet
|
2 baths 4 beds |
show details | |

|
#44
E Adams St
Belleville, IL 62220
|
2,108 sq. feet
|
1 baths 5 beds |
show details | |

|
#45
Old Caseyville Rd
Belleville, IL 62226
|
1,134 sq. feet
|
1 baths 3 beds |
show details | |

|
#46
Saint Louis Rd
Collinsville, IL 62234
|
1,348 sq. feet
|
2 baths 4 beds |
show details | |

|
#47
Eagles Way
Troy, IL 62294
|
912 sq. feet
|
1 baths 4 beds |
show details | |

|
#48
N 80th St
East Saint Louis, IL 62203
|
952 sq. feet
|
1 baths 3 beds |
show details | |

|
#49
Mcclintock Ave
Belleville, IL 62221
|
1,000 sq. feet
|
2 baths 2 beds |
show details | |

|
Check over 1 million property listings on Foreclosure.com!
|
browse all offers | |||

Latest news about housing in Lebanon, IL collected exclusively by city-data.com from local newspapers, TV, and radio stations

 | Considering moving to Lebanon, Illinois (6 replies) |
| Lebanon, IL (9 replies) |
| How's St. Louis's Metro East? (6 replies) |
| Chicago has 3 of the top 25 hipster zip codes in the country (37 replies) |
| Does anyone remember a bar called Stonehenge? (19 replies) |
| Chicago Living for Young Professional African Americans (43 replies) |

Median year apartment built: 1995
Household type by relationship:
Households: 4,607- Male householders: 804 (151 living alone), Female householders: 895 (342 living alone)
911 spouses (911 opposite-sex spouses), 74 unmarried partners, (61 opposite-sex unmarried partners), 909 children (909 natural, 0 adopted, 0 stepchildren), 40 grandchildren, 0 brothers or sisters, 0 parents, 0 foster children, 26 other relatives, 382 non-relatives
- In group quarters: 562
Size of family households: 658 2-persons, 220 3-persons, 98 4-persons, 11 5-persons, 96 6-persons.
Size of nonfamily households: 460 1-person, 110 2-persons, 142 3-persons, 11 4-persons.
330 married couples with children.
199 single-parent households (63 men, 136 women).
96.6% of residents of Lebanon speak English at home.
1.1% of residents speak Spanish at home (100% speak English very well).
0.5% of residents speak other Indo-European language at home (100% speak English very well).
0.6% of residents speak Asian or Pacific Island language at home (65% speak English very well, 35% speak English well).
0.7% of residents speak other language at home (100% speak English very well).
Foreign born population: 92 (2.0%)
(66.3% of them are naturalized citizens)
| Here: | 6.3 |
| State: | 6.4 |
| Here: | 4.4 |
| State: | 4.1 |

- Bedrooms in owner-occupied houses and condos in Lebanon, Illinois
- 0no bedroom
- 01 bedroom
- 3222 bedrooms
- 5263 bedrooms
- 1664 bedrooms
- 1075+ bedrooms

- Bedrooms in renter-occupied apartments in Lebanon, Illinois
- 101no bedroom
- 741 bedroom
- 3912 bedrooms
- 163 bedrooms
- 454 bedrooms
- 05+ bedrooms

- Cars and other vehicles available in Lebanon in owner-occupied houses/condos
- 71no vehicle
- 2511 vehicle
- 4342 vehicles
- 2073 vehicles
- 1164 vehicles
- 415+ vehicles

- Cars and other vehicles available in Lebanon in renter-occupied apartments
- 132no vehicle
- 1491 vehicle
- 2252 vehicles
- 1123 vehicles
- 104 vehicles
- 05+ vehicles

- Rooms in owner-occupied houses in Lebanon, Illinois
- 01 room
- 02 rooms
- 853 rooms
- 254 rooms
- 1345 rooms
- 3366 rooms
- 1827 rooms
- 958 rooms
- 2649+ rooms

- Rooms in renter-occupied apartments in Lebanon, Illinois
- 821 room
- 02 rooms
- 673 rooms
- 1744 rooms
- 1945 rooms
- 796 rooms
- 07 rooms
- 228 rooms
- 99+ rooms


Lebanon, IL household income distribution

- 26Less than $10,000
- 52$10,000 to $19,999
- 179$20,000 to $29,999
- 165$30,000 to $39,999
- 66$40,000 to $49,999
- 57$50,000 to $59,999
- 148$60,000 to $74,999
- 495$75,000 to $99,999
- 229$100,000 to $124,999
- 168$125,000 to $149,999
- 38$150,000 to $199,999
- 117$200,000 or more

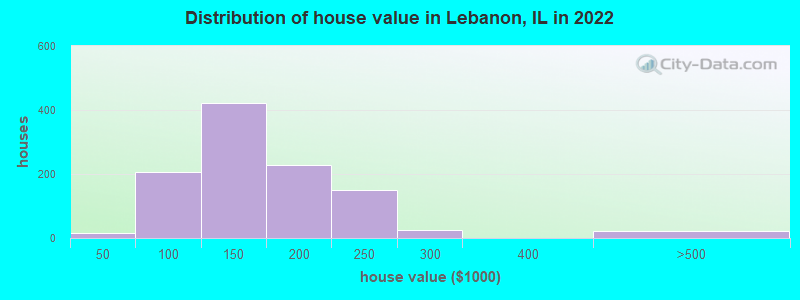
Home value of owner - occupied houses in 2022 in Lebanon, IL
-
- 15$40,000 to $49,999
- 27$60,000 to $69,999
- 20$70,000 to $79,999
- 71$80,000 to $89,999
- 69$90,000 to $99,999
- 295$100,000 to $124,999
- 126$125,000 to $149,999
- 136$150,000 to $174,999
- 92$175,000 to $199,999
- 149$200,000 to $249,999
- 24$250,000 to $299,999
- 21$400,000 to $499,999
Rent paid by renters in 2022 in Lebanon, IL
-
- 16Less than $100
- 23$200 to $249
- 64$300 to $349
- 13$350 to $399
- 16$450 to $499
- 8$550 to $599
- 13$600 to $649
- 30$800 to $899
- 24$900 to $999
- 186$1,000 to $1,249
- 63$1,250 to $1,499


Percentage of workers working in this county: 94.0%
Number of people working at home: 721 (29.8% of all workers)
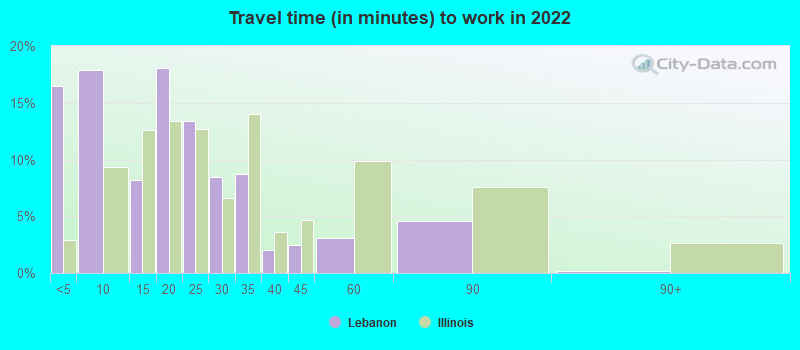
Travel time to work (commute)
- Less than 5 minutes: 228
- 5 to 9 minutes: 273
- 10 to 14 minutes: 94
- 15 to 19 minutes: 301
- 20 to 24 minutes: 505
- 25 to 29 minutes: 221
- 30 to 34 minutes: 146
- 35 to 39 minutes: 31
- 40 to 44 minutes: 20
- 45 to 59 minutes: 59
- 60 to 89 minutes: 0
- 90 or more minutes: 25
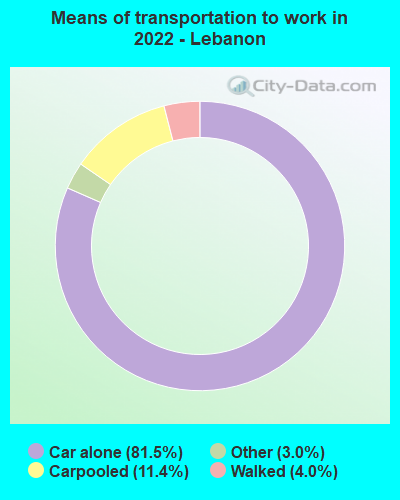
Means of transportation to work:
- Drove a car alone: 1,126 (56.6%)
- Carpooled: 191 (9.6%)
- Taxi: 67 (3.4%)
- Walked: 109 (5.5%)
- Worked at home: 721 (36.2%)

- Unemployment by race in 2022
- Unemployment rate for White non-Hispanic residents
- 1.5%Males
- 1.2%Females

- Year of entry for the foreign-born population in Lebanon, Illinois
- 572010 or later
- 02000 to 2009
- 141990 to 1999
- 51980 to 1989
- 61970 to 1979
- 14Before 1970

First ancestries reported:
- German: 537 (32.0%)
- American: 333 (19.8%)
- Irish: 230 (13.7%)
- English: 144 (8.6%)
- Scotch-Irish: 65 (3.9%)
- Italian: 56 (3.3%)
- Palestinian: 42 (2.5%)
- Danish: 20 (1.2%)
- Croatian: 16 (1.0%)
- Polish: 11 (0.7%)
- Northern European: 10 (0.6%)
- Swedish: 2 (0.1%)
Most common places of birth for foreign-born residents (%):
| Lebanon: | 34.7% (34) |
| Illinois: | 0.4% (7,117) |
| Lebanon: | 32.7% (32) |
| Illinois: | 34.7% (626,958) |
| Lebanon: | 9.2% (9) |
| Illinois: | 1.1% (19,306) |
| Lebanon: | 8.2% (8) |
| Illinois: | 1.2% (22,269) |
| Lebanon: | 5.1% (5) |
| Illinois: | 0.1% (1,361) |
| Lebanon: | 4.1% (4) |
| Illinois: | 5.2% (93,003) |
| Lebanon: | 2.0% (2) |
| Illinois: | 0.1% (1,187) |
Place of birth for U.S.-born residents:
- This state: 2,502
- Other state: 1,975
- Northeast: 384
- Midwest: 691
- South: 329
- West: 700
86.0% of Lebanon residents lived in the same house 1 years ago.
Out of people who lived in different houses, 22.7% lived in this county.
Out of people who lived in different counties, 81.1% lived in Illinois.
| Lebanon: | 86.0% |
| State average: | 88.3% |
Education attainment for males 25 years and older:
- No schooling: 2
- Nursery to 4th grade: 0
- 5th and 6th grade: 0
- 7th and 8th grade: 0
- 9th grade: 0
- 10th grade: 36
- 11th grade: 23
- 12th grade, no diploma: 0
- High school graduate (or equivalency): 219
- Less than 1 year of college: 32
- Some college more than 1 year, no degree: 194
- Associate degree: 368
- Bachelor's degree: 319
- Master's degree: 72
- Professional school degree: 5
- Doctorate degree: 0

Education attainment for females 25 years and older:
- No schooling: 0
- Nursery to 4th grade: 0
- 5th and 6th grade: 1
- 7th and 8th grade: 4
- 9th grade: 0
- 10th grade: 19
- 11th grade: 25
- 12th grade, no diploma: 17
- High school graduate (or equivalency): 231
- Less than 1 year of college: 68
- Some college more than 1 year, no degree: 316
- Associate degree: 161
- Bachelor's degree: 346
- Master's degree: 235
- Professional school degree: 0
- Doctorate degree: 81


Housing units in structures:
- One, detached: 1,233
- One, attached: 295
- Two: 89
- 3 or 4: 90
- 5 to 9: 182
- 10 to 19: 20
- 50 or more: 126
- Mobile homes: 47
Housing units lacking complete kitchen facilities in 2022: 0.7%
House/condo owner moved in on average 15 years ago
Renter moved in on average 3 years ago

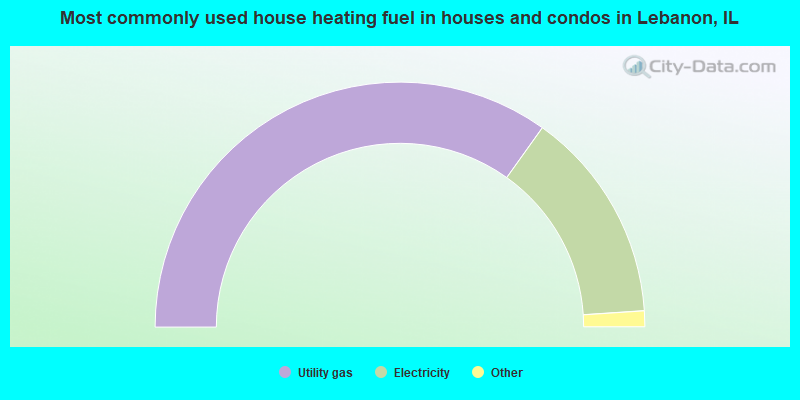
- 69.9%Utility gas
- 28.2%Electricity
- 1.4%Wood
- 0.5%Bottled, tank, or LP gas
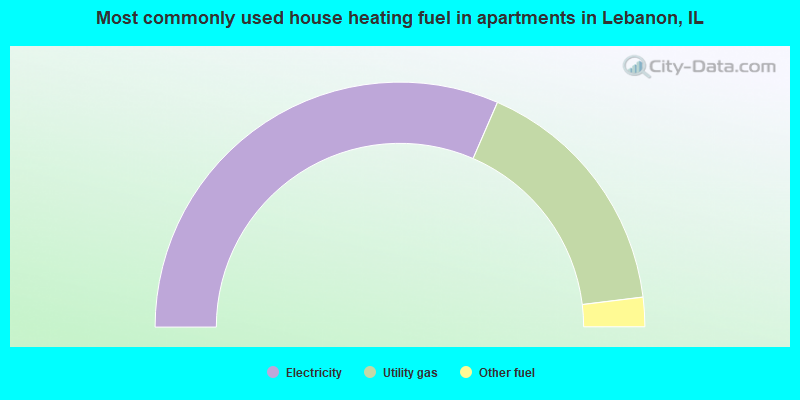
- 63.1%Electricity
- 33.1%Utility gas
- 3.9%Other fuel
Private vs. public school enrollment:
| Here: | 29.1% |
| Illinois: | 13.3% |
| Here: | 10.0% |
| Illinois: | 9.9% |
| Here: | 69.1% |
| Illinois: | 27.4% |


