Las Vegas, NV (Nevada) Houses and Residents
Estimated median house or condo value in 2022: $426,400 (it was $133,100 in 2000 )
Las Vegas:
$426,400Nevada:
$434,700
Lower value quartile - upper value quartile: $324,800 - $595,400Mean price in 2022: Detached houses: $524,761 Here:
$524,761State:
$549,327
Townhouses or other attached units: $347,246 Here:
$347,246State:
$328,893
In 2-unit structures: $211,862 Here:
$211,862State:
$326,466
In 3-to-4-unit structures: $253,432 Here:
$253,432State:
$295,216
In 5-or-more-unit structures: $442,523 Here:
$442,523State:
$297,847
Mobile homes: $31,652 Here:
$31,652State:
$159,995
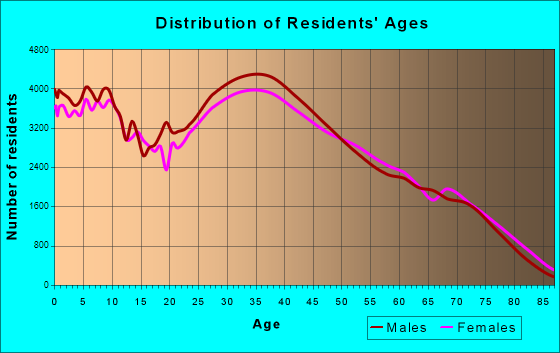
Total population: 613,599 (Urban population: 478,646, Rural population: 222 (all nonfarm) )
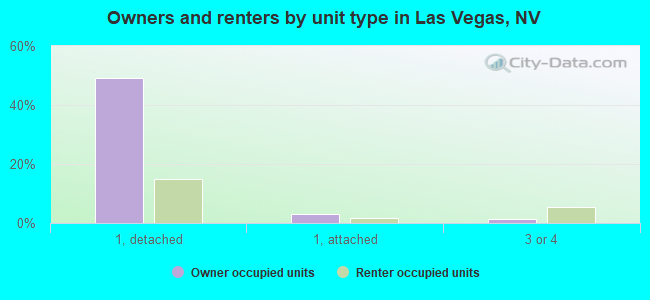
Houses: 262,590 (243,223 occupied: 143,423 owner occupied, 99,800 renter occupied )
% of renters here:
41%State:
40%
Housing density: 2,318 houses/condos per square mile
Median price asked for vacant for-sale houses and condos in 2022: $652,926.
Median contract rent in 2022: $1,277 (lower quartile is $994, upper quartile is $1,670)
Median rent asked for vacant for-rent units in 2022: $938
Median gross rent in Las Vegas, NV in 2022: $1,431
Housing units in Las Vegas with a mortgage: 99,442 (6,271 second mortgage, 263 home equity loan, 4,528 both second mortgage and home equity loan )Houses without a mortgage: 554
Median household income for houses/condos with a mortgage: $95,894
Median household income for apartments without a mortgage: $71,596
Median monthly housing costs: $1,402
Data:
Median house or condo value ($)
Median house or condo value ($ change since 2000)
Median house or condo value ($) - White
Median house or condo value ($) - Black or African American
Median house or condo value ($) - Asian
Median house or condo value ($) - Hispanic or Latino
Median house or condo value ($) - American Indian and Alaska Native
Median house or condo value ($) - Multirace
Median house or condo value ($) - Other Race
Median price asked for mobile homes ($)
Household density (households per square mile)
Mean house or condo value by units in structure - 1, detached ($)
Mean house or condo value by units in structure - 1, attached ($)
Mean house or condo value by units in structure - 2 ($)
Mean house or condo value by units in structure by units in structure - 3 or 4 ($)
Mean house or condo value by units in structure - 5 or more ($)
Mean house or condo value by units in structure - Boat, RV, van, etc. ($)
Mean house or condo value by units in structure - Mobile home ($)
Median contract rent ($)
Median contract rent - Lower quartile ($)
Median contract rent - Upper quartile ($)
Median gross rent ($)
Urban houses (%)
Rural houses (%)
Houses occupied (%)
Houses occupied (% change since 2000)
Houses owner occupied (%)
Houses owner occupied (% change since 2000)
Houses renter occupied (%)
Houses renter occupied (% change since 2000)
Vacant housing units - For rent (%)
Vacant housing units - For rent (% change since 2000)
Vacant housing units - For sale only (%)
Vacant housing units - For sale only (% change since 2000)
Vacant housing units - Rented or sold, not occupied (%)
Vacant housing units - Rented or sold, not occupied (% change since 2000)
Vacant housing units - For seasonal, recreational, or occasional use (%)
Vacant housing units - For seasonal, recreational, or occasional use (% change since 2000)
Vacant housing units - For migrant workers (%)
Vacant housing units - For migrant workers (% change since 2000)
Vacant housing units - Other vacant (%)
Vacant housing units - Other vacant (% change since 2000)
Median monthly housing costs ($)
Median household income for houses/condos with a mortgage ($)
Median household income for houses/condos without a mortgage ($)
Median household income ($)
Median household income ($) - White
Median household income ($) - Black or African American
Median household income ($) - Asian
Median household income ($) - Hispanic or Latino
Median household income ($) - American Indian and Alaska Native
Median household income ($) - Multirace
Median household income ($) - Other Race
Mortgage status - with mortgage (%)
Mortgage status - with second mortgage (%)
Mortgage status - with home equity loan (%)
Mortgage status - with both second mortgage and home equity loan (%)
Mortgage status - without a mortgage (%)
Median year house/condo built
Median year apartment built
Household type by relationship - Male householder living alone (%)
Household type by relationship - Male householder not living alone (%)
Household type by relationship - Female householder living alone (%)
Household type by relationship - Female householder not living alone (%)
Household type by relationship - Opposite-Sex spouse (%)
Household type by relationship - Same-Sex spouse (%)
Household type by relationship - Opposite-Sex unmarried partner (%)
Household type by relationship - Same-Sex unmarried partner (%)
Household type by relationship - In group quarters (%)
Size of family households - 2-person household (%)
Size of family households - 3-person household (%)
Size of family households - 4-person household (%)
Size of family households - 5-person household (%)
Size of family households - 6-person household (%)
Size of family households - 7-or-more-person household (%)
Size of nonfamily households - 1-person household (%)
Size of nonfamily households - 2-person household (%)
Size of nonfamily households - 3-person household (%)
Size of nonfamily households - 4-person household (%)
Size of nonfamily households - 5-person household (%)
Size of nonfamily households - 6-person household (%)
Size of nonfamily households - 7-or-moreperson household (%)
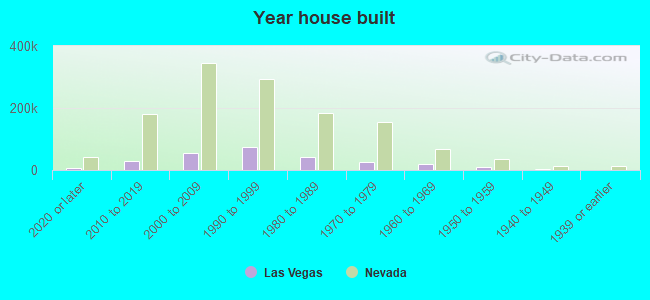
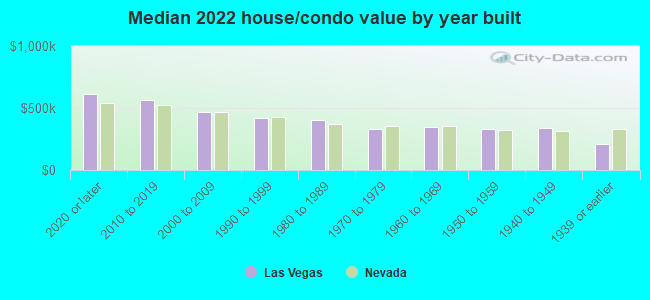
Year house built - Built 2010 or later (%)
Year house built - Built 2000 to 2009 (%)
Year house built - Built 1990 to 1999 (%)
Year house built - Built 1980 to 1989 (%)
Year house built - Built 1970 to 1979 (%)
Year house built - Built 1960 to 1969 (%)
Year house built - Built 1950 to 1959 (%)
Year house built - Built 1940 to 1949 (%)
Year house built - Built 1939 or earlier (%)
Median number of rooms in houses and condos
Median number of rooms in apartments
Median number of bedrooms in owner occupied houses
Mean number of bedrooms in owner occupied houses
Median number of bedrooms in renter occupied houses
Mean number of bedrooms in renter occupied houses
Median number of vehichles in owner occupied houses
Mean number of vehichles in owner occupied houses
Median number of vehichles in renter occupied houses
Mean number of vehichles in renter occupied houses
Rooms in owner-occupied houses - 1 room (%)
Rooms in owner-occupied houses - 2 rooms (%)
Rooms in owner-occupied houses - 3 rooms (%)
Rooms in owner-occupied houses - 4 rooms (%)
Rooms in owner-occupied houses - 5 rooms (%)
Rooms in owner-occupied houses - 6 rooms (%)
Rooms in owner-occupied houses - 7 rooms (%)
Rooms in owner-occupied houses - 8 rooms (%)
Rooms in owner-occupied houses - 9+ rooms (%)
Rooms in renter-occupied houses - 1 room (%)
Rooms in renter-occupied houses - 2 rooms (%)
Rooms in renter-occupied houses - 3 rooms (%)
Rooms in renter-occupied houses - 4 rooms (%)
Rooms in renter-occupied houses - 5 rooms (%)
Rooms in renter-occupied houses - 6 rooms (%)
Rooms in renter-occupied houses - 7 rooms (%)
Rooms in renter-occupied houses - 8 rooms (%)
Rooms in renter-occupied houses - 9+ rooms (%)
Bedrooms in owner-occupied houses - no bedrooms (%)
Bedrooms in owner-occupied houses - 1 bedroom (%)
Bedrooms in owner-occupied houses - 2 bedrooms (%)
Bedrooms in owner-occupied houses - 3 bedrooms (%)
Bedrooms in owner-occupied houses - 4 bedrooms (%)
Bedrooms in owner-occupied houses - 5+ bedrooms (%)
Bedrooms in renter-occupied houses - no bedrooms (%)
Bedrooms in renter-occupied houses - 1 bedroom (%)
Bedrooms in renter-occupied houses - 2 bedrooms (%)
Bedrooms in renter-occupied houses - 3 bedrooms (%)
Bedrooms in renter-occupied houses - 4 bedrooms (%)
Bedrooms in renter-occupied houses - 5+ bedrooms (%)
Vehicles available in owner-occupied houses - no vehicle available (%)
Vehicles available in owner-occupied houses - 1 vehicle available(%)
Vehicles available in owner-occupied houses - 2 Vehicles available (%)
Vehicles available in owner-occupied houses - 3 Vehicles available (%)
Vehicles available in owner-occupied houses - 4 Vehicles available (%)
Vehicles available in owner-occupied houses - 5+ Vehicles available (%)
Vehicles available in renter-occupied houses - no vehicle available (%)
Vehicles available in renter-occupied houses - 1 vehicle available (%)
Vehicles available in renter-occupied houses - 2 Vehicles available (%)
Vehicles available in renter-occupied houses - 3 Vehicles available (%)
Vehicles available in renter-occupied houses - 4 Vehicles available (%)
Vehicles available in renter-occupied houses - 5+ Vehicles available (%)
Housing units in structures - 1, detached (%)
Housing units in structures - 1, attached (%)
Housing units in structures - 2 (%)
Housing units in structures - 3 or 4 (%)
Housing units in structures - 5 to 9 (%)
Housing units in structures - 10 to 19 (%)
Housing units in structures - 20 to 49 (%)
Housing units in structures - 50 or more (%)
Housing units in structures - Mobile home (%)
Housing units in structures - Boat, RV, van, etc. (%)
Housing units in structures - Owners - 1, detached (%)
Housing units in structures - Owners - 1, attached (%)
Housing units in structures - Owners - 2 (%)
Housing units in structures - Owners - 3 or 4 (%)
Housing units in structures - Owners - 5 to 9 (%)
Housing units in structures - Owners - 10 to 19 (%)
Housing units in structures - Owners - 20 to 49 (%)
Housing units in structures - Owners - 50 or more (%)
Housing units in structures - Owners - Mobile home (%)
Housing units in structures - Owners - Boat, RV, van, etc. (%)
Housing units in structures - Renters - 1, detached (%)
Housing units in structures - Renters - 1, attached (%)
Housing units in structures - Renters - 2 (%)
Housing units in structures - Renters - 3 or 4 (%)
Housing units in structures - Renters - 5 to 9 (%)
Housing units in structures - Renters - 10 to 19 (%)
Housing units in structures - Renters - 20 to 49 (%)
Housing units in structures - Renters - 50 or more (%)
Housing units in structures - Renters - Mobile home (%)
Housing units in structures - Renters - Boat, RV, van, etc. (%)
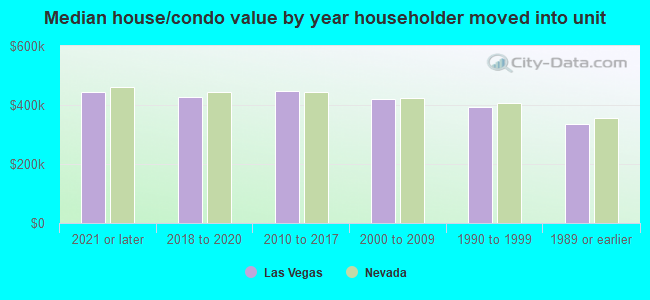
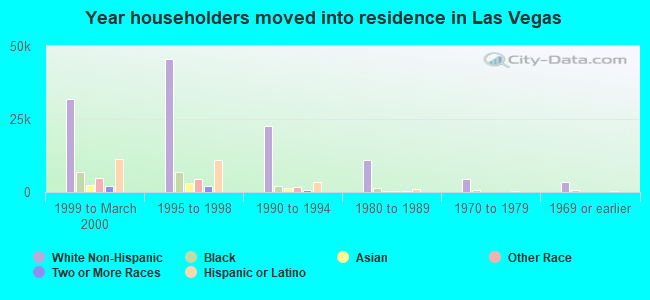
House/condo owner moved in on average (years ago)
Renter moved in on average (years ago)
Year householder moved into unit - Moved in 1999 to March 2000 (%)
Year householder moved into unit - Moved in 1999 to March 2000 (%) - White
Year householder moved into unit - Moved in 1999 to March 2000 (%) - Black or African American
Year householder moved into unit - Moved in 1999 to March 2000 (%) - Asian
Year householder moved into unit - Moved in 1999 to March 2000 (%) - Hispanic or Latino
Year householder moved into unit - Moved in 1999 to March 2000 (%) - American Indian and Alaska Native
Year householder moved into unit - Moved in 1999 to March 2000 (%) - Multirace
Year householder moved into unit - Moved in 1999 to March 2000 (%) - Other Race
Year householder moved into unit - Moved in 1995 to 1998 (%)
Year householder moved into unit - Moved in 1995 to 1998 (%) - White
Year householder moved into unit - Moved in 1995 to 1998 (%) - Black or African American
Year householder moved into unit - Moved in 1995 to 1998 (%) - Asian
Year householder moved into unit - Moved in 1995 to 1998 (%) - Hispanic or Latino
Year householder moved into unit - Moved in 1995 to 1998 (%) - American Indian and Alaska Native
Year householder moved into unit - Moved in 1995 to 1998 (%) - Multirace
Year householder moved into unit - Moved in 1995 to 1998 (%) - Other Race
Year householder moved into unit - Moved in 1990 to 1994 (%)
Year householder moved into unit - Moved in 1990 to 1994 (%) - White
Year householder moved into unit - Moved in 1990 to 1994 (%) - Black or African American
Year householder moved into unit - Moved in 1990 to 1994 (%) - Asian
Year householder moved into unit - Moved in 1990 to 1994 (%) - Hispanic or Latino
Year householder moved into unit - Moved in 1990 to 1994 (%) - American Indian and Alaska Native
Year householder moved into unit - Moved in 1990 to 1994 (%) - Multirace
Year householder moved into unit - Moved in 1990 to 1994 (%) - Other Race
Year householder moved into unit - Moved in 1980 to 1989 (%)
Year householder moved into unit - Moved in 1980 to 1989 (%) - White
Year householder moved into unit - Moved in 1980 to 1989 (%) - Black or African American
Year householder moved into unit - Moved in 1980 to 1989 (%) - Asian
Year householder moved into unit - Moved in 1980 to 1989 (%) - Hispanic or Latino
Year householder moved into unit - Moved in 1980 to 1989 (%) - American Indian and Alaska Native
Year householder moved into unit - Moved in 1980 to 1989 (%) - Multirace
Year householder moved into unit - Moved in 1980 to 1989 (%) - Other Race
Year householder moved into unit - Moved in 1970 to 1979 (%)
Year householder moved into unit - Moved in 1970 to 1979 (%) - White
Year householder moved into unit - Moved in 1970 to 1979 (%) - Black or African American
Year householder moved into unit - Moved in 1970 to 1979 (%) - Asian
Year householder moved into unit - Moved in 1970 to 1979 (%) - Hispanic or Latino
Year householder moved into unit - Moved in 1970 to 1979 (%) - American Indian and Alaska Native
Year householder moved into unit - Moved in 1970 to 1979 (%) - Multirace
Year householder moved into unit - Moved in 1970 to 1979 (%) - Other Race
Year householder moved into unit - Moved in 1969 or earlier (%)
Year householder moved into unit - Moved in 1969 or earlier (%) - White
Year householder moved into unit - Moved in 1969 or earlier (%) - Black or African American
Year householder moved into unit - Moved in 1969 or earlier (%) - Asian
Year householder moved into unit - Moved in 1969 or earlier (%) - Hispanic or Latino
Year householder moved into unit - Moved in 1969 or earlier (%) - American Indian and Alaska Native
Year householder moved into unit - Moved in 1969 or earlier (%) - Multirace
Year householder moved into unit - Moved in 1969 or earlier (%) - Other Race
Housing units lacking complete plumbing facilities (%)
Housing units lacking complete kitchen facilities (%)
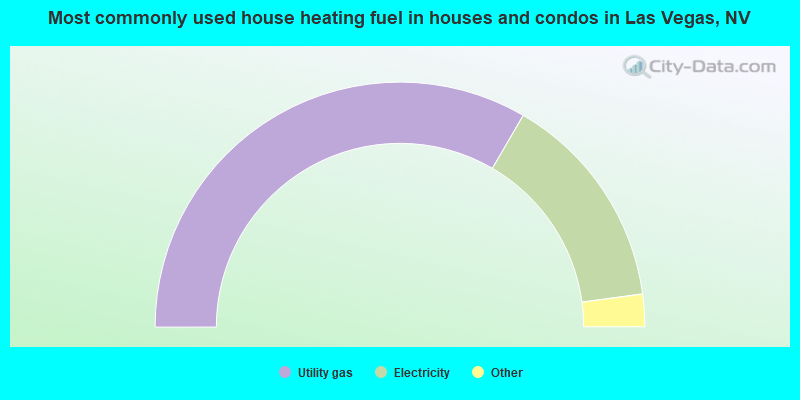
House heating fuel used in houses and condos - Utility gas (%)
House heating fuel used in houses and condos - Bottled, tank, or LP gas (%)
House heating fuel used in houses and condos - Electricity (%)
House heating fuel used in houses and condos - Fuel oil, kerosene, etc. (%)
House heating fuel used in houses and condos - Coal or coke (%)
House heating fuel used in houses and condos - Wood (%)
House heating fuel used in houses and condos - Solar energy (%)
House heating fuel used in houses and condos - Other fuel (%)
House heating fuel used in houses and condos - No fuel used (%)
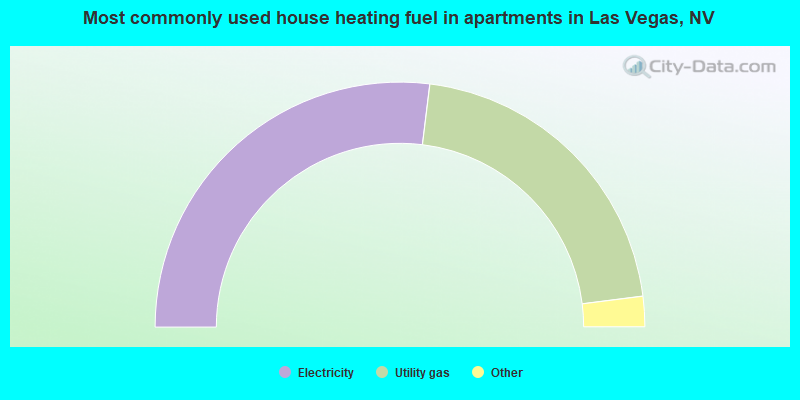
House heating fuel used in apartments - Utility gas (%)
House heating fuel used in apartments - Bottled, tank, or LP gas (%)
House heating fuel used in apartments - Electricity (%)
House heating fuel used in apartments - Fuel oil, kerosene, etc. (%)
House heating fuel used in apartments - Coal or coke (%)
House heating fuel used in apartments - Wood (%)
House heating fuel used in apartments - Solar energy (%)
House heating fuel used in apartments - Other fuel (%)
House heating fuel used in apartments - No fuel used (%)
Median year house/condo built: 1996Median year apartment built: 1993Household type by relationship:
Households: 656,302
Male householders: 123,030 (35,353 living alone ), Female householders: 120,193 (34,199 living alone )98,559 spouses (96,255 opposite-sex spouses ), 21,370 unmarried partners , (19,754 opposite-sex unmarried partners ), 190,829 children (177,282 natural , 3,634 adopted , 9,913 stepchildren ), 20,581 grandchildren , 13,330 brothers or sisters , 22,109 parents , 177 foster children , 17,797 other relatives , 23,159 non-relatives In group quarters: 5,168
Size of family households: 60,505 2-persons , 37,060 3-persons , 28,542 4-persons , 16,904 5-persons , 8,006 6-persons , 4,692 7-or-more-persons .
Size of nonfamily households: 69,552 1-person , 15,471 2-persons , 1,563 3-persons , 472 4-persons , 69 5-persons , 344 6-persons , 43 7-or-more-persons .
77,087 married couples with children. single-parent households (11,652 men , 33,321 women ).
66.0% of residents of Las Vegas speak English at home. of residents speak Spanish at home (59% speak English very well , 17% speak English well , 17% speak English not well , 7% don't speak English at all ).of residents speak other Indo-European language at home (73% speak English very well , 18% speak English well , 8% speak English not well , 1% don't speak English at all ).of residents speak Asian or Pacific Island language at home (66% speak English very well , 25% speak English well , 9% speak English not well , 1% don't speak English at all ).of residents speak other language at home (78% speak English very well , 16% speak English well , 6% speak English not well ).
Foreign born population: 137,706 (21.0%)of them are naturalized citizens )
Median number of rooms in houses and condos:
Median number of rooms in apartments
Owner-occupied Renter-occupied
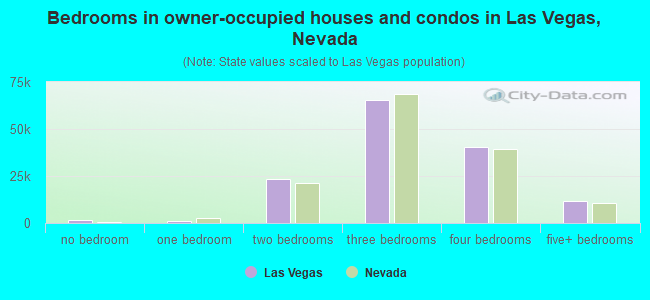
Bedrooms in owner-occupied houses and condos in Las Vegas, Nevada
1,538 no bedroom 1,018 1 bedroom 23,495 2 bedrooms 65,305 3 bedrooms 40,568 4 bedrooms 11,499 5+ bedrooms
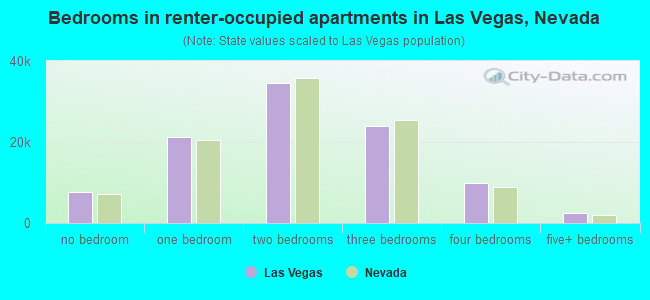
Bedrooms in renter-occupied apartments in Las Vegas, Nevada
7,742 no bedroom 21,145 1 bedroom 34,571 2 bedrooms 23,986 3 bedrooms 9,973 4 bedrooms 2,383 5+ bedrooms
Owner-occupied Renter-occupied
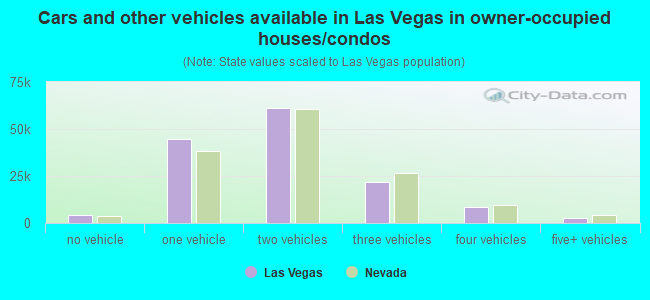
Cars and other vehicles available in Las Vegas in owner-occupied houses/condos
4,298 no vehicle 44,717 1 vehicle 61,277 2 vehicles 21,889 3 vehicles 8,529 4 vehicles 2,713 5+ vehicles
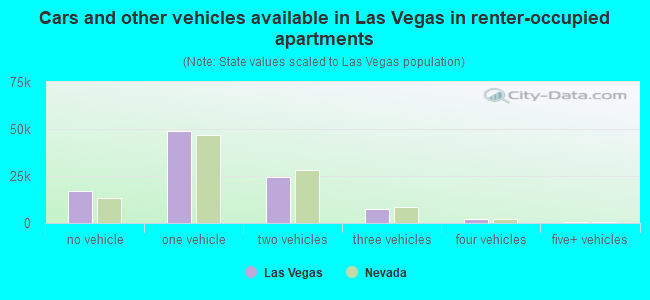
Cars and other vehicles available in Las Vegas in renter-occupied apartments
16,964 no vehicle 48,713 1 vehicle 24,214 2 vehicles 7,258 3 vehicles 2,331 4 vehicles 320 5+ vehicles
Owner-occupied Renter-occupied
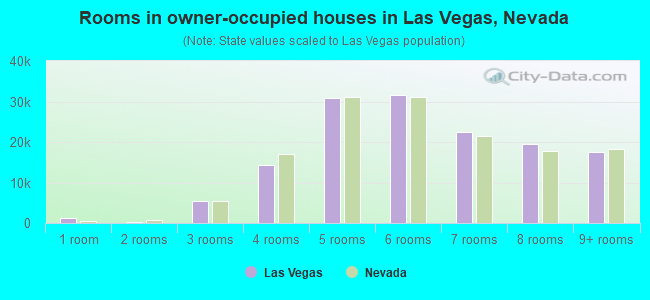
Rooms in owner-occupied houses in Las Vegas, Nevada
1,351 1 room 135 2 rooms 5,528 3 rooms 14,444 4 rooms 30,763 5 rooms 31,578 6 rooms 22,572 7 rooms 19,460 8 rooms 17,592 9+ rooms
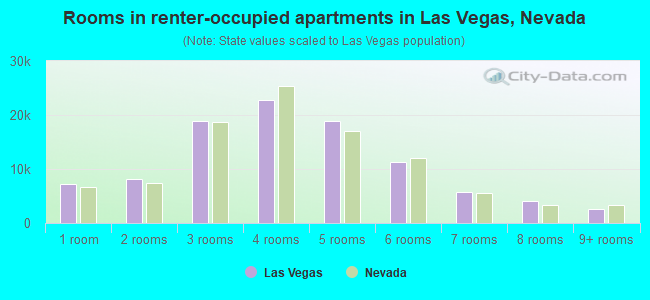
Rooms in renter-occupied apartments in Las Vegas, Nevada
7,268 1 room 8,185 2 rooms 18,959 3 rooms 22,831 4 rooms 18,807 5 rooms 11,303 6 rooms 5,699 7 rooms 4,139 8 rooms 2,609 9+ rooms
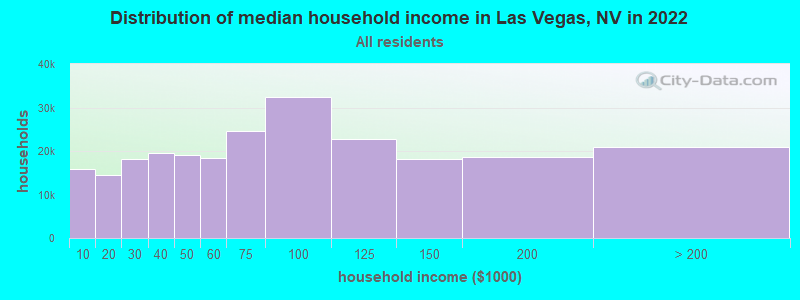
Las Vegas, NV household income distribution 15,905 Less than $10,00014,473 $10,000 to $19,99918,118 $20,000 to $29,99919,466 $30,000 to $39,99919,185 $40,000 to $49,99918,384 $50,000 to $59,99924,682 $60,000 to $74,99932,381 $75,000 to $99,99922,673 $100,000 to $124,99918,264 $125,000 to $149,99918,703 $150,000 to $199,99920,989 $200,000 or more
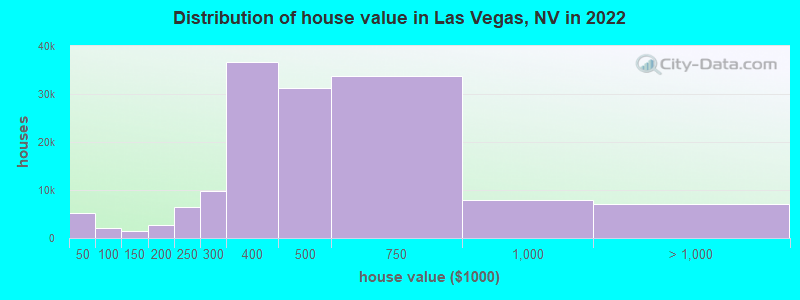
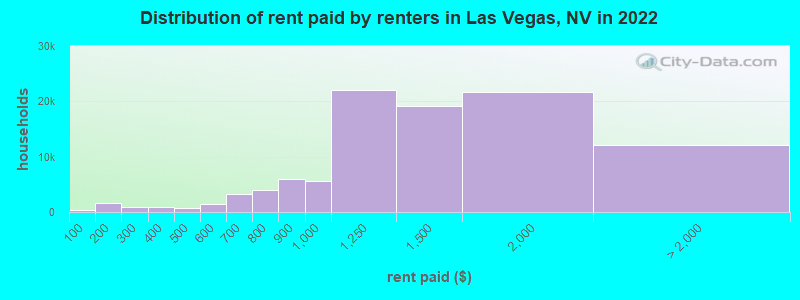
Home value of owner - occupied houses in 2022 in Las Vegas, NV 1,909 Less than $10,000125 $10,000 to $14,999751 $15,000 to $19,999424 $20,000 to $24,999486 $25,000 to $29,999426 $30,000 to $34,999311 $35,000 to $39,999801 $40,000 to $49,999472 $50,000 to $59,99937 $60,000 to $69,999311 $70,000 to $79,999220 $80,000 to $89,999211 $90,000 to $99,999877 $100,000 to $124,999580 $125,000 to $149,9991,756 $150,000 to $174,999863 $175,000 to $199,9996,395 $200,000 to $249,9999,793 $250,000 to $299,99936,748 $300,000 to $399,99931,177 $400,000 to $499,99933,790 $500,000 to $749,9997,830 $750,000 to $999,9993,953 $1,000,000 to $1,499,9991,901 $1,500,000 to $1,999,9991,276 $2,000,000 or moreRent paid by renters in 2022 in Las Vegas, NV 428 Less than $1001,620 $150 to $199618 $200 to $249294 $250 to $299582 $300 to $349352 $350 to $399353 $400 to $449285 $450 to $499863 $500 to $549610 $550 to $5992,154 $600 to $6491,148 $650 to $6991,881 $700 to $7492,109 $750 to $7995,971 $800 to $8995,516 $900 to $99922,061 $1,000 to $1,24919,220 $1,250 to $1,49921,616 $1,500 to $1,9996,555 $2,000 to $2,4992,564 $2,500 to $2,999667 $3,000 to $3,499435 $3,500 or more1,898 No cash rent
Percentage of workers working in this county: 98.0%Number of people working at home: 39,152 (12.8% of all workers )
Travel time to work (commute)
Less than 5 minutes: 3,8955 to 9 minutes: 16,48410 to 14 minutes: 26,87215 to 19 minutes: 37,89620 to 24 minutes: 51,55925 to 29 minutes: 28,22330 to 34 minutes: 54,19435 to 39 minutes: 10,08340 to 44 minutes: 11,86045 to 59 minutes: 14,60260 to 89 minutes: 6,17990 or more minutes: 4,439
Means of transportation to work:
Drove a car alone: 259,416 (71.1%)Carpooled: 39,697 (10.9%)Bus : 9,431 (2.6%)Taxi: 11,803 (3.2%)Bicycle: 493 (0.1%)Walked: 4,752 (1.3%)Worked at home: 39,152 (10.7%)
Unemployment by race in 2022
Unemployment rate for White non-Hispanic residents 4.8% Males3.3% FemalesUnemployment rate for Black residents 11.9% Males10.1% FemalesUnemployment rate for American Indian and Alaska Native residents 10.6% Males8.9% FemalesUnemployment rate for Asian residents 5.1% Males2.1% FemalesUnemployment rate for other race residents 5.6% Males5.6% FemalesUnemployment rate for two or more race residents 3.9% Males6.5% FemalesUnemployment rate for Hispanic or Latino residents 4.8% Males5.7% Females
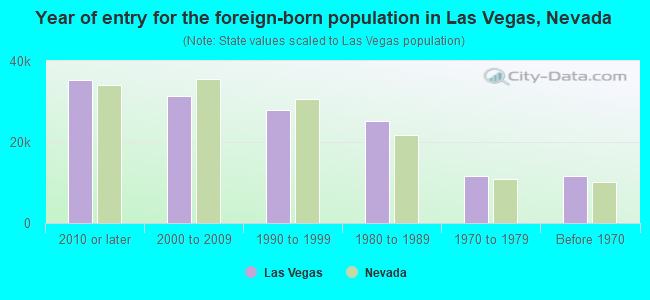
Year of entry for the foreign-born population in Las Vegas, Nevada
35,232 2010 or later 31,480 2000 to 2009 27,805 1990 to 1999 25,211 1980 to 1989 11,604 1970 to 1979 11,539 Before 1970
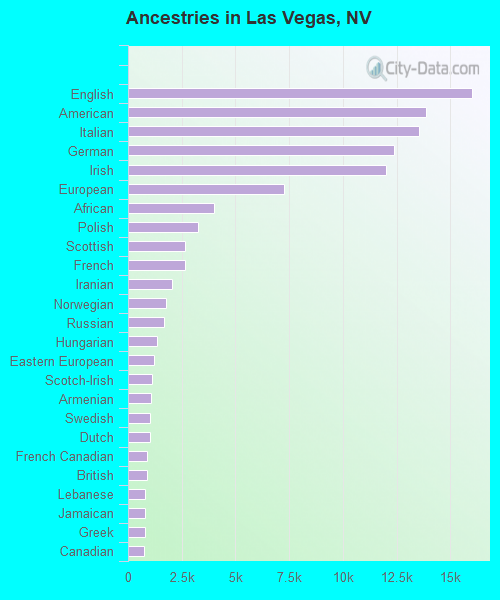
First ancestries reported:
English: 16,003 (4.2%)
American: 13,864 (3.6%)
Italian: 13,563 (3.5%)
German: 12,393 (3.2%)
Irish: 11,994 (3.1%)
European: 7,270 (1.9%)
African: 4,019 (1.0%)
Polish: 3,273 (0.9%)
Scottish: 2,635 (0.7%)
French: 2,631 (0.7%)
Iranian: 2,043 (0.5%)
Norwegian: 1,789 (0.5%)
Russian: 1,687 (0.4%)
Hungarian: 1,357 (0.4%)
Eastern European: 1,231 (0.3%)
Scotch-Irish: 1,095 (0.3%)
Armenian: 1,078 (0.3%)
Swedish: 1,047 (0.3%)
Dutch: 1,006 (0.3%)
French Canadian: 884 (0.2%)
British: 880 (0.2%)
Lebanese: 803 (0.2%)
Jamaican: 793 (0.2%)
Greek: 788 (0.2%)
Canadian: 760 (0.2%)
Danish: 720 (0.2%)
Portuguese: 701 (0.2%)
Romanian: 673 (0.2%)
Ukrainian: 562 (0.1%)
Israeli: 527 (0.1%)
Czech: 499 (0.1%)
Brazilian: 488 (0.1%)
Haitian: 443 (0.1%)
Kenyan: 408 (0.1%)
Ethiopian: 407 (0.1%)
Nigerian: 407 (0.1%)
Scandinavian: 404 (0.1%)
Belizean: 403 (0.1%)
Palestinian: 383 (0.10%)
Bulgarian: 382 (0.10%)
Finnish: 351 (0.09%)
Serbian: 336 (0.09%)
Northern European: 325 (0.08%)
Iraqi: 281 (0.07%)
Swiss: 259 (0.07%)
Egyptian: 250 (0.07%)
Welsh: 222 (0.06%)
Lithuanian: 220 (0.06%)
Arab: 217 (0.06%)
Czechoslovakian: 207 (0.05%)
Slavic: 194 (0.05%)
Jordanian: 189 (0.05%)
Turkish: 180 (0.05%)
Slovak: 179 (0.05%)
Austrian: 173 (0.05%)
German Russian: 171 (0.04%)
Moroccan: 153 (0.04%)
Australian: 150 (0.04%)
Cape Verdean: 140 (0.04%)
Croatian: 119 (0.03%)
South African: 118 (0.03%)
Albanian: 98 (0.03%)
Assyrian: 96 (0.03%)
Slovene: 94 (0.02%)
Yugoslavian: 92 (0.02%)
Belgian: 85 (0.02%)
West Indian: 83 (0.02%)
Pennsylvania German: 77 (0.02%)
Somali: 76 (0.02%)
Afghan: 63 (0.02%)
New Zealander: 53 (0.01%)
Macedonian: 50 (0.01%)
Liberian: 40 (0.01%)
Latvian: 35 (0.01%)
Basque: 31 (0.01%)
Maltese: 31 (0.01%)
British West Indian: 30 (0.01%)
Icelander: 28 (0.01%)
U.S. Virgin Islander: 28 (0.01%)
Celtic: 27 (0.01%)
Cajun: 25 (0.01%)
Estonian: 23 (0.01%)
Most common places of birth for foreign-born residents (%): Mexico Las Vegas:
40.4% (55,441)Nevada:
36.8% (218,248)
Philippines Las Vegas:
13.5% (18,481)Nevada:
15.5% (91,628)
Cuba Las Vegas:
6.1% (8,355)Nevada:
4.2% (24,711)
El Salvador Las Vegas:
4.6% (6,373)Nevada:
4.0% (23,923)
Guatemala Las Vegas:
2.5% (3,406)Nevada:
2.4% (14,384)
Canada Las Vegas:
2.1% (2,939)Nevada:
1.9% (11,407)
Iran Las Vegas:
2.1% (2,899)Nevada:
0.9% (5,149)
China, excluding Hong Kong and Taiwan Las Vegas:
1.9% (2,674)Nevada:
3.3% (19,621)
Place of birth for U.S.-born residents:
This state: 179,316Other state: 326,905Northeast: 43,219Midwest: 64,410South: 54,287West: 164,989 86.0% of Las Vegas residents lived in the same house 1 years ago.
Out of people who lived in different houses, 40.8% lived in this county.
Out of people who lived in different counties, 6.8% lived in Nevada.
Las Vegas:
86.0%State average:
86.4%
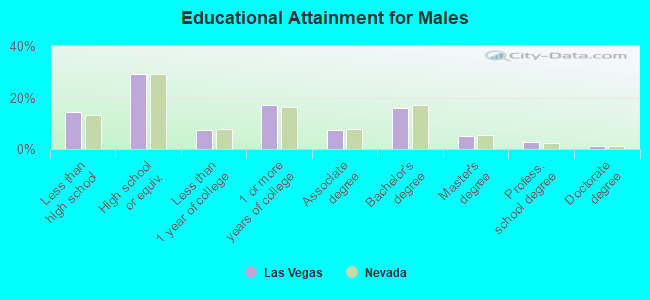
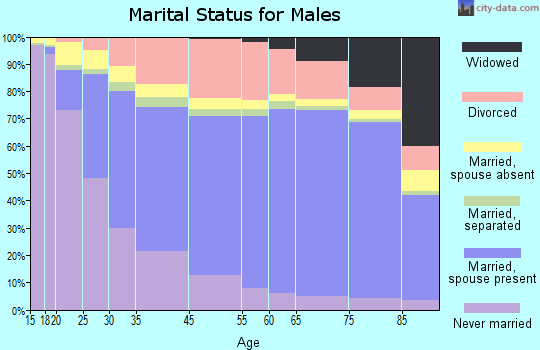
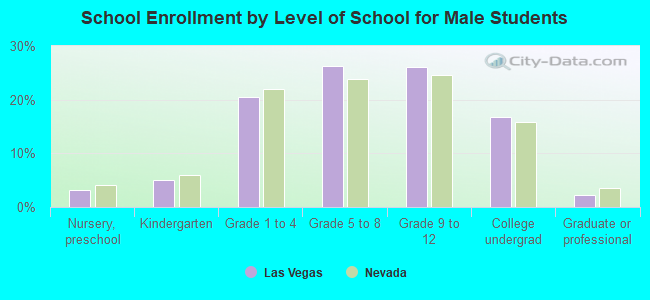
Education attainment for males 25 years and older:
No schooling: 6,172Nursery to 4th grade: 1,7945th and 6th grade: 3,9477th and 8th grade: 2,8309th grade: 3,42910th grade: 2,78411th grade: 3,29312th grade, no diploma: 7,688High school graduate (or equivalency): 65,085Less than 1 year of college: 16,285Some college more than 1 year, no degree: 38,072Associate degree: 16,315Bachelor's degree: 35,726Master's degree: 11,195Professional school degree: 6,147Doctorate degree: 2,805
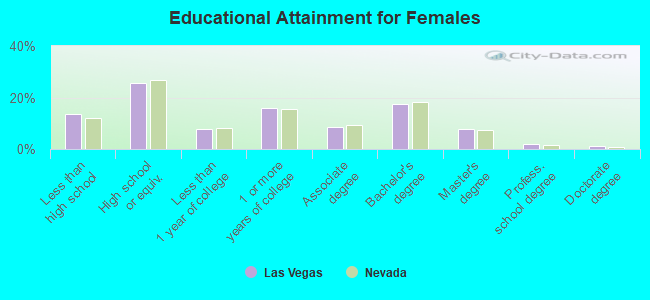
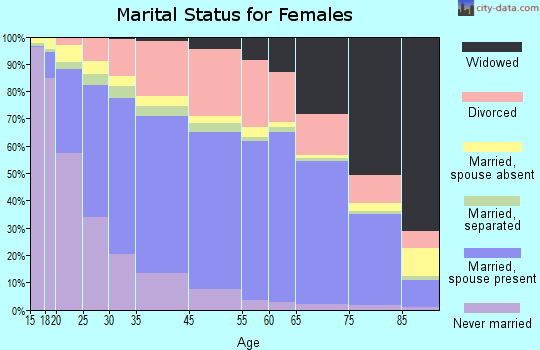
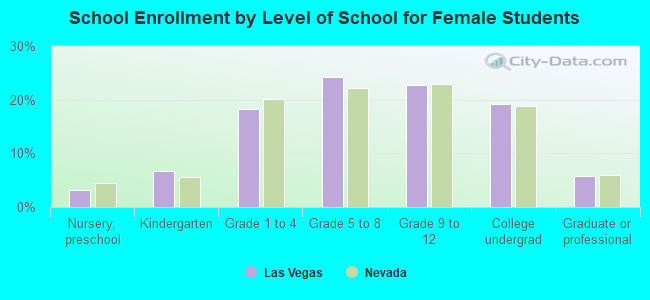
Education attainment for females 25 years and older:
No schooling: 6,720Nursery to 4th grade: 1,1995th and 6th grade: 4,4247th and 8th grade: 2,4759th grade: 2,19310th grade: 2,53211th grade: 3,24112th grade, no diploma: 7,922High school graduate (or equivalency): 57,608Less than 1 year of college: 17,521Some college more than 1 year, no degree: 35,941Associate degree: 19,514Bachelor's degree: 39,676Master's degree: 17,661Professional school degree: 4,498Doctorate degree: 2,336
Housing units in structures:
One, detached: 165,832One, attached: 14,806Two: 2,9413 or 4: 17,1595 to 9: 20,79110 to 19: 10,63920 to 49: 8,26150 or more: 17,985Mobile homes: 4,075Boats, RVs, vans, etc.: 101Median worth of mobile homes: $28,100
Housing units lacking complete plumbing facilities in 2022: 1.0%Housing units lacking complete kitchen facilities in 2022: 1.3%House/condo owner moved in on average 7 years ago
Renter moved in on average 2 years ago
Private vs. public school enrollment:
Students in private schools in grades 1 to 8 (elementary and middle school): 9,637 Students in private schools in grades 9 to 12 (high school): 3,854 Students in private undergraduate colleges: 5,030