Lanesboro, PA (Pennsylvania) Houses and Residents
| Lanesboro: | $120,254 |
| Pennsylvania: | $245,500 |
Mean price in 2022:
Detached houses: $213,680
Here: $213,680 State: $317,202 Mobile homes: $85,717
Here: $85,717 State: $92,414
Total population: 484 (Urban population: 333 (all inside urban clusters), Rural population: 292 (7 farm, 285 nonfarm))
Houses: 256 (223 occupied: 107 owner occupied, 118 renter occupied)
| % of renters here: | 52% |
| State: | 31% |
Housing density: 100 houses/condos per square mile
Median price asked for vacant for-sale houses and condos in 2022 in this county: $172,709.
Median contract rent in 2022: $682 (lower quartile is $381, upper quartile is $963)
Median rent asked for vacant for-rent units in 2022: $727
Median gross rent in Lanesboro, PA in 2022: $980
Housing units in Lanesboro with a mortgage: 37 (1 second mortgage, 0 home equity loan, 1 both second mortgage and home equity loan)
Houses without a mortgage: 3
Median household income for houses/condos with a mortgage: $78,701
Median household income for apartments without a mortgage: $45,233
Median monthly housing costs: $746
Compare current foreclosures near Lanesboro, PA:
| Photo | Address | Area | Beds / Baths | Price | Details |
|---|---|---|---|---|---|

|
#1
Viaduct St
Susquehanna, PA 18847
|
2,200 sq. feet
|
2 baths 4 beds |
$189,500
|
show details |

|
#2
State Route 7
Nineveh, NY 13813
|
2,453 sq. feet
|
2 baths 5 beds |
show details | |

|
#3
State Route 171
Susquehanna, PA 18847
|
- sq. feet
|
2 baths 3 beds |
show details | |

|
#4
Dublin St
Deposit, NY 13754
|
1,358 sq. feet
|
1 baths 3 beds |
show details | |

|
#5
Lovejoy Rd
Harpursville, NY 13787
|
1,141 sq. feet
|
1 baths 3 beds |
show details | |

|
#6
Powers Rd
Conklin, NY 13748
|
1,248 sq. feet
|
1 baths 3 beds |
show details | |

|
#7
Colesville Rd
Binghamton, NY 13904
|
1,684 sq. feet
|
3 baths 3 beds |
show details | |

|
#8
Muckey Rd
Binghamton, NY 13903
|
960 sq. feet
|
1 baths 2 beds |
show details | |

|
#9
Lord Rd
Nineveh, NY 13813
|
1,247 sq. feet
|
1 baths 3 beds |
show details | |

|
#10
Leslie Ave
Conklin, NY 13748
|
1,401 sq. feet
|
2 baths 2 beds |
show details |
| Photo | Address | Area | Beds / Baths | Price | Details |
|---|---|---|---|---|---|

|
#11
Us Route 11
Kirkwood, NY 13795
|
1,370 sq. feet
|
1 baths 3 beds |
show details | |

|
#12
Ostrum Rd
Kirkwood, NY 13795
|
1,108 sq. feet
|
1 baths 3 beds |
show details | |

|
#13
North Rd
Windsor, NY 13865
|
885 sq. feet
|
1 baths 3 beds |
show details | |

|
#14
Rowe Rd
Harpursville, NY 13787
|
1,848 sq. feet
|
1 baths 3 beds |
show details | |

|
#15
Welton St
Harpursville, NY 13787
|
2,400 sq. feet
|
2 baths 3 beds |
show details | |

|
#16
Johnson Rd
Kirkwood, NY 13795
|
1,734 sq. feet
|
2 baths 3 beds |
show details | |

|
#17
Us Route 11
Kirkwood, NY 13795
|
1,440 sq. feet
|
1 baths 3 beds |
show details | |

|
#18
Trim St
Windsor, NY 13865
|
1,470 sq. feet
|
1 baths 2 beds |
show details | |

|
#19
Old Route 17
Deposit, NY 13754
|
1,232 sq. feet
|
1 baths 4 beds |
show details | |

|
#20
Main St
Windsor, NY 13865
|
1,083 sq. feet
|
1 baths 2 beds |
show details |
| Photo | Address | Area | Beds / Baths | Price | Details |
|---|---|---|---|---|---|

|
#21
Depot St
Port Crane, NY 13833
|
2,599 sq. feet
|
1 baths 5 beds |
show details | |

|
#22
Hawkins Rd
Nineveh, NY 13813
|
- sq. feet
|
- baths - beds |
show details | |

|
#23
State Route 706
Montrose, PA 18801
|
- sq. feet
|
- baths - beds |
show details | |

|
#24
Franklin Hill Rd
Hallstead, PA 18822
|
- sq. feet
|
- baths - beds |
show details | |

|
#25
Bradley Ave
Conklin, NY 13748
|
- sq. feet
|
- baths - beds |
show details | |

|
#26
Quilty Hill Rd
Kirkwood, NY 13795
|
980 sq. feet
|
- baths - beds |
show details | |

|
#27
Sheldon Rd
Susquehanna, PA 18847
|
- sq. feet
|
- baths - beds |
show details | |

|
#28
State Route 171
Susquehanna, PA 18847
|
- sq. feet
|
- baths - beds |
show details | |

|
#29
9th St
Union Dale, PA 18470
|
- sq. feet
|
- baths - beds |
show details | |

|
#30
Payne Rd
Kingsley, PA 18826
|
- sq. feet
|
- baths - beds |
show details |
| Photo | Address | Area | Beds / Baths | Price | Details |
|---|---|---|---|---|---|

|
#31
Conklin Rd
Conklin, NY 13748
|
924 sq. feet
|
- baths - beds |
show details | |

|
#32
Frances St Apt 5
Kirkwood, NY 13795
|
- sq. feet
|
- baths - beds |
show details | |

|
#33
Wallerville Rd
Lake Como, PA 18437
|
- sq. feet
|
- baths - beds |
show details | |

|
#34
Cumber Rd
Harpursville, NY 13787
|
- sq. feet
|
- baths - beds |
show details | |

|
#35
Cumber Rd
Harpursville, NY 13787
|
- sq. feet
|
- baths - beds |
show details | |

|
#36
Martin Hill Rd
Harpursville, NY 13787
|
- sq. feet
|
- baths - beds |
show details | |

|
#37
High School Rd
Montrose, PA 18801
|
- sq. feet
|
- baths - beds |
show details | |

|
#38
Hickox Rd
Harpursville, NY 13787
|
- sq. feet
|
- baths - beds |
show details | |

|
#39
Maple Grove Rd
Starrucca, PA 18462
|
- sq. feet
|
- baths - beds |
show details | |

|
#40
Hardie Rd
Conklin, NY 13748
|
- sq. feet
|
- baths - beds |
show details |
| Photo | Address | Area | Beds / Baths | Price | Details |
|---|---|---|---|---|---|

|
#41
Route 41
Nineveh, NY 13813
|
- sq. feet
|
- baths - beds |
show details | |

|
#42
Stearns Rd
New Milford, PA 18834
|
- sq. feet
|
- baths - beds |
show details | |

|
#43
State Route 492
New Milford, PA 18834
|
- sq. feet
|
- baths - beds |
show details | |

|
#44
Fair Hill Rd
Harford, PA 18823
|
- sq. feet
|
- baths - beds |
show details | |

|
#45
Powers Rd
Conklin, NY 13748
|
- sq. feet
|
- baths - beds |
show details | |

|
#46
Roods Creek Rd
Hancock, NY 13783
|
- sq. feet
|
- baths - beds |
show details | |

|
#47
Roxbury St
Conklin, NY 13748
|
- sq. feet
|
- baths - beds |
show details | |

|
#48
Lane
Susquehanna, PA 18847
|
- sq. feet
|
- baths - beds |
show details | |

|
#49
Matthew Ln
Harpursville, NY 13787
|
- sq. feet
|
- baths - beds |
show details | |

|
Check over 1 million property listings on Foreclosure.com!
|
browse all offers | |||


Median year apartment built: 1973
Household type by relationship:
Households: 592- Male householders: 118 (19 living alone), Female householders: 101 (60 living alone)
44 spouses (44 opposite-sex spouses), 53 unmarried partners, (51 opposite-sex unmarried partners), 152 children (136 natural, 0 adopted, 15 stepchildren), 4 grandchildren, 8 brothers or sisters, 9 parents, 0 foster children, 0 other relatives, 38 non-relatives
- In group quarters: 56
Size of family households: 49 2-persons, 23 3-persons, 4 4-persons, 49 5-persons, 1 6-persons.
Size of nonfamily households: 83 1-person, 13 2-persons.
47 married couples with children.
68 single-parent households (54 men, 14 women).
99.4% of residents of Lanesboro speak English at home.
0.6% of residents speak Asian or Pacific Island language at home (100% speak English very well).
Foreign born population: 3 (0.5%)
(100.0% of them are naturalized citizens)
| Here: | 6.4 |
| State: | 6.8 |
| Here: | 4.8 |
| State: | 4.3 |

- Bedrooms in owner-occupied houses and condos in Lanesboro, Pennsylvania
- 0no bedroom
- 51 bedroom
- 192 bedrooms
- 573 bedrooms
- 154 bedrooms
- 105+ bedrooms

- Bedrooms in renter-occupied apartments in Lanesboro, Pennsylvania
- 0no bedroom
- 471 bedroom
- 162 bedrooms
- 503 bedrooms
- 04 bedrooms
- 55+ bedrooms

- Cars and other vehicles available in Lanesboro in owner-occupied houses/condos
- 4no vehicle
- 121 vehicle
- 542 vehicles
- 303 vehicles
- 34 vehicles
- 45+ vehicles

- Cars and other vehicles available in Lanesboro in renter-occupied apartments
- 20no vehicle
- 351 vehicle
- 112 vehicles
- 493 vehicles
- 04 vehicles
- 35+ vehicles

- Rooms in owner-occupied houses in Lanesboro, Pennsylvania
- 01 room
- 02 rooms
- 03 rooms
- 54 rooms
- 385 rooms
- 126 rooms
- 107 rooms
- 168 rooms
- 259+ rooms

- Rooms in renter-occupied apartments in Lanesboro, Pennsylvania
- 01 room
- 32 rooms
- 323 rooms
- 74 rooms
- 515 rooms
- 136 rooms
- 37 rooms
- 48 rooms
- 59+ rooms


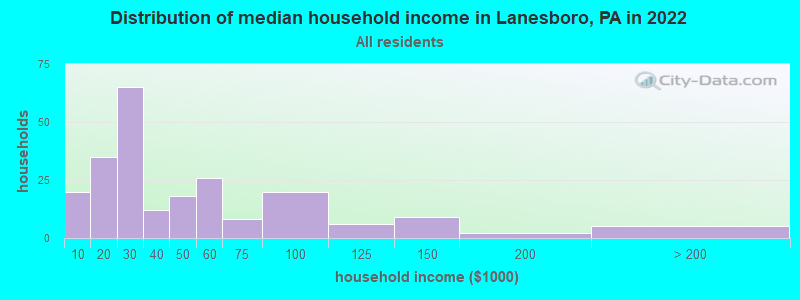
Lanesboro, PA household income distribution

- 20Less than $10,000
- 35$10,000 to $19,999
- 65$20,000 to $29,999
- 12$30,000 to $39,999
- 18$40,000 to $49,999
- 26$50,000 to $59,999
- 8$60,000 to $74,999
- 20$75,000 to $99,999
- 6$100,000 to $124,999
- 9$125,000 to $149,999
- 2$150,000 to $199,999
- 5$200,000 or more
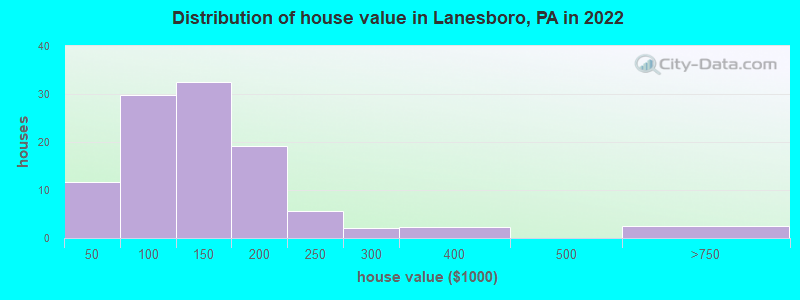
Home value of owner - occupied houses in 2022 in Lanesboro, PA
-
- 0$25,000 to $29,999
- 10$40,000 to $49,999
- 1$50,000 to $59,999
- 2$60,000 to $69,999
- 7$80,000 to $89,999
- 7$90,000 to $99,999
- 32$100,000 to $124,999
- 10$150,000 to $174,999
- 8$175,000 to $199,999
- 5$200,000 to $249,999
- 2$250,000 to $299,999
- 2$300,000 to $399,999
- 2$500,000 to $749,999
Rent paid by renters in 2022 in Lanesboro, PA
-
- 8$200 to $249
- 7$250 to $299
- 8$300 to $349
- 6$350 to $399
- 11$450 to $499
- 2$500 to $549
- 3$550 to $599
- 16$650 to $699
- 4$700 to $749
- 0$750 to $799
- 39$900 to $999
- 3$1,000 to $1,249
- 2No cash rent


Percentage of workers working in this county: 59.4%
Number of people working at home: 6 (3.6% of all workers)
Travel time to work (commute)
- Less than 5 minutes: 8
- 5 to 9 minutes: 10
- 10 to 14 minutes: 5
- 15 to 19 minutes: 5
- 20 to 24 minutes: 51
- 25 to 29 minutes: 5
- 30 to 34 minutes: 15
- 35 to 39 minutes: 15
- 40 to 44 minutes: 19
- 45 to 59 minutes: 11
- 60 to 89 minutes: 0
- 90 or more minutes: 2
Means of transportation to work:
- Drove a car alone: 187 (78.9%)
- Carpooled: 27 (11.4%)
- Walked: 8 (3.4%)
- Other means: 2 (0.8%)
- Worked at home: 13 (5.5%)

- Unemployment by race in 2022
- Unemployment rate for White non-Hispanic residents
- 2.1%Males
- 2.4%Females

- Year of entry for the foreign-born population in Lanesboro, Pennsylvania
- 02010 or later
- 02000 to 2009
- 01990 to 1999
- 71980 to 1989
- 21970 to 1979
- 11Before 1970

First ancestries reported:
- Irish: 115 (53.0%)
- German: 25 (11.5%)
- Polish: 20 (9.2%)
- English: 10 (4.6%)
- Italian: 8 (3.7%)
- Dutch: 6 (2.8%)
- Russian: 6 (2.8%)
- Scottish: 4 (1.8%)
- French: 3 (1.4%)
- American: 1 (0.5%)
Most common places of birth for foreign-born residents (%):
| Lanesboro: | 66.7% (2) |
| Pennsylvania: | 0.5% (4,593) |
Place of birth for U.S.-born residents:
- This state: 360
- Other state: 228
- Northeast: 173
- Midwest: 0
- South: 16
- West: 39
73.5% of Lanesboro residents lived in the same house 1 years ago.
Out of people who lived in different houses, 12.4% lived in this county.
Out of people who lived in different counties, 100.0% lived in Pennsylvania.
| Lanesboro: | 73.5% |
| State average: | 89.3% |
Education attainment for males 25 years and older:
- No schooling: 0
- Nursery to 4th grade: 0
- 5th and 6th grade: 0
- 7th and 8th grade: 5
- 9th grade: 4
- 10th grade: 3
- 11th grade: 0
- 12th grade, no diploma: 3
- High school graduate (or equivalency): 146
- Less than 1 year of college: 10
- Some college more than 1 year, no degree: 0
- Associate degree: 17
- Bachelor's degree: 3
- Master's degree: 0
- Professional school degree: 0
- Doctorate degree: 0

Education attainment for females 25 years and older:
- No schooling: 0
- Nursery to 4th grade: 0
- 5th and 6th grade: 0
- 7th and 8th grade: 0
- 9th grade: 0
- 10th grade: 0
- 11th grade: 5
- 12th grade, no diploma: 0
- High school graduate (or equivalency): 159
- Less than 1 year of college: 20
- Some college more than 1 year, no degree: 10
- Associate degree: 2
- Bachelor's degree: 9
- Master's degree: 11
- Professional school degree: 0
- Doctorate degree: 0


Housing units in structures:
- One, detached: 180
- Two: 11
- 3 or 4: 7
- 5 to 9: 8
- 20 to 49: 9
- 50 or more: 29
- Mobile homes: 11
Median worth of mobile homes: $201,463
House/condo owner moved in on average 17 years ago
Renter moved in on average 1 years ago

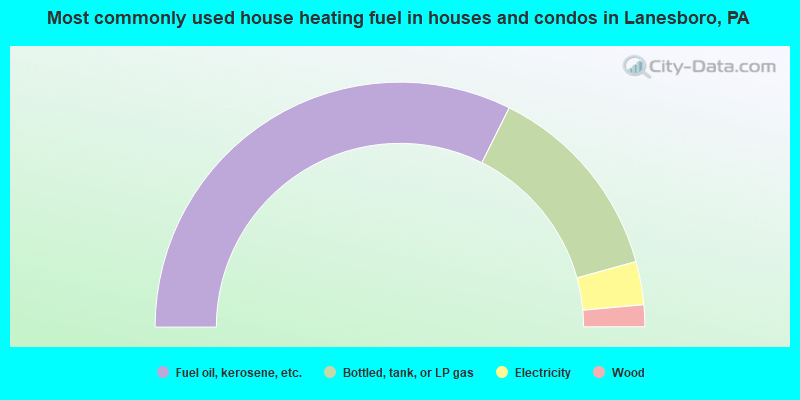
- 64.8%Fuel oil, kerosene, etc.
- 26.7%Bottled, tank, or LP gas
- 5.7%Electricity
- 2.9%Wood
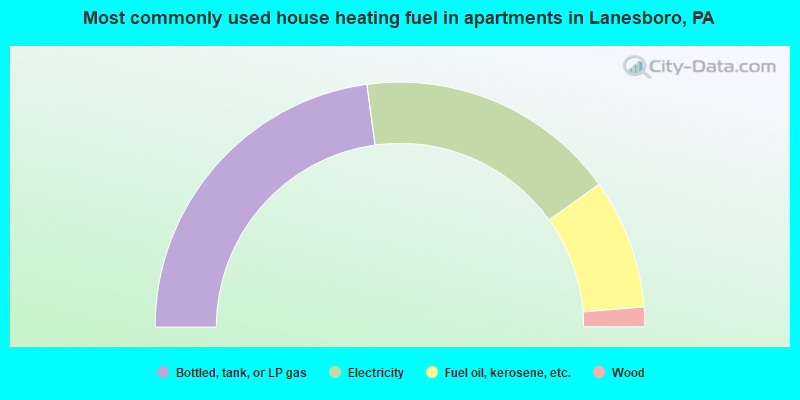
- 45.7%Bottled, tank, or LP gas
- 34.5%Electricity
- 17.2%Fuel oil, kerosene, etc.
- 2.6%Wood
Private vs. public school enrollment:
| Here: | 0.0% |
| Pennsylvania: | 15.7% |
| Here: | 0.0% |
| Pennsylvania: | 13.4% |
| Here: | 42.9% |
| Pennsylvania: | 39.8% |


